 RSS Feed
 by Calculated Risk on 10/07/2022 12:50:00 PM
Friday, October 07, 2022
Realtor.com Reports Weekly Active Inventory Up 30% Year-over-year; New Listings Down 17%
Realtor.com has monthly and weekly data on the existing home market. Here is their weekly report released yesterday from Chief Economist Danielle Hale and Jiayi Xu: Weekly Housing Trends View — Data Week Ending Oct 1, 2022. Note: They have data on list prices, new listings and more, but this focus is on inventory.
• Active inventory continued to grow, increasing 30% above one year ago. Highlighting the roller coaster ride that the housing market and its participants have been on in the last few years, one’s take on the current number of homes for sale depends very much on the comparison point. After a period of unusually hot activity, financial conditions are cooling demand in the housing market and there are substantially more homes for-sale compared to one year ago. However, the market still falls short of pre-pandemic inventory levels by an even greater amount.
...
• New listings–a measure of sellers putting homes up for sale–were again down, dropping 17% from one year ago. This week marks the thirteenth straight week of year over year declines in the number of new listings coming up for sale. As mortgage rates near 7 percent, which is a level not seen in more than two decades, sellers who are also trying to buy a home, nearly 3 of every 4 potential sellers, have had to alter their trade-up plans.
 Here is a graph of the year-over-year change in inventory according to realtor.com.
 Note the rapid increase in the YoY change earlier this year, from down 30% at the beginning of the year, to up 29% YoY at the beginning of July.
However, the Realtor.com data has been stuck at up around 26% to 30% YoY for 14 weeks in a row. This is due to the slowdown in new listings, even as sales have fallen sharply.
Q3 GDP Tracking Close to 2%
by Calculated Risk on 10/07/2022 12:49:00 PM
From BofA:
The narrowing of the August trade deficit to $67.4bn was slightly more than expected. After rounding, the data since our last weekly publication caused our 3Q US GDP tracking estimate to remain at 1.5% q/q saar. [October 7th estimate]From Goldman:
emphasis added
We left our Q3 GDP tracking estimate unchanged at +1.9% (qoq ar). [October 7th estimate]And from the Altanta Fed: GDPNow
The GDPNow model estimate for real GDP growth (seasonally adjusted annual rate) in the third quarter of 2022 is 2.9 percent on October 7, up from 2.7 percent on October 5. After this morning's employment situation report by the US Bureau of Labor Statistics and the wholesale trade report from the US Census Bureau, the nowcasts of third-quarter real personal consumption expenditures growth and third-quarter real gross private domestic investment growth increased from 1.1 percent and -3.6 percent, respectively, to 1.3 percent and -3.4 percent, respectively. [October 7th estimate]
Comments on September Employment Report
by Calculated Risk on 10/07/2022 09:40:00 AM
The headline jobs number in the September employment report was slightly above expectations, and employment for the previous two months was revised up by 11,000, combined. The participation rate decreased, pushing down the unemployment rate to 3.5% - equaling the lowest unemployment rate since 1969! And the employment-population ratio was unchanged.
Leisure and hospitality gained 83 thousand jobs in September. At the beginning of the pandemic, in March and April of 2020, leisure and hospitality lost 8.20 million jobs, and are now down 1.14 million jobs since February 2020. So, leisure and hospitality has now added back about 86% all of the jobs lost in March and April 2020.
Construction employment increased 19 thousand and is now 95 thousand above the pre-pandemic level.
Manufacturing added 22 thousand jobs and is now 163 thousand above the pre-pandemic level.
Education: As expected, fewer educators than usual were hired in September, and this resulted in a seasonally adjusted loss of 29 thousand jobs education jobs.
Earlier: September Employment Report: 263 thousand Jobs, 3.5% Unemployment Rate
In September, the year-over-year employment change was 5.69 million jobs.
Prime (25 to 54 Years Old) Participation
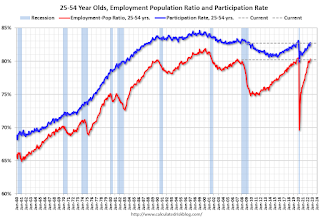 Since the overall participation rate has declined due to cyclical (recession) and demographic (aging population, younger people staying in school) reasons, here is the employment-population ratio for the key working age group: 25 to 54 years old.
The 25 to 54 participation rate decreased in September to 82.7% from 82.8% in August, and the 25 to 54 employment population ratio decreased to 80.2% from 80.3% the previous month.
Both are close to the pre-pandemic levels and indicate almost all of the prime age workers have returned to the labor force.
Part Time for Economic Reasons
 From the BLS report:
These workers are included in the alternate measure of labor underutilization (U-6) that decreased to 6.7% from 7.0% in the previous month. This is down from the record high in April 22.9%, and matches the lowest level on record for this measure since 1994. This measure is below the level in February 2020 (pre-pandemic).
Unemployed over 26 Weeks
 This graph shows the number of workers unemployed for 27 weeks or more.
According to the BLS, there are 1.067 million workers who have been unemployed for more than 26 weeks and still want a job, down from 1.137 million the previous month.
This is back to pre-pandemic levels.
Summary:
The headline monthly jobs number was slightly above expectations and employment for the previous two months was revised up by 11,000, combined.
Part Time for Economic Reasons
 From the BLS report:
"The number of persons employed part time for economic reasons decreased by 306,000 to 3.8 million in September. These individuals, who would have preferred full-time employment, were working part time because their hours had been reduced or they were unable to find full-time jobs."The number of persons working part time for economic reasons decreased in September to 3.843 million from 4.149 million in August. This is below pre-recession levels.
These workers are included in the alternate measure of labor underutilization (U-6) that decreased to 6.7% from 7.0% in the previous month. This is down from the record high in April 22.9%, and matches the lowest level on record for this measure since 1994. This measure is below the level in February 2020 (pre-pandemic).
Unemployed over 26 Weeks
 This graph shows the number of workers unemployed for 27 weeks or more.
 According to the BLS, there are 1.067 million workers who have been unemployed for more than 26 weeks and still want a job, down from 1.137 million the previous month.
This is back to pre-pandemic levels.
Summary:
The headline monthly jobs number was slightly above expectations and employment for the previous two months was revised up by 11,000, combined.
The headline unemployment rate decreased to 3.5%.
Overall, this was another solid employment report.
September Employment Report: 263 thousand Jobs, 3.5% Unemployment Rate
by Calculated Risk on 10/07/2022 08:44:00 AM
From the BLS:
Total nonfarm payroll employment increased by 263,000 in September, and the unemployment rate edged down to 3.5 percent, the U.S. Bureau of Labor Statistics reported today. Notable job gains occurred in leisure and hospitality and in health care.
...
The change in total nonfarm payroll employment for July was revised up by 11,000, from +526,000 to +537,000, and the change for August remained at +315,000. After revision, employment gains in July and August combined were 11,000 higher than previously reported
emphasis added
 Click on graph for larger image.
The first graph shows the job losses from the start of the employment recession, in percentage terms.
The current employment recession was by far the worst recession since WWII in percentage terms.
However, as of August, all of the jobs have returned and are now 514 thousand above pre-pandemic levels. I'll post this graph through the January 2023 report (includes the annual revision).
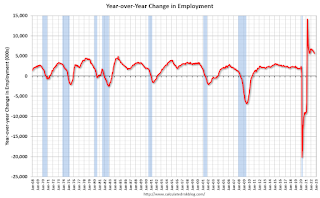 The second graph shows the year-over-year change in total non-farm employment since 1968.
In September, the year-over-year change was 5.69 million jobs. Employment was up significantly year-over-year.
Total payrolls increased by 263 thousand in September. Private payrolls increased by 288 thousand, and public payrolls decreased 25 thousand.
Payrolls for July and August were revised up 11 thousand, combined.
The third graph shows the employment population ratio and the participation rate.
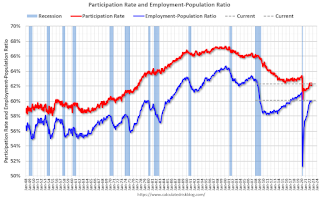 The Labor Force Participation Rate decreased to 62.3% in September, from 62.4% in August. This is the percentage of the working age population in the labor force.
The Employment-Population ratio was unchanged at 60.1% (blue line).
I'll post the 25 to 54 age group employment-population ratio graph later.
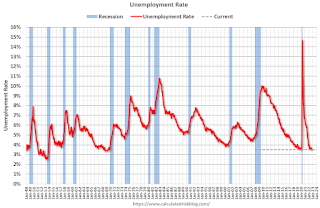 The fourth graph shows the unemployment rate.
The unemployment rate was decreased in September to 3.5% from 3.7% in August.
This was slightly above consensus expectations; and July and August payrolls were revised up by 11,000 combined.
 The second graph shows the year-over-year change in total non-farm employment since 1968.
In September, the year-over-year change was 5.69 million jobs. Employment was up significantly year-over-year.
Total payrolls increased by 263 thousand in September. Private payrolls increased by 288 thousand, and public payrolls decreased 25 thousand.
Payrolls for July and August were revised up 11 thousand, combined.
The third graph shows the employment population ratio and the participation rate.
 The Labor Force Participation Rate decreased to 62.3% in September, from 62.4% in August. This is the percentage of the working age population in the labor force.
 The Employment-Population ratio was unchanged at 60.1% (blue line).
I'll post the 25 to 54 age group employment-population ratio graph later.
 The fourth graph shows the unemployment rate.
 The unemployment rate was decreased in September to 3.5% from 3.7% in August.
This was slightly above consensus expectations; and July and August payrolls were revised up by 11,000 combined.
I'll have more later ...
Thursday, October 06, 2022
Friday: Employment Report
by Calculated Risk on 10/06/2022 08:29:00 PM
 My September Employment Preview
Goldman September Payrolls Preview
Friday:
• At 8:30 AM ET, Employment Report for September. The consensus is for 250,000 jobs added, and for the unemployment rate to be unchanged at 3.7%.
Goldman September Payrolls Preview
by Calculated Risk on 10/06/2022 04:25:00 PM
A few brief excerpts from a note by Goldman Sachs economist Spencer Hill:
We estimate nonfarm payrolls rose by 200k in September (mom sa), 50k below consensus and a slowdown from the +315k pace in August. ... We estimate the unemployment rate was unchanged at 3.7% in September ...CR Note: The consensus is for 250 thousand jobs added, and for the unemployment rate to be unchanged at 3.7%.
emphasis added
September Employment Preview
by Calculated Risk on 10/06/2022 02:16:00 PM
On Friday at 8:30 AM ET, the BLS will release the employment report for September. The consensus is for 250,000 jobs added, and for the unemployment rate to be unchanged at 3.7%.
 Click on graph for larger image.
• First, as of August there are 240 thousand more jobs than in February 2020 (the month before the pandemic).
This graph shows the job losses from the start of the employment recession, in percentage terms. As of August 2022, all of the jobs have returned.
This doesn't include the preliminary benchmark revision that showed there were 462 thousand more jobs than originally reported in March 2022.
• ADP Report: The ADP employment report showed 208,000 private sector jobs were added in September. This is the second release of ADP's new methodology, and this suggests job gains inline with consensus expectations.
• ISM Surveys: Note that the ISM services are diffusion indexes based on the number of firms hiring (not the number of hires). The ISM® manufacturing employment index decreased in September to 48.7%, down from 54.2% last month. This would suggest 25,000 jobs lost in manufacturing.
The ISM® services employment index increased in September to 53.0%, down from 50.2% last month. This would suggest service employment increased 155,000 in September.
Combined, the ISM surveys suggest 130,000 jobs added in September (below the consensus forecast).
• Unemployment Claims: The weekly claims report showed a decrease in the number of initial unemployment claims during the reference week (includes the 12th of the month) from 245,000 in August to 209,000 in September. This would usually suggest fewer layoffs in September than in August. In general, weekly claims were lower than expectations in September.
• COVID: As far as the pandemic, the number of daily cases during the reference week in September was around 70,000, down from 115,000 in August.
• Conclusion: The consensus is for job growth to slow to 250,000 jobs added in September. The ADP report was in line with expectations, and weekly claims were positive. However, it seems likely that education will disappoint seasonally adjusted, so I expect the headline jobs number to be at or below the consensus forecast.
Hotels: Occupancy Rate Down 2.4% Compared to Same Week in 2019
by Calculated Risk on 10/06/2022 01:50:00 PM
As expected with the Rosh Hashanah holiday, U.S. hotel performance dropped from the previous week and showed mixed comparisons with 2019, according to STR‘s latest data through Oct. 1.The following graph shows the seasonal pattern for the hotel occupancy rate using the four-week average.
Sept. 25 through Oct. 1, 2022 (percentage change from comparable week in 2019*):
• Occupancy: 66.4% (-2.4%)
• Average daily rate (ADR): $149.71 (+15.7%)
• Revenue per available room (RevPAR): $99.36 (+12.9%)
In addition to the Rosh Hashanah impact on business travel and groups in the major markets, there were demand shifts in the southeast region due to Hurricane Ian. ...
*Due to the pandemic impact, STR is measuring recovery against comparable time periods from 2019.
emphasis added
 Click on graph for larger image.
The red line is for 2022, black is 2020, blue is the median, and dashed light blue is for 2021. Dashed purple is 2019 (STR is comparing to a strong year for hotels).
The 4-week average of the occupancy rate is close to the median rate for the previous 20 years (Blue).
Note: Y-axis doesn't start at zero to better show the seasonal change.
The 4-week average of the occupancy rate will increase over the next few weeks during the Fall business travel period, and then decline into the Winter.
"For many [home] sellers, it likely feels like the rug has been pulled out from underneath them"
by Calculated Risk on 10/06/2022 10:34:00 AM
Today, in the Calculated Risk Real Estate Newsletter: "For many [home] sellers, it likely feels like the rug has been pulled out from underneath them"
A brief excerpt:
A few early reporting markets …There is much more in the article. You can subscribe at https://calculatedrisk.substack.com/
This is the first look at local markets in September. I’m tracking about 35 local housing markets in the US. Some of the 35 markets are states, and some are metropolitan areas. I’ll update these tables throughout the month as additional data is released.
...
From Denver Metro Association of Realtors® (DMAR): DMAR Real Estate Market Trends ReportUsing months of inventory as a metric indicates that Denver Metro is moving toward a balanced market. … However, for many sellers, it likely feels like the rug has been pulled out from underneath them.In September, sales were down 33.1%. In August, these same markets were down 32.4% YoY Not Seasonally Adjusted (NSA).
Note that in September 2022, there were the same number of selling days as in September 2021, so the SA decline will be similar to the NSA decline. Last month, in August 2022, there was one more selling day than in August 2021 - so seasonally adjusted, the decline in sales in August was larger than in September for these markets.
Many more local markets to come!

Weekly Initial Unemployment Claims increase to 219,000
by Calculated Risk on 10/06/2022 08:33:00 AM
The DOL reported:
In the week ending October 1, the advance figure for seasonally adjusted initial claims was 219,000, an increase of 29,000 from the previous week's revised level. The previous week's level was revised down by 3,000 from 193,000 to 190,000. The 4-week moving average was 206,500, an increase of 250 from the previous week's revised average. The previous week's average was revised down by 750 from 207,000 to 206,250.The following graph shows the 4-week moving average of weekly claims since 1971.
emphasis added
 Click on graph for larger image.
The dashed line on the graph is the current 4-week average. The four-week average of weekly unemployment claims increased to 206,500.
The previous week was revised down.
Weekly claims were higher than the consensus forecast.


