 RSS Feed
 by Calculated Risk on 8/16/2022 08:57:00 PM
Tuesday, August 16, 2022
Wednesday: Retail Sales, FOMC Minutes
Wednesday:
• At 7:00 AM ET, The Mortgage Bankers Association (MBA) will release the results for the mortgage purchase applications index.
• At 8:30 AM, Retail sales for July is scheduled to be released. The consensus is for 0.1% increase in retail sales.
• At 2:00 PM, FOMC Minutes, Meeting of July 26-27, 2022
On COVID (focus on hospitalizations and deaths):
Hospitalizations have almost quadrupled from the lows in April 2022.
 Click on graph for larger image.
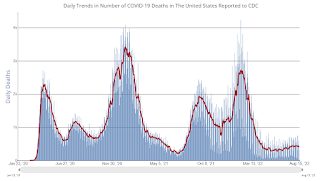
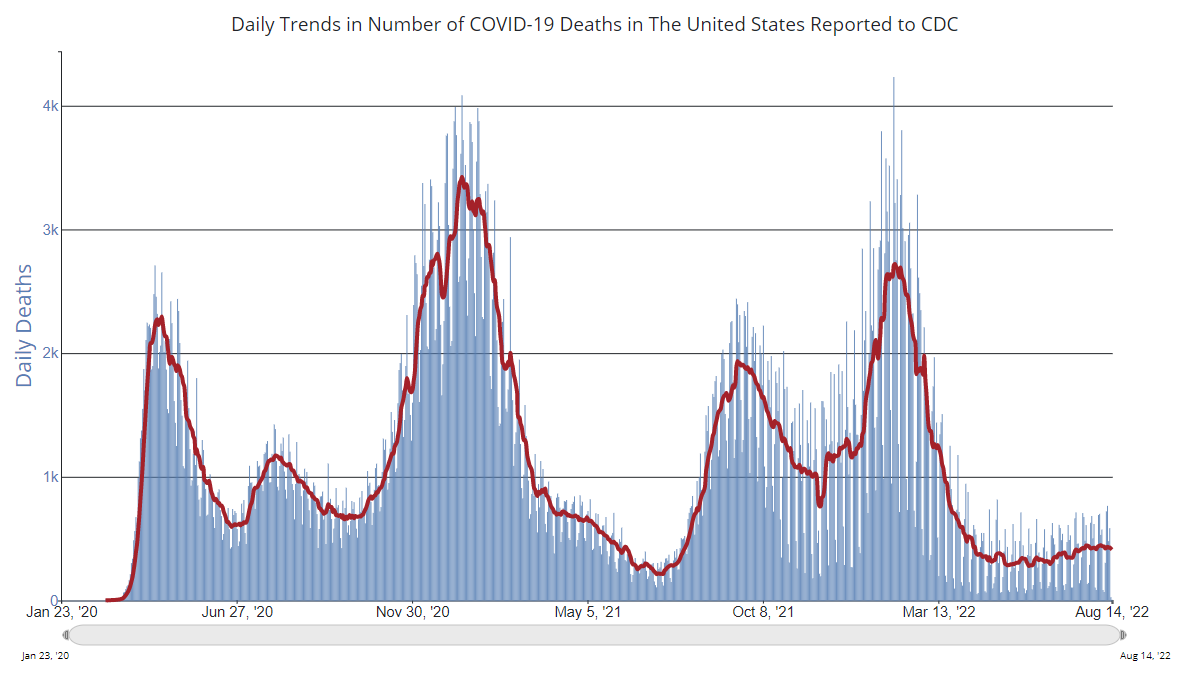
This graph shows the daily (columns) and 7-day average (line) of deaths reported.
| COVID Metrics | ||||
|---|---|---|---|---|
| Now | Week Ago | Goal | ||
| New Cases per Day2 | 98,229 | 111,892 | ≤5,0001 | |
| Hospitalized2 | 35,139 | 37,284 | ≤3,0001 | |
| Deaths per Day2 | 415 | 422 | ≤501 | |
| 1my goals to stop daily posts, 27-day average for Cases, Currently Hospitalized, and Deaths 🚩 Increasing 7-day average week-over-week for Cases, Hospitalized, and Deaths ✅ Goal met. | ||||
 Click on graph for larger image.
This graph shows the daily (columns) and 7-day average (line) of deaths reported.
Average daily deaths bottomed in July 2021 at 214 per day.
Lawler: Early Read on Existing Home Sales in July
by Calculated Risk on 8/16/2022 01:18:00 PM
From housing economist Tom Lawler:
Based on publicly-available local realtor/MLS reports released across the country through today, I project that existing home sales as estimated by the National Association of Realtors ran at a seasonally adjusted annual rate of 4.90 million in July, down 4.3% from June’s preliminary pace and down 18.7% from last July’s seasonally adjusted pace. Unadjusted sales should show a larger YOY % decline, reflecting the lower business day count this July compared to last July. While virtually all markets saw a significant YOY decline in sales last month, the West region saw an especially large drop -- about 33% (NSA) by my estimate.
Local realtor reports, as well as reports from national inventory trackers, suggest that the inventory of existing homes for sale last month was up substantially from a year earlier. However, the NAR’s estimate may not show the same increase as these reports suggest, as most of these reports exclude listings with pending contracts. E.g., the Realtor.com report for July showed that listings excluding those with pending contracts were up 30.7% from last July, while listings including pending contracts were up just 3.5% YOY. (Pending listings in the Realtor.com report were down 19.4% from last July.) The NAR’s inventory estimate has tracked the Realtor.com total inventory measure more closely that the “ex-pendings” inventory measure. (Note also that the Realtor.com inventory number reflects average listings during the month, while the NAR inventory number is an end-of-month estimate.) Just as the NAR inventory number understated the decline in “effective” homes for sale during most of last year, it is now significantly understating the increase in effective inventory.
Finally, local realtor/MLS reports suggest the median existing single-family home sales price last month was up by about 10.6% from last July, a marked YOY deceleration from earlier this year.
CR Note: The National Association of Realtors (NAR) is scheduled to release July existing home sales on Thursday, August 18, 2022, at 10:00 AM ET. The consensus is for 4.88 million SAAR.
July Housing Starts: Units Under Construction Declined Slightly
by Calculated Risk on 8/16/2022 10:47:00 AM
Today, in the CalculatedRisk Real Estate Newsletter: July Housing Starts: Units Under Construction Declined Slightly
Excerpt:
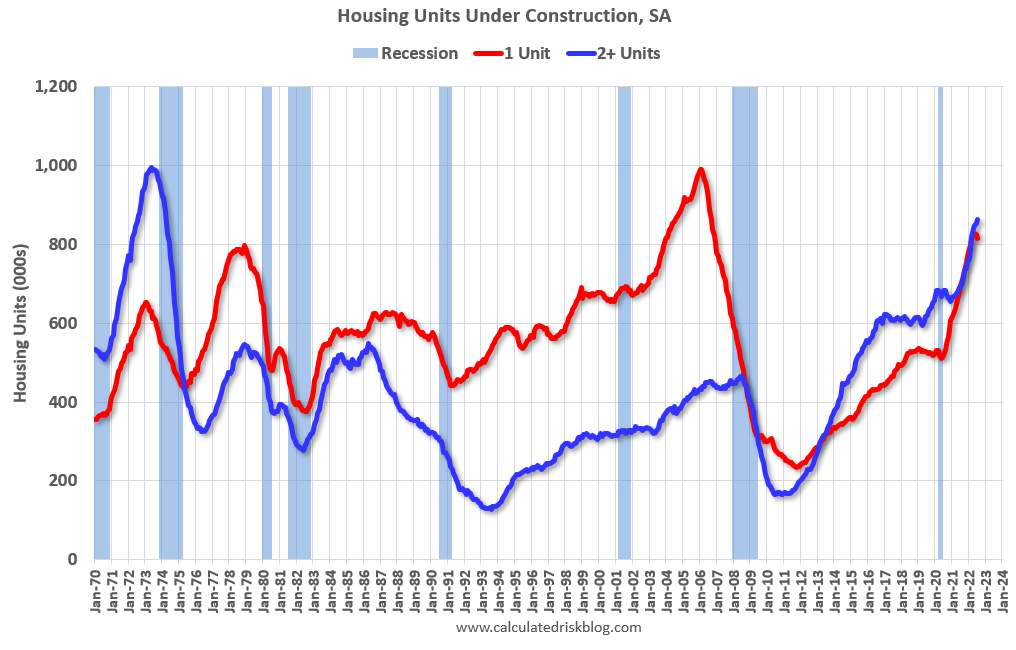
The fourth graph shows housing starts under construction, Seasonally Adjusted (SA).There is much more in the post. You can subscribe at https://calculatedrisk.substack.com/ (Most content is available for free, so please subscribe).
Red is single family units. Currently there are 816 thousand single family units under construction (SA). This is just below the previous three months, and 12 thousand below the peak in April and May. Single family units under construction have peaked since single family starts are now declining. The reason there are so many homes under construction is probably due to supply constraints.
Blue is for 2+ units. Currently there are 862 thousand multi-family units under construction. This is the highest level since March 1974! For multi-family, construction delays are probably also a factor. The completion of these units should help with rent pressure.
Combined, there are 1.678 million units under construction. This is just below the all-time record set last month of 1.680 million units that were under construction.
Industrial Production Increased 0.6 Percent in July
by Calculated Risk on 8/16/2022 09:21:00 AM
From the Fed: Industrial Production and Capacity Utilization
In July, total industrial production increased 0.6 percent. Manufacturing output gained 0.7 percent after having fallen 0.4 percent in each of the two previous months. The production of motor vehicles and parts rose 6.6 percent, while factory output elsewhere moved up 0.3 percent. The index for mining increased 0.7 percent, while the index for utilities decreased 0.8 percent. At 104.8 percent of its 2017 average, total industrial production in July was 3.9 percent above its year-earlier level. Capacity utilization moved up 0.4 percentage point in July to 80.3 percent, a rate that is 0.7 percentage point above its long-run (1972–2021) average.
emphasis added
 Click on graph for larger image.
This graph shows Capacity Utilization. This series is up from the record low set in April 2020, and above the level in February 2020 (pre-pandemic).
Capacity utilization at 80.3% is 0.7% above the average from 1972 to 2021. This was above consensus expectations.
Note: y-axis doesn't start at zero to better show the change.
 The second graph shows industrial production since 1967.
Industrial production decreased in June to 104.8. This is above the pre-pandemic level.
The change in industrial production was above consensus expectations.
Housing Starts Decreased to 1.446 million Annual Rate in July
by Calculated Risk on 8/16/2022 08:38:00 AM
From the Census Bureau: Permits, Starts and Completions
Housing Starts:
Privately‐owned housing starts in July were at a seasonally adjusted annual rate of 1,446,000. This is 9.6 percent below the revised June estimate of 1,599,000 and is 8.1 percent below the July 2021 rate of 1,573,000. Single‐family housing starts in July were at a rate of 916,000; this is 10.1 percent below the revised June figure of 1,019,000. The July rate for units in buildings with five units or more was 514,000.
Building Permits:
Privately‐owned housing units authorized by building permits in July were at a seasonally adjusted annual rate of 1,674,000. This is 1.3 percent below the revised June rate of 1,696,000, but is 1.1 percent above the July 2021 rate of 1,655,000. Single‐family authorizations in July were at a rate of 928,000; this is 4.3 percent below the revised June figure of 970,000. Authorizations of units in buildings with five units or more were at a rate of 693,000 in July.
emphasis added
 Click on graph for larger image.
The first graph shows single and multi-family housing starts for the last several years.
Multi-family starts (blue, 2+ units) decreased in July compared to June. Multi-family starts were up 18.0% year-over-year in July.
Single-family starts (red) decreased in July and were down 18.5% year-over-year.
 The second graph shows single and multi-family housing starts since 1968.
 This shows the huge collapse following the housing bubble, and then the eventual recovery.
Total housing starts in July were below expectations, however, starts in May and June were revised up slightly, combined.
I'll have more later …
Monday, August 15, 2022
Tuesday: Housing Starts, Industrial Production
by Calculated Risk on 8/15/2022 08:42:00 PM
 From Matthew Graham at Mortgage News Daily: Mortgage Rates Slightly Lower to Begin The Week
After rising above 6% in June and falling briefly below 5% by August 1st, mortgage rates have been calming down and staying slightly flatter in the big picture. Last week's highest levels were seen on Thursday afternoon or Friday morning depending on the lender. Today's rates are back down to the levels seen earlier in the week. [30 year fixed 5.25%]Tuesday:
emphasis added
• At 8:30 AM ET: Housing Starts for July. The consensus is for 1.540 million SAAR, down from 1.559 million SAAR in June.
• At 9:15 AM, The Fed will release Industrial Production and Capacity Utilization for July. The consensus is for a 0.3% increase in Industrial Production, and for Capacity Utilization to increase to 80.1%.
On COVID (focus on hospitalizations and deaths):
Hospitalizations have almost quadrupled from the lows in April 2022.
 Click on graph for larger image.
This graph shows the daily (columns) and 7-day average (line) of deaths reported.
| COVID Metrics | ||||
|---|---|---|---|---|
| Now | Week Ago | Goal | ||
| New Cases per Day2 | 95,209 | 114,409 | ≤5,0001 | |
| Hospitalized2 | 32,099 | 37,287 | ≤3,0001 | |
| Deaths per Day2 | 411 | 4369 | ≤501 | |
| 1my goals to stop daily posts, 27-day average for Cases, Currently Hospitalized, and Deaths 🚩 Increasing 7-day average week-over-week for Cases, Hospitalized, and Deaths ✅ Goal met. | ||||
 Click on graph for larger image.
This graph shows the daily (columns) and 7-day average (line) of deaths reported.
Average daily deaths bottomed in July 2021 at 214 per day.
MBA Survey: "Share of Mortgage Loans in Forbearance Decreases to 0.74% in July"
by Calculated Risk on 8/15/2022 05:08:00 PM
Note: This is as of July 31st.
From the MBA: Share of Mortgage Loans in Forbearance Decreases to 0.74% in July
The Mortgage Bankers Association’s (MBA) monthly Loan Monitoring Survey revealed that the total number of loans now in forbearance decreased by 7 basis points from 0.81% of servicers’ portfolio volume in the prior month to 0.74% as of July 31, 2022. According to MBA’s estimate, 370,000 homeowners are in forbearance plans.
The share of Fannie Mae and Freddie Mac loans in forbearance decreased 1 basis point to 0.34%. Ginnie Mae loans in forbearance remained the same relative to the previous month at 1.26%, and the forbearance share for portfolio loans and private-label securities (PLS) declined 34 basis points to 1.34%.
“July continued the ongoing trend in recent months of most of the forbearance exits coming from borrowers with portfolio loans and private label security loans,” said Marina Walsh, CMB, MBA’s Vice President of Industry Analysis. “There has been very little change in the forbearance rate for Fannie Mae, Freddie Mac, and Ginnie Mae loans during the past three months, perhaps indicating that we have reached a floor, with loans entering forbearance about equal to loans exiting forbearance for these loan types.”
emphasis added
 Click on graph for larger image.
This graph shows the percent of portfolio in forbearance by investor type over time.
The share of forbearance plans is decreasing, and, at the end of July, there were about 370,000 homeowners in forbearance plans.
3rd Look at Local Housing Markets in July, Sales Down Sharply
by Calculated Risk on 8/15/2022 02:38:00 PM
Today, in the Calculated Risk Real Estate Newsletter: 3rd Look at Local Housing Markets in July, Sales Down Sharply
A brief excerpt:
The big story for July existing home sales is the sharp year-over-year (YoY) decline in sales. Another key story is that new listings are down YoY in July. Of course, active listings are up sharply.There is much more in the article. You can subscribe at https://calculatedrisk.substack.com/
...
Last month, all local markets I track were down 15.9% YoY, NSA. This appears to be another step down in sales, although there was one less selling day in July this year than in July 2021.
Here is a table comparing the year-over-year Not Seasonally Adjusted (NSA) declines in sales this year from the National Association of Realtors® (NAR) with the local markets I track. So far, these measures have tracked closely, and the preliminary data below suggests a sharp decline in sales in July.
Sales in some of the hottest markets are down 30% or more YoY, whereas in other markets, sales are only down in the high teens YoY.
...
More local markets to come!

NAHB: Builder Confidence Turns Slightly Negative in August
by Calculated Risk on 8/15/2022 10:06:00 AM
The National Association of Home Builders (NAHB) reported the housing market index (HMI) was at 49, down from 55 in July. Any number below 50 indicates that more builders view sales conditions as poor than good.
From the NAHB: Builder Confidence Underwater After Falling for Eighth Consecutive Month
Builder confidence fell for the eighth straight month in August as elevated interest rates, ongoing supply chain problems and high home prices continue to exacerbate housing affordability challenges. In another sign that a declining housing market has failed to bottom out, builder confidence in the market for newly built single-family homes fell six points in August to 49, marking the first time since May 2020 that the index fell below the key break-even measure of 50, according to the National Association of Home Builders (NAHB)/Wells Fargo Housing Market Index (HMI) released today.
“Ongoing growth in construction costs and high mortgage rates continue to weaken market sentiment for single-family home builders,” said NAHB Chairman Jerry Konter, a home builder and developer from Savannah, Ga. “And in a troubling sign that consumers are now sitting on the sidelines due to higher housing costs, the August buyer traffic number in our builder survey was 32, the lowest level since April 2014 with the exception of the spring of 2020 when the pandemic first hit.”
“Tighter monetary policy from the Federal Reserve and persistently elevated construction costs have brought on a housing recession,” said NAHB Chief Economist Robert Dietz. “The total volume of single-family starts will post a decline in 2022, the first such decrease since 2011. However, as signs grow that the rate of inflation is near peaking, long-term interest rates have stabilized, which will provide some stability for the demand-side of the market in the coming months.”
Roughly one-in-five (19%) home builders in the HMI survey reported reducing prices in the past month to increase sales or limit cancellations. The median price reduction was 5% for those reporting using such incentives. Meanwhile, 69% of builders reported higher interest rates as the reason behind falling housing demand, the top impact cited in the survey.
...
All three HMI components posted declines in August and each fell to their lowest level since May 2020. Current sales conditions dropped seven points to 57, sales expectations in the next six months declined two points to 47 and traffic of prospective buyers fell five points to 32.
Looking at the three-month moving averages for regional HMI scores, the Northeast fell nine points to 56, the Midwest dropped three points to 49, the South fell seven points to 63 and the West posted an 11-point decline to 51.
emphasis added
 Click on graph for larger image.
This graph shows the NAHB index since Jan 1985.
This was well below the consensus forecast, and just below 50.
The "traffic of prospective buyers" is now well below breakeven at 32 (below 50).
Housing Inventory August 15th Update: Up 30.3% Year-over-year
by Calculated Risk on 8/15/2022 08:57:00 AM
Inventory is still increasing, but the inventory build has slowed somewhat over the last several weeks. Still, inventory is increasing faster than in 2019 at this time of year (both in percentage terms and in total inventory added). Here are the same week inventory changes for the last four years:
2022: +6.3K
2021: +10.4K
2020: -10.9K
2019: -0.1K
Inventory bottomed seasonally at the beginning of March 2022 and is now up 128% since then. More than double! Altos reports inventory is up 30.3% year-over-year and is now 25.8% above the peak last year.
 Click on graph for larger image.
This inventory graph is courtesy of Altos Research.
 Click on graph for larger image.
This inventory graph is courtesy of Altos Research.
As of August 12th, inventory was at 560 thousand (7-day average), compared to 554 thousand the prior week. Inventory was up 1.2% from the previous week.
Inventory is still historically low. Compared to the same week in 2021, inventory is up 30.3% from 422 thousand, however compared to the same week in 2020 inventory is down 8.6% from 602 thousand. Compared to 3 years ago, inventory is down 43.0% from 966 thousand.
Here are the inventory milestones I’m watching for with the Altos data:
1. The seasonal bottom (happened on March 4th for Altos) ✅
2. Inventory up year-over-year (happened on May 13th for Altos) ✅
3. Inventory up compared to two years ago (currently down 8.6% according to Altos)
4. Inventory up compared to 2019 (currently down 43.0%).
1. The seasonal bottom (happened on March 4th for Altos) ✅
2. Inventory up year-over-year (happened on May 13th for Altos) ✅
3. Inventory up compared to two years ago (currently down 8.6% according to Altos)
4. Inventory up compared to 2019 (currently down 43.0%).

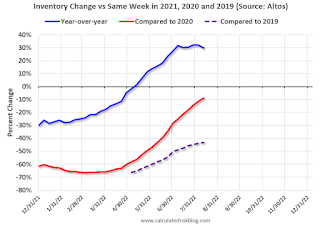
Here is a graph of the inventory change vs 2021, 2020 (milestone 3 above) and 2019 (milestone 4).
The blue line is the year-over-year data, the red line is compared to two years ago, and dashed purple is compared to 2019.
Two years ago (in 2020) inventory was declining all year, so the two-year comparison will get easier all year.
Based on the recent increases in inventory, my current estimate is inventory will be up compared to 2020 in September of this year, and it is possible inventory will be back to 2019 levels in the first half of 2023. However, if inventory growth stalls, then it might take much longer to reach normal inventory levels..
Mike Simonsen discusses this data regularly on Youtube.


