 RSS Feed
 by Calculated Risk on 8/15/2022 08:20:00 AM
Monday, August 15, 2022
Four High Frequency Indicators for the Economy
These indicators are mostly for travel and entertainment. It is interesting to watch these sectors recover as the pandemic subsides. Notes: I've added back gasoline supplied to see if there is an impact from higher gasoline prices.
The TSA is providing daily travel numbers.
This data is as of August 14th.
 Click on graph for larger image.
This data shows the 7-day average of daily total traveler throughput from the TSA for 2019 (Light Blue), 2020 (Black), 2021 (Blue) and 2022 (Red).
The dashed line is the percent of 2019 for the seven-day average.
The 7-day average is down 9.9% from the same day in 2019 (90.1% of 2019). (Dashed line)
Air travel - as a percent of 2019 - has been moving sideways over the last several months, off about 10% from 2019 - with some ups and downs, usually related to the timing of holidays.
 This data shows domestic box office for each week and the median for the years 2016 through 2019 (dashed light blue).
 Black is 2020, Blue is 2021 and Red is 2022.
The data is from BoxOfficeMojo through August 11th.
Note that the data is usually noisy week-to-week and depends on when blockbusters are released.
Movie ticket sales were at $136 million last week, down about 39% from the median for the week.
Note that the data is usually noisy week-to-week and depends on when blockbusters are released.
Movie ticket sales were at $136 million last week, down about 39% from the median for the week.
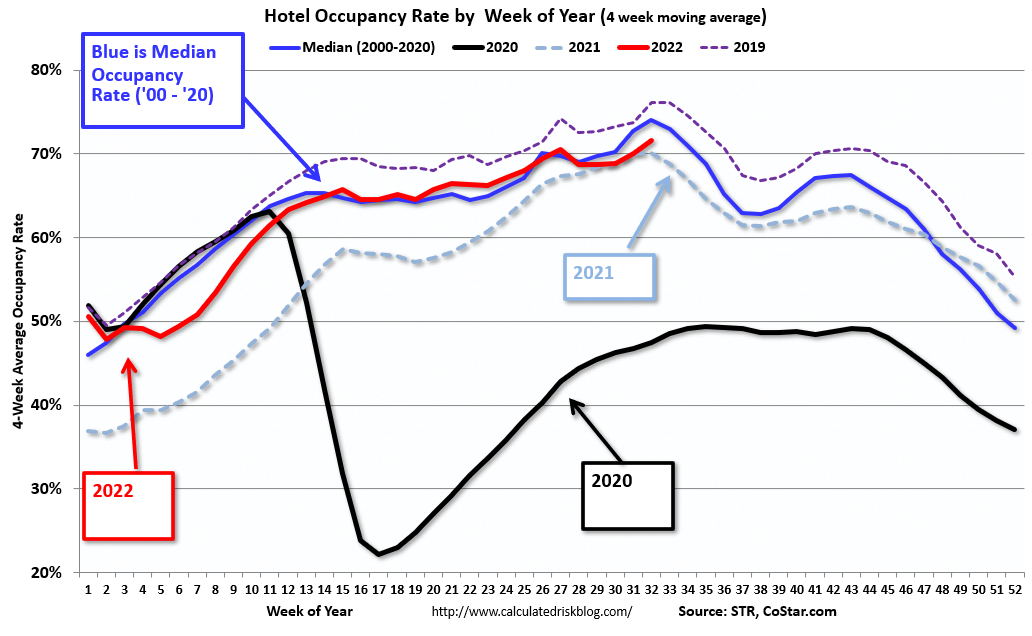 This graph shows the seasonal pattern for the hotel occupancy rate using the four-week average.
 The red line is for 2022, black is 2020, blue is the median, and dashed light blue is for 2021. Dashed purple is 2019 (STR is comparing to a strong year for hotels).
This data is through August 6th. The occupancy rate was down 5.7% compared to the same week in 2019.
The 4-week average of the occupancy rate is below the median rate for the previous 20 years (Blue).
Notes: Y-axis doesn't start at zero to better show the seasonal change.
Notes: Y-axis doesn't start at zero to better show the seasonal change.

This graph, based on weekly data from the U.S. Energy Information Administration (EIA), shows gasoline supplied compared to the same week of 2019.
Blue is for 2020. Purple is for 2021, and Red is for 2022.
As of Augustth, gasoline supplied was down 5.5% compared to the same week in 2019.
Recently gasoline supplied has been running somewhat below 2019 levels.
Sunday, August 14, 2022
Monday: NY Fed Mfg, Homebuilder Survey
by Calculated Risk on 8/14/2022 07:05:00 PM
Weekend:
• Schedule for Week of August 14, 2022
Monday:
• At 8:30 AM ET, The New York Fed Empire State manufacturing survey for August. The consensus is for a reading of 5.5, down from 11.1.
• At 10:00 AM, The August NAHB homebuilder survey. The consensus is for a reading of 55, unchanged from 55. Any number above 50 indicates that more builders view sales conditions as good than poor.
From CNBC: Pre-Market Data and Bloomberg futures S&P 500 are down 8 and DOW futures are down 62 (fair value).
Oil prices were up over the last week with WTI futures at $91.68 per barrel and Brent at $97.73 per barrel. A year ago, WTI was at $68, and Brent was at $71 - so WTI oil prices are up 35% year-over-year.
Here is a graph from Gasbuddy.com for nationwide gasoline prices. Nationally prices are at $3.91 per gallon. A year ago, prices were at $3.16 per gallon, so gasoline prices are up $0.75 per gallon year-over-year.
Summer Teen Employment
by Calculated Risk on 8/14/2022 10:57:00 AM
Here is a look at the change in teen employment over time.
The graph below shows the employment-population ratio for teens (6 to 19 years old) since 1948.
The graph is Not Seasonally Adjusted (NSA), to show the seasonal hiring of teenagers during the summer.
A few observations:
1) Although teen employment has recovered some since the great recession, overall teen employment had been trending down. This is probably because more people are staying in school (a long term positive for the economy).
2) Teen employment was significantly impacted in 2020 by the pandemic.
 Click on graph for larger image.
3) A smaller percentage of teenagers are obtaining summer employment. The seasonal spikes are smaller than in previous decades.
The teen employment-population ratio was 38.4% in July 2022, down from 38.9% in July 2021. The teen participation rate was 43.6% in July 2022, down from 43.8% the previous July.
So, a smaller percentage of teenagers are joining the labor force during the summer as compared to previous years. This could be because of fewer employment opportunities, or because teenagers are pursuing other activities during the summer.
3) The decline in teenager participation is one of the reasons the overall participation rate has declined (of course, the retiring baby boomers is the main reason the overall participation rate has declined over the last 20+ years).
3) The decline in teenager participation is one of the reasons the overall participation rate has declined (of course, the retiring baby boomers is the main reason the overall participation rate has declined over the last 20+ years).
Saturday, August 13, 2022
Real Estate Newsletter Articles this Week
by Calculated Risk on 8/13/2022 02:11:00 PM
At the Calculated Risk Real Estate Newsletter this week:
• Current State of the Housing Market
• Homebuyers Hit Brakes in July, Sellers Hold Back
• Realtor.com Reports Weekly Inventory Up 28% Year-over-year
• 1st Look at Local Housing Markets in July
• Housing Inventory Growth Has Slowed in Recent Weeks
This is usually published 4 to 6 times a week and provides more in-depth analysis of the housing market.
You can subscribe at https://calculatedrisk.substack.com/
Most content is available for free (and no Ads), but please subscribe!
Schedule for Week of August 14, 2022
by Calculated Risk on 8/13/2022 08:11:00 AM
The key reports this week are July Housing Starts, Existing Home Sales and Retail sales.
For manufacturing, the Industrial Production report will be released.
8:30 AM: The New York Fed Empire State manufacturing survey for August. The consensus is for a reading of 5.5, down from 11.1.
10:00 AM: The August NAHB homebuilder survey. The consensus is for a reading of 55, unchanged from 55. Any number above 50 indicates that more builders view sales conditions as good than poor.
 8:30 AM ET: Housing Starts for July.
 This graph shows single and multi-family housing starts since 1968.
The consensus is for 1.540 million SAAR, down from 1.559 million SAAR in June.
 9:15 AM: The Fed will release Industrial Production and Capacity Utilization for July.
This graph shows industrial production since 1967.
The consensus is for a 0.3% increase in Industrial Production, and for Capacity Utilization to increase to 80.1%.
7:00 AM ET: The Mortgage Bankers Association (MBA) will release the results for the mortgage purchase applications index.
 8:30 AM: Retail sales for July is scheduled to be released. The consensus is for 0.1% increase in retail sales.
This graph shows retail sales since 1992. This is monthly retail sales and food service, seasonally adjusted (total and ex-gasoline)
2:00 PM: FOMC Minutes, Meeting of July 26-27, 2022
8:30 AM: The initial weekly unemployment claims report will be released. The consensus is for 265 thousand up from 262 thousand last week.
8:30 AM: the Philly Fed manufacturing survey for August. The consensus is for a reading of -5.0, up from -12.3.
 10:00 AM: Existing Home Sales for July from the National Association of Realtors (NAR). The consensus is for 4.88 million SAAR, down from 5.12 million last month.
The graph shows existing home sales from 1994 through the report last month.
10:00 AM: State Employment and Unemployment (Monthly) for July 2022
Friday, August 12, 2022
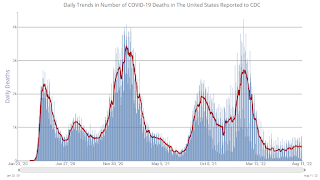
COVID August 12, 2022, Update on Cases, Hospitalizations and Deaths
by Calculated Risk on 8/12/2022 09:11:00 PM
On COVID (focus on hospitalizations and deaths):
Hospitalizations have almost quadrupled from the lows in April 2022.
 Click on graph for larger image.
This graph shows the daily (columns) and 7-day average (line) of deaths reported.
| COVID Metrics | ||||
|---|---|---|---|---|
| Now | Week Ago | Goal | ||
| New Cases per Day2 | 103,105 | 118,550 | ≤5,0001 | |
| Hospitalized2 | 36,063 | 37,539 | ≤3,0001 | |
| Deaths per Day2 | 413 | 439 | ≤501 | |
| 1my goals to stop daily posts, 27-day average for Cases, Currently Hospitalized, and Deaths 🚩 Increasing 7-day average week-over-week for Cases, Hospitalized, and Deaths ✅ Goal met. | ||||
 Click on graph for larger image.
This graph shows the daily (columns) and 7-day average (line) of deaths reported.
Average daily deaths bottomed in July 2021 at 214 per day.
Lawler: American Homes 4 Rent Slashing MLS Purchases of Single Family Homes
by Calculated Risk on 8/12/2022 04:38:00 PM
From housing economist Tom Lawler: American Homes 4 Rent Slashing MLS Purchases of Single Family Homes
In American Homes 4 Rent (AMH) earnings conference call last week, officials said that the company was slashing its MLS-based purchases of single-family homes in the second half of 2022. Here are a few excerpts:
“Now, turning to our investment strategy more broadly. Interest rates have risen, while home prices have yet to react in a meaningful way. In addition, these are uncertain times in the capital markets.
As such, we have temporarily scaled back one-off MLS transactions to allow the market time to recalibrate and stabilize. This will preserve dry powder for future investment.”
Here is a response to a question of whether or not the company was “entirely out” of the MLS market or third-party homebuilder purchases.
“Yes. Thanks Brad. We're not 100% out. We're still acquiring, but it has had a very significant or very reduced level, probably more than 80% reduction from what we were seeing earlier this year. It is based on what the attractive opportunities are when you're underwriting many homes, and we're starting to see a growing list of opportunities on the MLS. The MLS has many more homes today available, the times that they're sitting there is much greater. We're starting to see opportunities.”
“With respect to other acquisition channels, it is a very interesting time. We are receiving many inbound telephone calls that we were not receiving previously, whether it's from owners of small portfolios or even national homebuilders with excess inventory. Where we are, though, in those -- in that process is we still have a gap in our bid to ask expectations between buyer and seller.”
The company noted that it has not lowered its projections for its “wholly owned development activities” (or its “build to rent”) program. AMH has been very aggressive in acquiring lots for its build to rent program, increasing the number of lots it owns or controls (and most owns) from 2,000 at the end of 2017 to 9,000 at the end of 2020, 18,000 at the end of 2021, and well over 20,000 at the end of this June.
You can read the transcript of the AMH earnings conference call here.
If you are interested in this topic, an article published today by Bloomberg (link shown below) is worth reading: Housing Slowdown Chills Investors Who Supercharged US Market
Realtor.com Reports Weekly Inventory Up 28% Year-over-year; Inventory growth is slowing
by Calculated Risk on 8/12/2022 11:29:00 AM
Today, in the Calculated Risk Real Estate Newsletter: Realtor.com Reports Weekly Inventory Up 28% Year-over-year
Excerpt:
As I noted earlier, Inventory will Tell the Tale about the housing market. And housing inventory is increasing, but the pace of growth has slowed in recent weeks.
As the housing market slows, we need to watch inventory very closely. This will give us a hint on what will happen with house prices.
...
Realtor.com has monthly and weekly data on the existing home market. Here is their weekly report released yesterday from Chief Economist Danielle Hale: Weekly Housing Trends View — Data Week Ending August 6, 2022.. Note: They have data on list prices, new listings and more, but this focus is on inventory.• Active inventory continued to grow, but the pace slipped to 28% above one year ago. The rate of improvement actually slipped this week as the number of new listings continues to come in lower. The big positive for today’s shoppers is that they have more homes to consider than last year’s shoppers did. Nevertheless, our July Housing Trends Report showed that the active listings count still trails its 2020 and 2019 levels by more than 15% and 45%, respectively. More improvement in active inventory is likely needed to bring balance, but the recent trend may be at-risk if homeowner attitudes toward selling now continue to deteriorate....Here is a graph of the year-over-year change in inventory according to realtor.com.

There is much more in the article. You can subscribe at https://calculatedrisk.substack.com/
Early Q3 GDP Forecasts
by Calculated Risk on 8/12/2022 10:09:00 AM
From BofA:
Looking ahead to next week, we will initiate our US GDP tracking for Q3 following the release of July retail sales. ... If our forecast for July retail sales prove accurate, it would suggest that household spending is off to a fast start in Q3 and pose upside risk to our forecast for another modest decline in real GDP in the quarter. [-0.5 percent Q3, perliminary estimate]From Goldman:
emphasis added
We left our Q3 GDP tracking estimate unchanged at +0.9% (qoq ar). [August 10 estimate]And from the Altanta Fed: GDPNow
The GDPNow model estimate for real GDP growth (seasonally adjusted annual rate) in the third quarter of 2022 is 2.5 percent on August 10, up from 1.4 percent on August 4. [August 10 estimate]
Second Home Market: South Lake Tahoe in July
by Calculated Risk on 8/12/2022 08:57:00 AM
With the pandemic, there was a surge in 2nd home buying.
I'm looking at data for some second home markets - and I'm tracking those markets to see if there is an impact from lending changes, rising mortgage rates or the easing of the pandemic.
This graph is for South Lake Tahoe since 2004 through July 2022, and shows inventory (blue), and the year-over-year (YoY) change in the median price (12-month average).
Note: The median price is distorted by the mix, but this is the available data.
 Click on graph for larger image.
Following the housing bubble, prices declined for several years in South Lake Tahoe, with the median price falling about 50% from the bubble peak.
Currently inventory is still very low, but up almost 6-fold from the record low set in February 2022, and up 44% year-over-year. Prices are up 9.9% YoY (but the YoY change has been trending down).


