 RSS Feed
 by Calculated Risk on 5/25/2022 07:00:00 AM
Wednesday, May 25, 2022
MBA: Mortgage Applications Decrease in Latest Weekly Survey
From the MBA: Mortgage Applications Decrease in Latest MBA Weekly Survey
Mortgage applications decreased 1.2 percent from one week earlier, according to data from the Mortgage Bankers Association’s (MBA) Weekly Mortgage Applications Survey for the week ending May 20, 2022.
... The Refinance Index decreased 4 percent from the previous week and was 75 percent lower than the same week one year ago. The seasonally adjusted Purchase Index increased 0.2 percent from one week earlier. The unadjusted Purchase Index decreased 1 percent compared with the previous week and was 16 percent lower than the same week one year ago.
“The 30-year fixed rate declined for the second straight week to 5.46 percent but remains well above what borrowers were used to over the past two years. Most refinance borrowers continue to remain on the sidelines as a result, and refinance applications have fallen in nine of the past 10 weeks. Compared to January 2022, refinance activity is down 66 percent,” said Joel Kan, MBA’s Associate Vice President of Economic and Industry Forecasting. “Higher mortgage rates are also impacting purchase market conditions, as the purchase index remained close to lows last seen in the spring of 2020 when a significant portion of activity was put on hold due to the onset of the pandemic. Currently, higher rates, low inventory, and high prices are keeping prospective buyers out of the market.”
The refinance share of mortgage activity decreased to 32.3 percent of total applications from 33.0 percent the previous week. The adjustable-rate mortgage (ARM) share of activity decreased to 9.4 percent of total applications.
...
The average contract interest rate for 30-year fixed-rate mortgages with conforming loan balances ($647,200 or less) decreased to 5.46 percent from 5.49 percent, with points decreasing to 0.60 from 0.74 (including the origination fee) for 80 percent loan-to-value ratio (LTV) loans.
emphasis added
 Click on graph for larger image.
The first graph shows the refinance index since 1990.
With higher mortgage rates, the refinance index has declined sharply over the last several months.
The refinance index is at the lowest level since December 2018.
The second graph shows the MBA mortgage purchase index
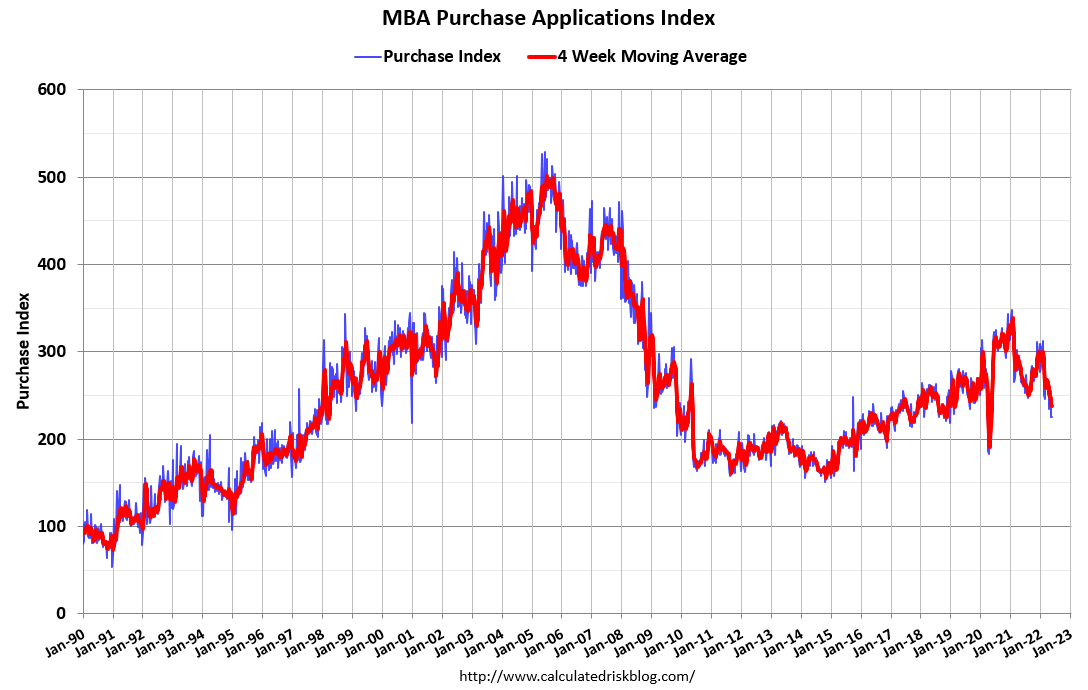 According to the MBA, purchase activity is down 16% year-over-year unadjusted.
Note: Red is a four-week average (blue is weekly).
Tuesday, May 24, 2022
Wednesday: Durable Goods, FOMC Minutes
by Calculated Risk on 5/24/2022 09:01:00 PM
Wednesday:
• At 7:00 AM ET, The Mortgage Bankers Association (MBA) will release the results for the mortgage purchase applications index.
• At 8:30 AM, Durable Goods Orders for April from the Census Bureau. The consensus is for a 0.6% increase in durable goods orders.
• At 2:00 PM, FOMC Minutes, Minutes Meeting of May 3-4, 2022
On COVID (focus on hospitalizations and deaths):
| COVID Metrics | ||||
|---|---|---|---|---|
| Now | Week Ago | Goal | ||
| Percent fully Vaccinated | 66.6% | --- | ≥70.0%1 | |
| Fully Vaccinated (millions) | 221.0 | --- | ≥2321 | |
| New Cases per Day3🚩 | 104,480 | 95,207 | ≤5,0002 | |
| Hospitalized3🚩 | 19,218 | 16,424 | ≤3,0002 | |
| Deaths per Day3 | 279 | 284 | ≤502 | |
| 1 Minimum to achieve "herd immunity" (estimated between 70% and 85%). 2my goals to stop daily posts, 37-day average for Cases, Currently Hospitalized, and Deaths 🚩 Increasing 7-day average week-over-week for Cases, Hospitalized, and Deaths ✅ Goal met. | ||||
 Click on graph for larger image.
This graph shows the daily (columns) and 7-day average (line) of deaths reported.
Average daily deaths bottomed in July 2021 at 214 per day.
FDIC: Problem Banks Declined, Residential REO Increased Slightly in Q1 2022
by Calculated Risk on 5/24/2022 02:09:00 PM
The FDIC released the Quarterly Banking Profile for Q1 2022 this morning:
Net income fell by $17.0 billion (22.2 percent) to $59.7 billion in first quarter 2022 from the year-ago quarter.
...
Total assets increased $253.9 billion (1.1 percent) from fourth quarter 2021 to $24.0 trillion. Cash and balances due from depository institutions declined $183.5 billion (5.2 percent) from fourth quarter 2021. Total loan and lease balances increased $109.9 billion (1.0 percent), federal funds sold increased 48.3 billion (8.1 percent), and securities rose $14.6 billion (0.2 percent). Growth in U.S. Treasury securities (up $37.9 billion, or 2.6 percent) continued to drive the quarterly increases in total securities. The proportion of securities to total assets declined slightly to 26.1 percent from the QBP high of 26.3 percent reported in fourth quarter 2021.
Loans and leases 90 days or more past due or in nonaccrual status (noncurrent loan balances) declined (down $4.5 billion, or 4.5 percent) from fourth quarter 2021, supporting a 5 basis point reduction in the noncurrent rate to 0.84 percent. The noncurrent rate was just 14 basis points above the historical low reported in second quarter 2006. Noncurrent 1–4 family residential real estate loan balances declined most among noncurrent loan categories (down $4.8 billion, or 10.5 percent).
emphasis added
 Click on graph for larger image.
The FDIC reported the number of problem banks declined to 40.
The number of FDIC-insured institutions declined from 4,839 in fourth quarter 2021 to 4,796. In first quarter, 3 banks opened and 44 institutions merged with other FDIC-insured institutions. The number of banks on the FDIC’s “Problem Bank List” declined by 4 from fourth quarter to 40, the lowest level since QBP data collection began in 1984. Total assets of problem banks increased $3.0 billion to $173.1 billion.11 No banks failed in the first quarter.This graph from the FDIC shows the number of problem banks and assets at problem institutions.
Note: The number of assets for problem banks increased significantly back in 2018 when Deutsche Bank Trust Company Americas was added to the list. An even larger bank was added to the list last year, although the identity of the bank is unclear.
 The dollar value of 1-4 family residential Real Estate Owned (REOs, foreclosure houses) increased slightly from $779 million in Q4 2021 to $788 million in Q1 2022.
 This graph shows the nominal dollar value of Residential REO for FDIC insured institutions. Note: The FDIC reports the dollar value and not the total number of REOs.
U.S. Births increased Slightly in 2021, First increase since 2014
by Calculated Risk on 5/24/2022 12:16:00 PM
From the National Center for Health Statistics: Births: Provisional Data for 2021. The NCHS reports:
The provisional number of births for the United States in 2021 was 3,659,289, up 1% from 2020 and the first increase in the number of births since 2014.Here is a long-term graph of annual U.S. births through 2021.
The general fertility rate was 56.6 births per 1,000 women aged 15–44, up 1% from 2020 and the first increase in the rate since 2014. The total fertility rate was 1,663.5 births per 1,000 women in 2021, up 1% from 2020. Birth rates declined for women in age groups 15–24, rose for women in age groups 25–49, and was unchanged for adolescents aged 10–14 in 2021. The birth rate for teenagers aged 15–19 declined by 6% in 2021 to 14.4 births per 1,000 females; rates declined for both younger (aged 15–17) and older (aged 18–19) teenagers.
emphasis added
 Click on graph for larger image.
Births had declined for six consecutive years following increases in 2013 and 2014.
Note the amazing decline in teenage births.
With fewer births, and less net migration, demographics are not as favorable as once expected.
There is much more in the report.
April New Home Sales Decline Sharply, almost 6 Months of Inventory Under Construction
by Calculated Risk on 5/24/2022 10:54:00 AM
Today, in the Calculated Risk Real Estate Newsletter: April New Home Sales Decline Sharply, almost 6 Months of Inventory Under Construction
Brief excerpt:
The next graph shows the months of supply by stage of construction. “Months of supply” is inventory at each stage, divided by the sales rate.You can subscribe at https://calculatedrisk.substack.com/.
The inventory of completed homes for sale was at 38 thousand in April, up from the record low of 32 thousand in several months in 2021 and early 2022. That is just over 0.8 months of completed supply (red line). This is lower than the normal level.
The inventory of new homes under construction is at 5.9 months (blue line) - well above the normal level. This elevated level of homes under construction is due to supply chain constraints. This is close to the record set in 1980.
And 118 thousand homes have not been started - about 2.4 months of supply (grey line) - almost double the normal level. Homebuilders are probably waiting to start some homes until they have a firmer grasp on prices and demand.

New Home Sales Decrease Sharply to 591,000 Annual Rate in April
by Calculated Risk on 5/24/2022 10:11:00 AM
The Census Bureau reports New Home Sales in April were at a seasonally adjusted annual rate (SAAR) of 591 thousand.
The previous three months were revised down.
Sales of new single‐family houses in April 2022 were at a seasonally adjusted annual rate of 591,000, according to estimates released jointly today by the U.S. Census Bureau and the Department of Housing and Urban Development. This is 16.6 percent below the revised March rate of 709,000 and is 26.9 percent below the April 2021 estimate of 809,000
emphasis added
 Click on graph for larger image.
The first graph shows New Home Sales vs. recessions since 1963. The dashed line is the current sales rate.
New home sales are now below pre-pandemic levels.
The second graph shows New Home Months of Supply.
 The months of supply increased in April to 9.0 months from 6.9 months in March.
 The all-time record high was 12.1 months of supply in January 2009. The all-time record low was 3.5 months, most recently in October 2020.
This is well above the top of the normal range (about 4 to 6 months of supply is normal).
"The seasonally‐adjusted estimate of new houses for sale at the end of April was 444,000. This represents a supply of 9.0 months at the current sales rate."
 The last graph shows sales NSA (monthly sales, not seasonally adjusted annual rate).
In April 2022 (red column), 53 thousand new homes were sold (NSA). Last year, 74 thousand homes were sold in April.
The all-time high for April was 116 thousand in 2005, and the all time low for April was 30 thousand in 2011.
This was well below expectations, and sales in the three previous months were revised down sharply. I'll have more later today.
Monday, May 23, 2022
Tuesday: New Home Sales, Richmond Fed Mfg
by Calculated Risk on 5/23/2022 08:45:00 PM
From Matthew Graham at Mortgage News Daily: Mortgage Rates Moving Up to Start New Week
Mortgage rates are coming off their best 2 weeks in quite some time--a feat that sounds more impressive than it is by the time we consider the precursors. Namely, the improvement in rates was heavily dependent on vastly bigger movement in the stock market. Stocks and rates don't always move in unison, but when stocks fall enough, it can indicate that investors are seeking safer havens for cash (i.e. moving away from risk). [30 year fixed 5.36%]Tuesday:
emphasis added
• At 10:00 AM ET, New Home Sales for April from the Census Bureau. The consensus is for 750 thousand SAAR, down from 763 thousand SAAR in March.
• Also at 10:00 AM: Richmond Fed Survey of Manufacturing Activity for May.
On COVID (focus on hospitalizations and deaths):
| COVID Metrics | ||||
|---|---|---|---|---|
| Now | Week Ago | Goal | ||
| Percent fully Vaccinated | 66.5% | --- | ≥70.0%1 | |
| Fully Vaccinated (millions) | 220.9 | --- | ≥2321 | |
| New Cases per Day3🚩 | 102,940 | 93,377 | ≤5,0002 | |
| Hospitalized3🚩 | 17,432 | 15,982 | ≤3,0002 | |
| Deaths per Day3🚩 | 281 | 276 | ≤502 | |
| 1 Minimum to achieve "herd immunity" (estimated between 70% and 85%). 2my goals to stop daily posts, 37-day average for Cases, Currently Hospitalized, and Deaths 🚩 Increasing 7-day average week-over-week for Cases, Hospitalized, and Deaths ✅ Goal met. | ||||
 Click on graph for larger image.
This graph shows the daily (columns) and 7-day average (line) of deaths reported.
Average daily deaths bottomed in July 2021 at 214 per day.
BofA: "High hurdles to rebalance the existing home market"
by Calculated Risk on 5/23/2022 02:46:00 PM
CR Note: This analysis is similar to many of my comments in What will Happen with House Prices?
A few excerpts from a BofA research note: High hurdles to rebalance the existing home market .
As the Fed now tries to slow the economy down, housing will be front and center as one of the main interest rate-sensitive sectors.Earlier this month I wrote:
As we have been writing, mortgage rates have spiked this year to around 5.5% creating a record affordability shock. This should lead to a major pullback in home sales and turnover. However, home prices will likely continue to move higher, and we recently revised up our home price appreciation forecast this year to 15%.
It is hard to understate how tight the housing market is right now. The key metric to gauge the supply-demand imbalance is existing homes months supply, which is at a historically low level of 2.2 months as of April. As we recently pointed out in Fed throwing shade on hot housing market, months supply has a strong historical inverse relationship with % mom home prices. The record tightness therefore helps explain the record gains in home prices.
Click on table for larger image.
Looking at the long history, a balanced market is likely closer to 5-7 months. To get from 2 months to 5 months would take some pretty big changes and swings in the existing home market. To assess this, we create a matrix for months supply with varying assumptions for weaker home sales and greater inventories. A combined 20% pullback in existing home sales and 20% increase in inventories, would add slightly over 1 month to months supply, bringing it up to 3.3 months. To get back to 5 months and the minimum threshold for a balanced market, it would take more severe moves in the range of 40% for both.
emphasis added

If sales decline to 5.0 million SAAR, inventory would have to increase to around 2.5 million units to reach 6 months-of-supply. This also might seem unlikely and would seem to argue for the slow house price growth scenario; however, I think there are reasons we might sales decline to around 5 million SAAR. We could see a wealth effect from the recent decline in the stock market and speculative assets. Also, my suspicion is household formation will slow (I think there was a sharp increase in household formation in 2021 that will slow later this year).I'll have more on household formation later this week.
Final Look at Local Housing Markets in April
by Calculated Risk on 5/23/2022 11:07:00 AM
Today, in the Calculated Risk Real Estate Newsletter: Final Look at Local Housing Markets in April
A brief excerpt:
And a table of April sales. Sales in these areas were down 9.5% YoY, Not Seasonally Adjusted (NSA). The NAR reported sales NSA in April (464,000) were 9.6% below sales in April 2021 (513,000). So, this sample of local markets is similar to the NAR report.There is much more in the article. You can subscribe at https://calculatedrisk.substack.com/
The table doesn’t include California where sales were down 8.5% year-over-year.
Notes for all tables:
1) New additions to table in BOLD.
2) Northwest (Seattle), North Texas (Dallas) and Santa Clara (San Jose), Mid-Florida (Tampa, Orlando), Jacksonville, Source: Northeast Florida Association of REALTORS®
3) Totals do not include Denver, Atlanta on Minneapolis (included in state totals).
I expect we will see further increases in inventory - and further decline in sales - in May due to higher mortgage rates (more than the usual seasonal increase in inventory).

Housing Inventory May 23rd Update: Inventory UP 8.2% Week-over-week
by Calculated Risk on 5/23/2022 09:19:00 AM
Altos reports inventory is up year-over-year!
Inventory usually declines in the winter, and then increases in the spring. Inventory bottomed seasonally at the beginning of March 2022 and is now up 43% since then.
 Click on graph for larger image in graph gallery.
This inventory graph is courtesy of Altos Research.
As of May 20th, inventory was at 344 thousand (7-day average), compared to 318 thousand the prior week. Inventory was up 8.2% from the previous week.
Inventory is still very low. Compared to the same week in 2021, inventory is up 6.4% from 324 thousand, however compared to the same week in 2020, and inventory is down 52.5% from 724 thousand. Compared to 3 years ago, inventory is down 63.3% from 938 thousand.
Inventory is still very low. Compared to the same week in 2021, inventory is up 6.4% from 324 thousand, however compared to the same week in 2020, and inventory is down 52.5% from 724 thousand. Compared to 3 years ago, inventory is down 63.3% from 938 thousand.
Here are the inventory milestones I’m watching for with the Altos data:
1. The seasonal bottom (happened on March 4th for Altos) ✅
2. Inventory up year-over-year (happened on May 13th for Altos) ✅
3. Inventory up compared to two years ago (currently down 52.5% according to Altos)
4. Inventory up compared to 2019 (currently down 63.3%).
1. The seasonal bottom (happened on March 4th for Altos) ✅
2. Inventory up year-over-year (happened on May 13th for Altos) ✅
3. Inventory up compared to two years ago (currently down 52.5% according to Altos)
4. Inventory up compared to 2019 (currently down 63.3%).

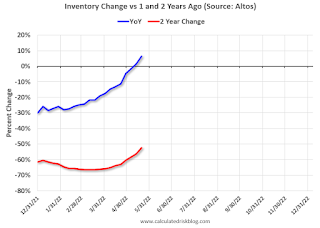
Here is a graph of the inventory change year-over-year and vs two years ago (milestone 3 above).
The blue line is the year-over-year data, and the red line is compared to two years ago.
Inventory is now up year-over-year. Two years ago (in 2020) inventory was declining all year, so the two-year comparison will get easier all year.
Mike Simonsen discusses this data regularly on Youtube.


