 RSS Feed
 by Calculated Risk on 5/18/2022 12:35:00 PM
Wednesday, May 18, 2022
AIA: "Architecture Billings Index moderates slightly, remains strong" in April
Note: This index is a leading indicator primarily for new Commercial Real Estate (CRE) investment.
From the AIA: Architecture Billings Index moderates slightly, remains strong
For the fifteenth consecutive month architecture firms reported increasing demand for design services in April, according to a new report today from The American Institute of Architects (AIA)
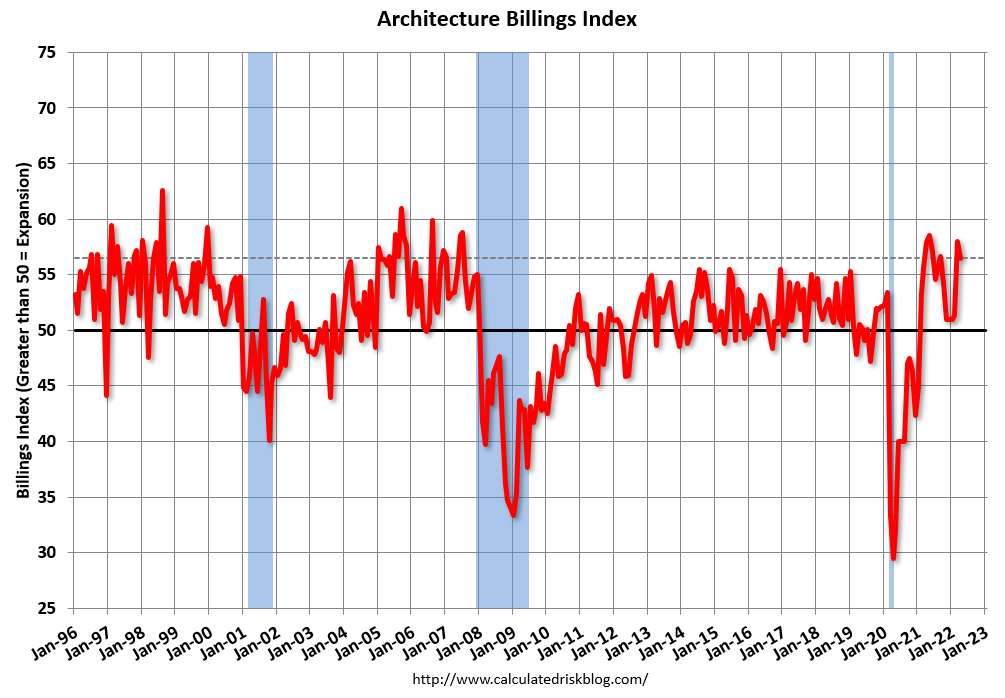
AIA’s Architecture Billings Index score for April was 56.5 compared to 58.0 in March. Any score above 50 indicates an increase in billings. During April, scores for both new project inquiries and design contracts moderated slightly, but remained strong, posting scores of 62.3 and 55.4, respectively.
“While business conditions at architecture firms have been very encouraging over the past year, project activity has been steadily shifting toward work on existing buildings,” said AIA Chief Economist, Kermit Baker, Hon. AIA, PhD. “Billings for reconstruction projects exceeded those for new construction for the first time in the last two decades. While the reconstruction share of building activity will continue to ebb and flow, in general, we’ll continue to move toward an increased share of building activity for reconstruction and a decreased share for new construction.”
...
• Regional averages: West (58.2); Midwest (57.6); South (57.3); Northeast (53.1)
• Sector index breakdown: mixed practice (61.2); commercial/industrial (60.7); multi-family residential (57.2); institutional (51.8)
emphasis added
 Click on graph for larger image.
This graph shows the Architecture Billings Index since 1996. The index was at 56.5 in April, down from 58.0 in March. Anything above 50 indicates expansion in demand for architects' services.
Note: This includes commercial and industrial facilities like hotels and office buildings, multi-family residential, as well as schools, hospitals and other institutions.
This index has been positive for fifteen consecutive months. This index usually leads CRE investment by 9 to 12 months, so this index suggests a pickup in CRE investment in 2022.
April Housing Starts: All-Time Record Housing Units Under Construction
by Calculated Risk on 5/18/2022 09:09:00 AM
Today, in the CalculatedRisk Real Estate Newsletter: April Housing Starts: All-Time Record Housing Units Under Construction
Excerpt:
The fourth graph shows housing starts under construction, Seasonally Adjusted (SA).There is much more in the post. You can subscribe at https://calculatedrisk.substack.com/ (Most content is available for free, so please subscribe).
Red is single family units. Currently there are 815 thousand single family units under construction (SA). This is the highest level since November 2006.
For single family, many of these homes are already sold (Census counts sales when contract is signed). The reason there are so many homes is probably due to construction delays. Since many of these are already sold, it is unlikely this is “overbuilding”, or that this will significantly impact prices (although the buyers will be moving out of their current home or apartment once these homes are completed).
Blue is for 2+ units. Currently there are 826 thousand multi-family units under construction. This is the highest level since May 1974! For multi-family, construction delays are probably also a factor. The completion of these units should help with rent pressure.
Combined, there are a record 1.641 million units under construction. This eclipses the previous record of 1.628 million units that were under construction (mostly apartments in 1973 for the baby boom generation).

Housing Starts Decreased to 1.724 million Annual Rate in April
by Calculated Risk on 5/18/2022 08:39:00 AM
From the Census Bureau: Permits, Starts and Completions
Housing Starts:
Privately‐owned housing starts in April were at a seasonally adjusted annual rate of 1,724,000. This is 0.2 percent below the revised March estimate of 1,728,000, but is 14.6 percent above the April 2021 rate of 1,505,000. Single‐family housing starts in April were at a rate of 1,100,000; this is 7.3 percent below the revised March figure of 1,187,000. The April rate for units in buildings with five units or more was 612,000.
Building Permits:
Privately‐owned housing units authorized by building permits in April were at a seasonally adjusted annual rate of 1,819,000. This is 3.2 percent below the revised March rate of 1,879,000, but is 3.1 percent above the April 2021 rate of 1,765,000. Single‐ family authorizations in April were at a rate of 1,110,000; this is 4.6 percent below the revised March figure of 1,163,000. Authorizations of units in buildings with five units or more were at a rate of 656,000 in April.
emphasis added
 Click on graph for larger image.
The first graph shows single and multi-family housing starts for the last several years.
Multi-family starts (blue, 2+ units) increased in April compared to March. Multi-family starts were up 40.5% year-over-year in April.
Single-family starts (red) decreased in April and were up 3.7% year-over-year.
 The second graph shows single and multi-family housing starts since 1968.
 This shows the huge collapse following the housing bubble, and then the eventual recovery (but still not historically high).
Total housing starts in April were below expectations, and starts in February and March, were revised down, combined.
I'll have more later …
MBA: Mortgage Applications Decrease in Latest Weekly Survey
by Calculated Risk on 5/18/2022 07:00:00 AM
From the MBA: Mortgage Applications Decrease in Latest MBA Weekly Survey
Mortgage applications decreased 11.0 percent from one week earlier, according to data from the Mortgage Bankers Association’s (MBA) Weekly Mortgage Applications Survey for the week ending May 13, 2022.
... The Refinance Index decreased 10 percent from the previous week and was 76 percent lower than the same week one year ago. The seasonally adjusted Purchase Index decreased 12 percent from one week earlier. The unadjusted Purchase Index decreased 12 percent compared with the previous week and was 15 percent lower than the same week one year ago.
“Mortgage applications decreased for the first time in three weeks, as mortgage rates – despite declining last week – remained over two percentage points higher than a year ago and close to the highest levels since 2009. For borrowers looking to refinance, the current level of rates continues to be a significant disincentive,” said Joel Kan, MBA’s Associate Vice President of Economic and Industry Forecasting. “Purchase applications fell 12 percent last week, as prospective homebuyers have been put off by the higher rates and worsening affordability conditions. Furthermore, general uncertainty about the near-term economic outlook, as well as recent stock market volatility, may be causing some households to delay their home search.”
Added Kan, “These results were consistent with MBA’s May forecast released earlier this week, which now calls for fewer home sales and mortgage originations in 2022 compared to a year ago.”
...
The average contract interest rate for 30-year fixed-rate mortgages with conforming loan balances ($647,200 or less) decreased to 5.49 percent from 5.53 percent, with points increasing to 0.74 from 0.73 (including the origination fee) for 80 percent loan-to-value ratio (LTV) loans. The effective rate decreased from last week.
emphasis added
 Click on graph for larger image.
The first graph shows the refinance index since 1990.
With higher mortgage rates, the refinance index has declined sharply over the last several months.
The refinance index is at the lowest level since December 2018.
The second graph shows the MBA mortgage purchase index
 According to the MBA, purchase activity is down 15% year-over-year unadjusted.
Note: Red is a four-week average (blue is weekly).
Tuesday, May 17, 2022
Wednesday: Housing Starts
by Calculated Risk on 5/17/2022 09:01:00 PM
Wednesday:
• At 7:00 AM ET, The Mortgage Bankers Association (MBA) will release the results for the mortgage purchase applications index.
• At 8:30 AM, Housing Starts for April. The consensus is for 1.773 million SAAR, down from 1.793 million SAAR in March.
• During the day, The AIA's Architecture Billings Index for April (a leading indicator for commercial real estate).
On COVID (focus on hospitalizations and deaths):
| COVID Metrics | ||||
|---|---|---|---|---|
| Now | Week Ago | Goal | ||
| Percent fully Vaccinated | 66.5% | --- | ≥70.0%1 | |
| Fully Vaccinated (millions) | 220.7 | --- | ≥2321 | |
| New Cases per Day3🚩 | 94,199 | 74,889 | ≤5,0002 | |
| Hospitalized3🚩 | 15,977 | 13,990 | ≤3,0002 | |
| Deaths per Day3 | 274 | 307 | ≤502 | |
| 1 Minimum to achieve "herd immunity" (estimated between 70% and 85%). 2my goals to stop daily posts, 37-day average for Cases, Currently Hospitalized, and Deaths 🚩 Increasing 7-day average week-over-week for Cases, Hospitalized, and Deaths ✅ Goal met. | ||||
 Click on graph for larger image.
This graph shows the daily (columns) and 7-day average (line) of deaths reported.
Average daily deaths bottomed in July 2021 at 214 per day.
3rd Look at Local Housing Markets; California Inventory up More Than 20% Year-over-year
by Calculated Risk on 5/17/2022 04:28:00 PM
Today, in the Calculated Risk Real Estate Newsletter: 3rd Look at Local Housing Markets
A brief excerpt:
California doesn’t report monthly sales or inventory, but here is the press release from the California Association of Realtors® (C.A.R.): Rising interest rates and climbing home prices moderate California home sales in April as statewide median price sets another peak, C.A.R. reportsThere is much more in the article. You can subscribe at https://calculatedrisk.substack.com/The number of active listings surged more than 20 percent on a year-over-year basis and recorded the highest yearly growth in properties for sale since January 2019. Active listings in April climbed to the highest level in seven monthsAdding Austin, Boston, California, Colorado, Des Moines, Maryland, Minneapolis, Minnesota, Sacramento, South Carolina and Washington, D.C.
...
Here is a summary of active listings for these housing markets in April. Note: Inventory usually increases seasonally in April, so some month-over-month (MoM) increase is not surprising.
Inventory was up 18.0% in April MoM from March, and down 3.2% year-over-year (YoY). Eleven of these 25 markets were up YoY.
Active inventory in these markets were down 23.5% YoY in February, and down 11.9% YoY in March, so this is a significant change from February and March. This is another step towards a more balanced market, but inventory levels are still very low.
Notes for all tables:
1) New additions to table in BOLD.
2) Northwest (Seattle), North Texas (Dallas) and Santa Clara (San Jose), Mid-Florida (Tampa, Orlando), Jacksonville, Source: Northeast Florida Association of REALTORS®
3) Totals do not include Denver, Atlanta on Minneapolis (included in state totals).

LA Port Traffic: Imports Steady in April
by Calculated Risk on 5/17/2022 02:38:00 PM
Notes: The expansion to the Panama Canal was completed in 2016 (As I noted a few years ago), and some of the traffic that used the ports of Los Angeles and Long Beach is probably going through the canal. This might be impacting TEUs on the West Coast.
Container traffic gives us an idea about the volume of goods being exported and imported - and usually some hints about the trade report since LA area ports handle about 40% of the nation's container port traffic.
The following graphs are for inbound and outbound traffic at the ports of Los Angeles and Long Beach in TEUs (TEUs: 20-foot equivalent units or 20-foot-long cargo container).
To remove the strong seasonal component for inbound traffic, the first graph shows the rolling 12-month average.
 Click on graph for larger image.
On a rolling 12-month basis, inbound traffic was unchanged in April compared to the rolling 12 months ending in March. Outbound traffic was down 0.7% compared to the rolling 12 months ending the previous month.
The 2nd graph is the monthly data (with a strong seasonal pattern for imports).
 Usually imports peak in the July to October period as retailers import goods for the Christmas holiday, and then decline sharply and bottom in February or March depending on the timing of the Chinese New Year.
Imports were unchanged YoY in April, and exports were down 7% YoY.
This tied last year for record inbound traffic for the month of April. There is no impact - yet - on inbound traffic due to the shutdown in China.
NAHB: Builder Confidence Decreased to 69 in May, "Housing market is now slowing"
by Calculated Risk on 5/17/2022 10:14:00 AM
The National Association of Home Builders (NAHB) reported the housing market index (HMI) was at 69, down from 77 in April. Any number above 50 indicates that more builders view sales conditions as good than poor.
From the NAHB: Builder Confidence Plunges on Rising Interest Rates, Growing Affordability Woes
In a sign that the housing market is now slowing, builder confidence took a steep drop in May as growing affordability challenges in the form of rapidly rising interest rates, double-digit price increases for material costs and ongoing home price appreciation are taking a toll on buyer demand.
Builder confidence in the market for newly built single-family homes fell eight points to 69 in May, according to the National Association of Home Builders (NAHB)/Wells Fargo Housing Market Index (HMI). This is the fifth straight month that builder sentiment has declined and the lowest reading since June 2020.
Housing is the business cycle, and the sector is particularly sensitive to changes for interest rates. And the housing market is facing growing challenges. Building material costs are up 19% from a year ago, in less than three months mortgage rates have surged to a 12-year high and based on current affordability conditions, less than 50% of new and existing home sales are affordable for a typical family. Entry-level and first-time home buyers are especially bearing the brunt of this rapid rise in mortgage rates.
...
All three HMI indices posted major losses in May. The HMI index gauging current sales conditions fell eight points to 78, the gauge measuring sales expectations in the next six months dropped 10 points to 63 and the component charting traffic of prospective buyers posted a nine-point decline to 52.
Looking at the three-month moving averages for regional HMI scores, the Northeast held steady at 72 while the Midwest dropped seven points to 62, the South fell two points to 80 and the West posted a six-point decline to 83.
emphasis added
 Click on graph for larger image.
This graph shows the NAHB index since Jan 1985.
This was well below the consensus forecast, but still historically a decent reading.
Industrial Production Increased 1.1 Percent in April
by Calculated Risk on 5/17/2022 09:20:00 AM
From the Fed: Industrial Production and Capacity Utilization
In April, total industrial production increased 1.1 percent—the fourth consecutive month of gains of 0.8 percent or greater—and manufacturing output rose 0.8 percent. The index for utilities moved up 2.4 percent, and the index for mining advanced 1.6 percent. At 105.6 percent of its 2017 average, total industrial production in April was 6.4 percent above its year-earlier level. Capacity utilization climbed to 79.0 percent, a rate that is 0.5 percentage point below its long-run (1972–2021) average.
emphasis added
 Click on graph for larger image.
This graph shows Capacity Utilization. This series is up from the record low set in April 2020, and above the level in February 2020 (pre-pandemic).
Capacity utilization at 79.0% is 0.5% below the average from 1972 to 2020. This was well above consensus expectations.
Note: y-axis doesn't start at zero to better show the change.
 The second graph shows industrial production since 1967.
Industrial production increased in April to 105.6. This is above the February 2020 level.
The change in industrial production was well above consensus expectations.
Retail Sales Increased 0.9% in April
by Calculated Risk on 5/17/2022 08:39:00 AM
On a monthly basis, retail sales were increased 0.9% from March to April (seasonally adjusted), and sales were up 8.2 percent from April 2021.
From the Census Bureau report:
Advance estimates of U.S. retail and food services sales for April 2022, adjusted for seasonal variation and holiday and trading-day differences, but not for price changes, were $677.7 billion, an increase of 0.9 percent from the previous month, and 8.2 percent above April 2021. ...The February 2022 to March 2022 percent change was revised from up 0.7 percent to up 1.4 percent.
emphasis added
 Click on graph for larger image.
This graph shows retail sales since 1992. This is monthly retail sales and food service, seasonally adjusted (total and ex-gasoline).
Retail sales ex-gasoline were up 1.3% in April.
The second graph shows the year-over-year change in retail sales and food service (ex-gasoline) since 1993.
Retail and Food service sales, ex-gasoline, increased by 5.9% on a YoY basis.
 Sales growth in April were above expectations, and sales in February and March were revised up, combined.


