 RSS Feed
 by Calculated Risk on 4/01/2022 03:02:00 PM
Friday, April 01, 2022
It is the Change in Monthly Payment that Matters
Today, in the Calculated Risk Real Estate Newsletter: It is the Change in Monthly Payment that Matters
Excerpt:
Yesterday I pointed that we shouldn’t compare the current situation to the housing bubble and bust, but instead we should look to the 1978 to 1982 period for lessons.
See: Housing: Don't Compare the Current Housing Boom to the Bubble and Bust
In that post, I argued it wasn’t the level of mortgage rates that impacted housing, but the change in rates (this was a shortcut).
More precisely, it is the change in monthly payments that impacts housing. Monthly payments include principal, interest, taxes, insurance (PITI), and sometimes HOA fees (Homeowners Association). We could also include maintenance, utilities and other costs.
The following graph shows the year-over-year change in principal & interest (P&I) assuming a fixed loan amount since 1977. Currently P&I is up about 21% year-over-year for a fixed amount (this doesn’t take into account the change in house prices).
So, this is less of an increase than in 1979.

There is much more in the article. You can subscribe at https://calculatedrisk.substack.com/
Construction Spending Increased 0.5% in February
by Calculated Risk on 4/01/2022 11:25:00 AM
From the Census Bureau reported that overall construction spending increased 1.3%:
Construction spending during February 2022 was estimated at a seasonally adjusted annual rate of $1,704.4 billion, 0.5 percent above the revised January estimate of $1,695.5 billion. The February figure is 11.2 percent above the February 2021 estimate of $1,533.3 billion.Private spending increased and public spending decreased:
emphasis added
Spending on private construction was at a seasonally adjusted annual rate of $1,353.7 billion, 0.8 percent above the revised January estimate of $1,343.4 billion. ...
In February, the estimated seasonally adjusted annual rate of public construction spending was $350.7 billion, 0.4 percent below the revised January estimate of $352.2 billion.
 Click on graph for larger image.
This graph shows private residential and nonresidential construction spending, and public spending, since 1993. Note: nominal dollars, not inflation adjusted.
Residential (red) spending is 25% above the bubble peak (in nominal terms - not adjusted for inflation).
Non-residential (blue) spending is 21% above the bubble era peak in January 2008 (nominal dollars).
Public construction spending is 8% above the peak in March 2009.
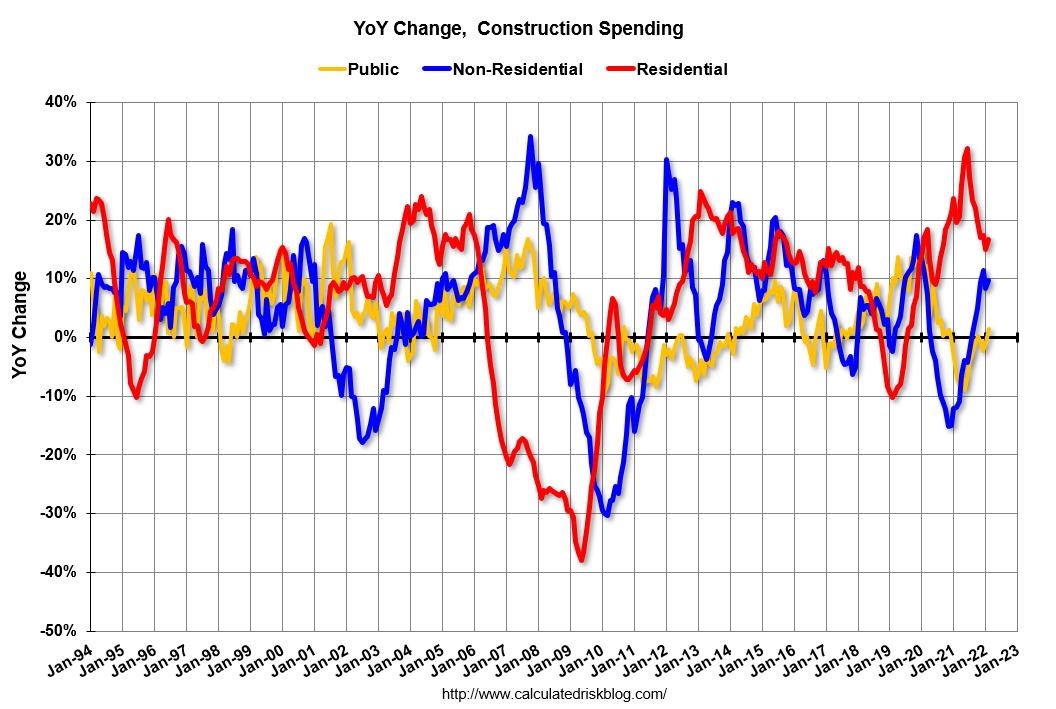 The second graph shows the year-over-year change in construction spending.
On a year-over-year basis, private residential construction spending is up 16.6%. Non-residential spending is up 9.7% year-over-year. Public spending is up 1.4% year-over-year.
This was below consensus expectations of a 0.9% increase in spending; however, construction spending for the previous two months was revised up.
Q1 GDP Forecasts: Barely Positive
by Calculated Risk on 4/01/2022 11:11:00 AM
From BofA:
Our 1Q GDP tracking estimate fell by 0.6ppt to 0.4% qoq SAAR as real personal spending was weaker than we expected. [April 1 estimate]From Goldman:
emphasis added
Following today’s data,we left our Q1 GDP tracking estimate unchanged at +0.5% (qoq ar). [March 31 estimate]And from the Altanta Fed: GDPNow
The GDPNow model estimate for real GDP growth (seasonally adjusted annual rate) in the first quarter of 2022 is 1.3 percent on March 31, up from 0.9 percent on March 24. [March 31 estimate]
Comments on March Employment Report
by Calculated Risk on 4/01/2022 09:18:00 AM
This was another solid report.
The headline jobs number in the March employment report was slightly below expectations, however employment for the previous two months was revised up by 95,000. The participation rate and the employment-population ratio both increased, and the unemployment rate decreased to 3.6%.
Leisure and hospitality gained 112 thousand jobs in March. At the beginning of the pandemic, in March and April of 2020, leisure and hospitality lost 8.20 million jobs, and are now down 1.47 million jobs since February 2020. So, leisure and hospitality has now added back about 82% all of the jobs lost in March and April 2020.
Construction employment increased 19 thousand and is now 4 thousand above the pre-pandemic level.
Manufacturing added 38 thousand jobs and is still 118 thousand below the pre-pandemic level.
Earlier: March Employment Report: 431 thousand Jobs, 3.6% Unemployment Rate
In March, the year-over-year employment change was 6.5 million jobs.
Permanent Job Losers
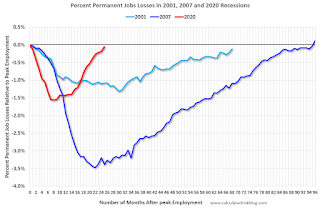 Click on graph for larger image.
This graph shows permanent job losers as a percent of the pre-recession peak in employment through the report today.
In March, the year-over-year employment change was 6.5 million jobs.
Permanent Job Losers
 Click on graph for larger image.
This graph shows permanent job losers as a percent of the pre-recession peak in employment through the report today.
This data is only available back to 1994, so there is only data for three recessions.
In March, the number of permanent job losers decreased to 1.392 million from 1.583 million in the previous month.
In March, the number of permanent job losers decreased to 1.392 million from 1.583 million in the previous month.
These jobs will likely be the hardest to recover, so it is a positive that the number of permanent job losers is almost back to pre-recession levels.
Prime (25 to 54 Years Old) Participation
 Since the overall participation rate has declined due to cyclical (recession) and demographic (aging population, younger people staying in school) reasons, here is the employment-population ratio for the key working age group: 25 to 54 years old.
The 25 to 54 participation rate increased in March to 82.5% from 82.2% in February, and the 25 to 54 employment population ratio increased to 80.0% from 79.5% the previous month.
Both are slightly below the pre-pandemic levels and indicate almost all of the prime age workers have returned to the labor force.
Part Time for Economic Reasons
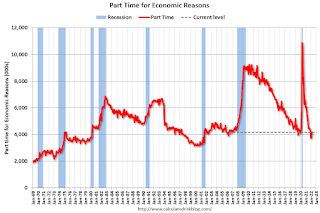 From the BLS report:
These workers are included in the alternate measure of labor underutilization (U-6) that decreased to 6.9% from 7.2% in the previous month. This is down from the record high in April 22.9% for this measure since 1994. This measure is below the 7.0% in February 2020 (pre-pandemic).
Unemployed over 26 Weeks
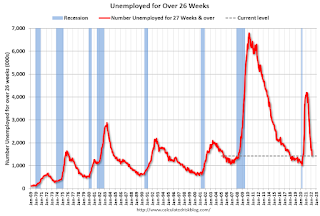 This graph shows the number of workers unemployed for 27 weeks or more.
According to the BLS, there are 1.702 million workers who have been unemployed for more than 26 weeks and still want a job, up from 1.691 million the previous month.
This does not include all the people that left the labor force.
Summary:
The headline monthly jobs number was slightly below expectations; however, the previous two months were revised up by 95,000 combined.
Part Time for Economic Reasons
 From the BLS report:
"The number of persons employed part time for economic reasons was about unchanged at 4.2 million in March and is little different from its February 2020 level. These individuals, who would have preferred full-time employment, were working part time because their hours had been reduced or they were unable to find full-time jobs."The number of persons working part time for economic reasons increased in March to 4.170 million from 4.135 million in February. This is at pre-recession levels.
These workers are included in the alternate measure of labor underutilization (U-6) that decreased to 6.9% from 7.2% in the previous month. This is down from the record high in April 22.9% for this measure since 1994. This measure is below the 7.0% in February 2020 (pre-pandemic).
Unemployed over 26 Weeks
 This graph shows the number of workers unemployed for 27 weeks or more.
 According to the BLS, there are 1.702 million workers who have been unemployed for more than 26 weeks and still want a job, up from 1.691 million the previous month.
This does not include all the people that left the labor force.
Summary:
The headline monthly jobs number was slightly below expectations; however, the previous two months were revised up by 95,000 combined.
The headline unemployment rate decreased to 3.6%. The household survey indicated a strong gain in employment of 736 thousand, pushing up the participation rate and employment-population ratio, and pushing down the unemployment rate to 3.6%, and U-6 to below pre-recession levels.
Both the prime age participation rate and employment-population ratio increased, and are now close to pre-pandemic levels, indicating almost all of the prime age workers have returned to the labor force.
There are still 1.6 million fewer jobs than prior to the recession.
Overall, this was another solid report.
March Employment Report: 431 thousand Jobs, 3.6% Unemployment Rate
by Calculated Risk on 4/01/2022 08:44:00 AM
From the BLS:
Total nonfarm payroll employment rose by 431,000 in March, and the unemployment rate declined to 3.6 percent, the U.S. Bureau of Labor Statistics reported today. Notable job gains continued in leisure and hospitality, professional and business services, retail trade, and manufacturing.
The change in total nonfarm payroll employment for January was revised up by 23,000, from +481,000 to +504,000, and the change for February was revised up by 72,000, from +678,000 to +750,000. With these revisions, employment in January and February combined is 95,000 higher than previously reported.
emphasis added
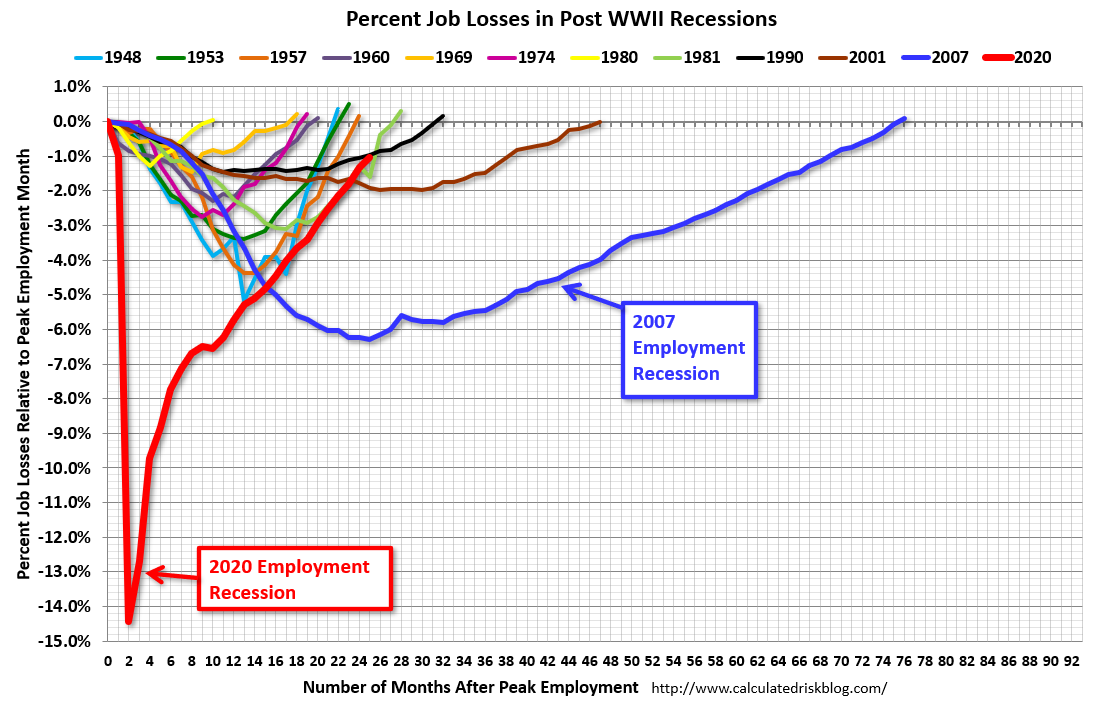 Click on graph for larger image.
The first graph shows the job losses from the start of the employment recession, in percentage terms.
The current employment recession was by far the worst recession since WWII in percentage terms.
However, 25 months after the onset of the current employment recession, almost all of the jobs have returned.
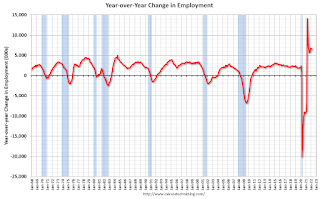 The second graph shows the year-over-year change in total non-farm employment since 1968.
In March, the year-over-year change was 6.5 million jobs. This was up significantly year-over-year.
Total payrolls increased by 431 thousand in March. Private payrolls increased by 426 thousand, and public payrolls increased 5 thousand.
Payrolls for January and February were revised up 95 thousand, combined.
The third graph shows the employment population ratio and the participation rate.
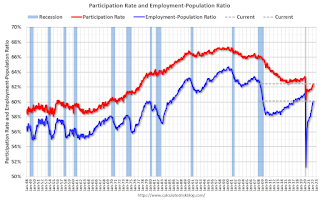 The Labor Force Participation Rate increased to 62.4% in March, from 62.3% in February. This is the percentage of the working age population in the labor force.
The Employment-Population ratio increased to 60.1% from 59.9% (blue line).
I'll post the 25 to 54 age group employment-population ratio graph later.
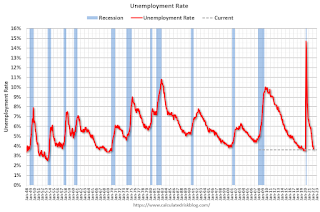 The fourth graph shows the unemployment rate.
The unemployment rate decreased in March to 3.6% from 3.8% in February.
This was slightly below consensus expectations; however, January and February payrolls were revised up by 95,000 combined.
 The second graph shows the year-over-year change in total non-farm employment since 1968.
In March, the year-over-year change was 6.5 million jobs. This was up significantly year-over-year.
Total payrolls increased by 431 thousand in March. Private payrolls increased by 426 thousand, and public payrolls increased 5 thousand.
Payrolls for January and February were revised up 95 thousand, combined.
The third graph shows the employment population ratio and the participation rate.
 The Labor Force Participation Rate increased to 62.4% in March, from 62.3% in February. This is the percentage of the working age population in the labor force.
 The Employment-Population ratio increased to 60.1% from 59.9% (blue line).
I'll post the 25 to 54 age group employment-population ratio graph later.
 The fourth graph shows the unemployment rate.
 The unemployment rate decreased in March to 3.6% from 3.8% in February.
This was slightly below consensus expectations; however, January and February payrolls were revised up by 95,000 combined.
I'll have more later ...
Thursday, March 31, 2022
Friday: Employment Report, ISM Mfg, Construction Spending, Vehicle Sales
by Calculated Risk on 3/31/2022 09:07:00 PM
My March Employment Preview
A few brief excerpts from a note by Goldman Sachs economist Spencer Hill:
We estimate nonfarm payrolls rose by 575k in March (mom sa) ... we believe fierce competition for workers incentivized firms to pull forward recruiting activities earlier in the spring hiring season. We also note that short-term unemployment only partially reversed its Omicron spike with the February report, implying scope for additional rehiring in March. ... We estimate a one-tenth drop in the unemployment rate to 3.7%Friday:
emphasis added
• At 8:30 AM ET, Employment Report for March. The consensus is for 475,000 jobs added, and for the unemployment rate to decrease to 3.7%.
• At 10:00 AM, ISM Manufacturing Index for March. The consensus is for the ISM to be at 58.6, unchanged from 58.6 in February.
• At 10:00 AM, Construction Spending for February. The consensus is for a 0.9% increase in construction spending.
• All Day, Light vehicle sales for March. The consensus is for light vehicle sales to be 14.1 million SAAR in March, unchanged from 14.1 million in February (Seasonally Adjusted Annual Rate).
On COVID (focus on hospitalizations and deaths):
| COVID Metrics | ||||
|---|---|---|---|---|
| Now | Week Ago | Goal | ||
| Percent fully Vaccinated | 65.6% | --- | ≥70.0%1 | |
| Fully Vaccinated (millions) | 217.6 | --- | ≥2321 | |
| New Cases per Day3 | 25,732 | 26,518 | ≤5,0002 | |
| Hospitalized3 | 12,243 | 15,482 | ≤3,0002 | |
| Deaths per Day3 | 626 | 732 | ≤502 | |
| 1 Minimum to achieve "herd immunity" (estimated between 70% and 85%). 2my goals to stop daily posts, 37-day average for Cases, Currently Hospitalized, and Deaths 🚩 Increasing 7-day average week-over-week for Cases, Hospitalized, and Deaths ✅ Goal met. | ||||
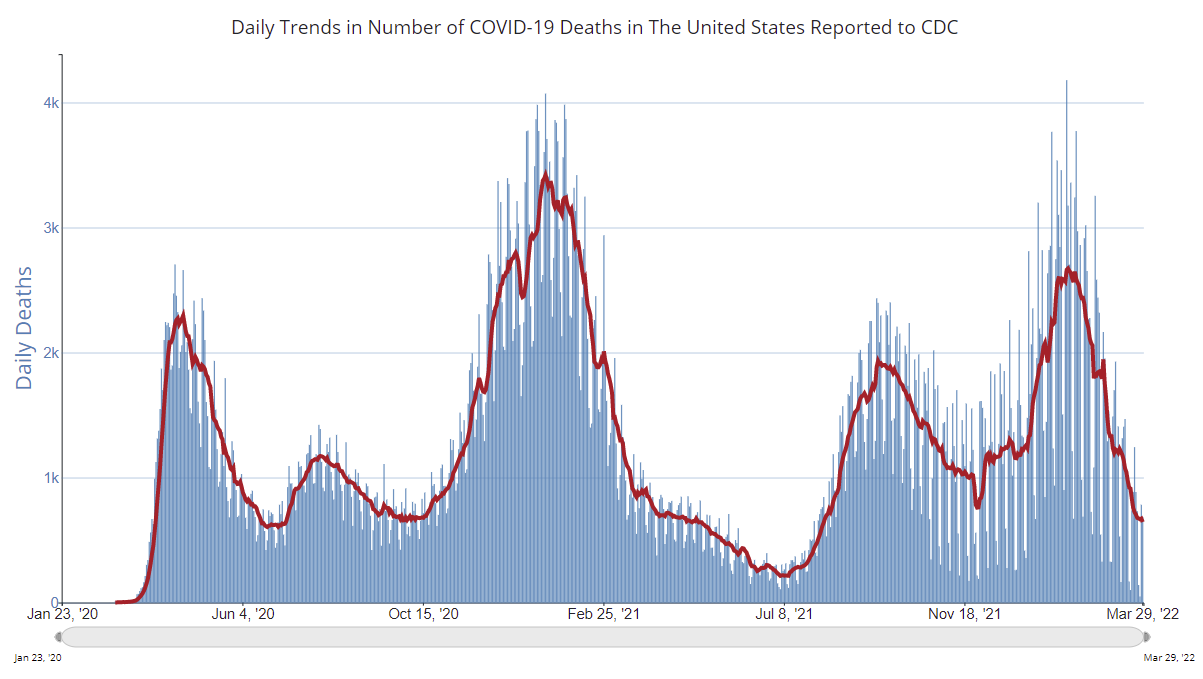 Click on graph for larger image.
This graph shows the daily (columns) and 7-day average (line) of deaths reported.
Housing: Don't Compare the Current Housing Boom to the Bubble and Bust
by Calculated Risk on 3/31/2022 04:39:00 PM
Today, in the Calculated Risk Real Estate Newsletter: Housing: Don't Compare the Current Housing Boom to the Bubble and Bust
Excerpt:
It is natural to compare the current housing boom to the mid-00s housing bubble. The bubble and subsequent bust are part of our collective memories. And graphs of nominal house prices and price-to-rent ratios look eerily similar to the housing bubble.
However, there are significant differences. First, lending has been reasonably solid during the current boom, whereas in the mid-00s, underwriting standards were almost non-existent (“fog a mirror, get a loan”). And demographics are much more favorable today than in the mid-00s.
...
A much more similar period to today is the late ‘70s and early ‘80s. House prices were increasing sharply. Demographics were very favorable for homebuying as the baby boomers moved into the first-time homebuying age group (similar to the millennials now). And inflation picked up from an already elevated level due to the second oil embargo in 1979, followed by the Iran-Iraq war in 1980, driving up costs.
In 1979, the Volcker Fed responded by raising rates, and combined with inflation, this pushed up mortgage rates sharply. Now the Powell Fed is embarking on a tightening cycle and mortgage rates have already increased significantly.
There is much more in the article. You can subscribe at https://calculatedrisk.substack.com/
Fannie Mae: Mortgage Serious Delinquency Rate Decreased in February
by Calculated Risk on 3/31/2022 04:34:00 PM
Fannie Mae reported that the Single-Family Serious Delinquency decreased to 1.11% in February from 1.17% in January. The serious delinquency rate is down from 2.76% in February 2021.
These are mortgage loans that are "three monthly payments or more past due or in foreclosure".
The Fannie Mae serious delinquency rate peaked in February 2010 at 5.59% following the housing bubble and peaked at 3.32% in August 2020 during the pandemic.
 Click on graph for larger image
By vintage, for loans made in 2004 or earlier (1% of portfolio), 3.30% are seriously delinquent (down from 3.39% in January).
For loans made in 2005 through 2008 (2% of portfolio), 5.46% are seriously delinquent (down from 5.67%),
For recent loans, originated in 2009 through 2021 (97% of portfolio), 0.89% are seriously delinquent (down from 0.95%). So, Fannie is still working through a few poor performing loans from the bubble years.
Mortgages in forbearance are counted as delinquent in this monthly report, but they will not be reported to the credit bureaus.
The pandemic related increase in delinquencies was very different from the increase in delinquencies following the housing bubble. Lending standards had been fairly solid over the previous decade, and most of these homeowners had equity in their homes - and the vast majority of these homeowners have been able to restructure their loans once they were employed.
Freddie Mac reported earlier.
Hotels: Occupancy Rate Down 5.5% Compared to Same Week in 2019
by Calculated Risk on 3/31/2022 12:33:00 PM
With lower Spring Break travel volume, U.S. hotel performance dipped slightly from the previous week, according to STR‘s latest data through March 26.The following graph shows the seasonal pattern for the hotel occupancy rate using the four-week average.
March 20-26, 2022 (percentage change from comparable week in 2019*):
• Occupancy: 65.5% (-5.5%)
• Average daily rate (ADR): $149.38 (+13.5%)
• Revenue per available room (RevPAR): $97.92 (+7.3%)
*Due to the pandemic impact, STR is measuring recovery against comparable time periods from 2019.
emphasis added
 Click on graph for larger image.
The red line is for 2022, black is 2020, blue is the median, and dashed light blue is for 2021.
The 4-week average of the occupancy rate is just below the median rate for the previous 20 years (Blue).
Note: Y-axis doesn't start at zero to better show the seasonal change.
The 4-week average of the occupancy rate will now mostly move sideways seasonally until the summer.
March Employment Preview
by Calculated Risk on 3/31/2022 12:11:00 PM
On Friday at 8:30 AM ET, the BLS will release the employment report for March. The consensus is for 475,000 jobs added, and for the unemployment rate to decrease to 3.7%.
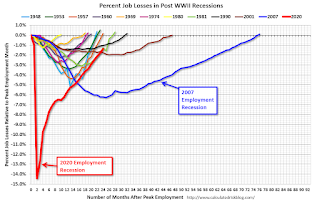 Click on graph for larger image.
• First, currently there are still about 2.1 million fewer jobs than in February 2020 (before the pandemic).
This graph shows the job losses from the start of the employment recession, in percentage terms.
The current employment recession was by far the worst recession since WWII in percentage terms. However, the current employment recession, 24 months after the onset, is now significantly better than the worst of the "Great Recession".
• ADP Report: The ADP employment report showed a gain of 455,000 private sector jobs, slightly above the consensus estimates of 438,000 jobs added. The ADP report hasn't been very useful in predicting the BLS report, but this suggests a solid March BLS report.
• ISM Surveys: The ISM surveys for March have not been released yet.
• Unemployment Claims: The weekly claims report showed a decrease in the number of initial unemployment claims during the reference week (includes the 12th of the month) from 249,000 in February to 215,000 in March. This would usually suggest fewer layoffs in March than in February, although this might not be very useful right now. In general, weekly claims were below expectations in March.
 • Permanent Job Losers: Something to watch in the employment report will be "Permanent job losers". This graph shows permanent job losers as a percent of the pre-recession peak in employment through the January report.
This data is only available back to 1994, so there is only data for three recessions. In February, the number of permanent job losers decreased to 1.583 million from 1.630 million in the previous month.
These jobs will likely be the hardest to recover, so it is a positive that the number of permanent job losers is declining fairly rapidly.
• COVID: As far as the pandemic, the number of daily cases during the reference week in February was around 33,000, down sharply from around 200,000 in February. This is a positive for the job market.
• Conclusion: There is optimism concerning the March employment report. Overall, the ADP report was solid, and unemployment claims decreased during the reference week. This suggests another solid employment report, probably at or above consensus expectations.


