 RSS Feed
 by Calculated Risk on 1/27/2022 08:25:00 PM
Thursday, January 27, 2022
Friday: Personal Income and Outlays
Friday:
• At 8:30 AM ET, Personal Income and Outlays for December. The consensus is for a 0.5% increase in personal income, and for a 0.5% decrease in personal spending. And for the Core PCE price index to increase 0.5%.
• At 10:00 AM, University of Michigan's Consumer sentiment index (Final for January). The consensus is for a reading of 68.6.
On COVID (focus on hospitalizations and deaths):
| COVID Metrics | ||||
|---|---|---|---|---|
| Now | Week Ago | Goal | ||
| Percent fully Vaccinated | 63.6% | --- | ≥70.0%1 | |
| Fully Vaccinated (millions) | 211.2 | --- | ≥2321 | |
| New Cases per Day3 | 596,859 | 744,805 | ≤5,0002 | |
| Hospitalized3 | 139,974 | 145,650 | ≤3,0002 | |
| Deaths per Day3🚩 | 2,288 | 1,829 | ≤502 | |
| 1 Minimum to achieve "herd immunity" (estimated between 70% and 85%). 2my goals to stop daily posts, 37-day average for Cases, Currently Hospitalized, and Deaths 🚩 Increasing 7-day average week-over-week for Cases, Hospitalized, and Deaths ✅ Goal met. | ||||
 Click on graph for larger image.
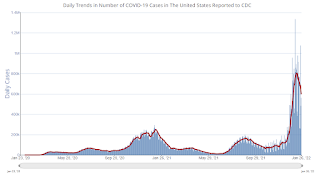
This graph shows the daily (columns) and 7-day average (line) of positive tests reported.
New cases and hospitalizations are now declining.
Unfortunately, deaths are still rising - now averaging over 2 thousand deaths per day - but below the previous 7-day average record of 3,421 in January 2021.
A Few Comments on Q4 GDP and Investment
by Calculated Risk on 1/27/2022 02:53:00 PM
Earlier from the BEA: Gross Domestic Product, Fourth Quarter and Year 2021 (Advance Estimate)
Real gross domestic product (GDP) increased at an annual rate of 6.9 percent in the fourth quarter of 2021, according to the "advance" estimate released by the Bureau of Economic Analysis. In the third quarter, real GDP increased 2.3 percent....On a Q4-over-Q4 basis, GDP was up 5.5%. An annual basis, GDP was up 5.7% in 2021 from 2020.
The increase in real GDP primarily reflected increases in private inventory investment, exports, personal consumption expenditures (PCE), and nonresidential fixed investment that were partly offset by decreases in both federal and state and local government spending. Imports, which are a subtraction in the calculation of GDP, increased.
emphasis added
The advance Q4 GDP report, at 6.9% annualized, was above expectations, primarily due to a strong increase in inventories.
Personal consumption expenditures (PCE) increased at a 3.3% annualized rate in Q4.
The graph below shows the contribution to GDP from residential investment, equipment and software, and nonresidential structures (3 quarter trailing average). This is important to follow because residential investment tends to lead the economy, equipment and software is generally coincident, and nonresidential structure investment trails the economy.
In the graph, red is residential, green is equipment and software, and blue is investment in non-residential structures. So, the usual pattern - both into and out of recessions is - red, green, blue.
Of course - with the sudden economic stop due to COVID-19 - the usual pattern didn't apply.
The dashed gray line is the contribution from the change in private inventories.
 Click on graph for larger image.
Residential investment (RI) decreased at a 0.8% annual rate in Q4. Equipment investment increased at a 0.8% annual rate, and investment in non-residential structures decreased at a 11.4% annual rate.
The contribution to Q4 GDP from investment in private inventories was 4.90 percentage points.
On a 3-quarter trailing average basis, RI (red) is down, equipment (green) is up, and nonresidential structures (blue) is still down.
On a 3-quarter trailing average basis, RI (red) is down, equipment (green) is up, and nonresidential structures (blue) is still down.
I'll post more on the components of non-residential investment once the supplemental data is released.
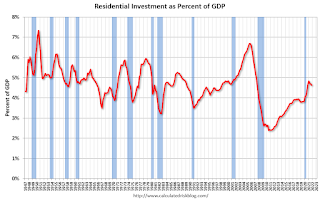 The second graph shows residential investment as a percent of GDP.
Residential Investment as a percent of GDP decreased in Q4.
I'll break down Residential Investment into components after the GDP details are released.
Note: Residential investment (RI) includes new single-family structures, multifamily structures, home improvement, broker's commissions, and a few minor categories.
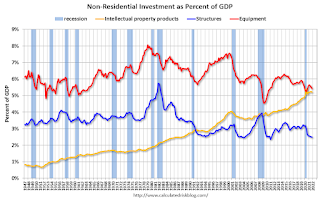 The third graph shows non-residential investment in
structures, equipment and "intellectual property products".
The third graph shows non-residential investment in
structures, equipment and "intellectual property products".
The second graph shows residential investment as a percent of GDP.Residential Investment as a percent of GDP decreased in Q4.
I'll break down Residential Investment into components after the GDP details are released.
Note: Residential investment (RI) includes new single-family structures, multifamily structures, home improvement, broker's commissions, and a few minor categories.
The third graph shows non-residential investment in
structures, equipment and "intellectual property products".
Investment in non-residential structures declined in Q4 as a percent GDP but might pick up in 2022.
Real House Prices, Price-to-Rent Ratio and Price-to-Median Income in November
by Calculated Risk on 1/27/2022 12:00:00 PM
Today, in the Calculated Risk Real Estate Newsletter: Real House Prices, Price-to-Rent Ratio and Price-to-Median Income in November
Excerpt:
I’ve put together my own affordability index - since 1976 - that is similar to the FirstAm approach (more of a house price index adjusted by mortgage rates and the median household income).
I used median income from the Census Bureau (estimated 2021), assumed a 15% down payment, and used a 2% estimate for property taxes, insurance and maintenance. This is probably low for high property tax states like New Jersey and Texas, and too high for lower property tax states. If we were including condos, we’d also include HOA fees too (this is excluded).
For house prices, I used the Case-Shiller National Index, Seasonally Adjusted (SA). Also, for the down payment - there wasn’t a significant difference between 15% and 20%. For mortgage rates, I used the Freddie Mac PMMS (30-year fixed rates).
So here is what the index looks like (lower is more affordable like the FirstAm index)
...
In general, this would suggest houses are somewhat affordable right now (due to low mortgage rates). But this says nothing about if “now is a good time to buy” (see the bottom of my post Housing: A Look at "Affordability" Indexes).
Also, in November, the average 30-year mortgage rates were around 3.071%, and currently mortgage rates are close to 3.74% - so we already know the “Affordability Price Index” will increase over the next couple of months (meaning houses are less affordable).
emphasis added

NAR: Pending Home Sales Decreased 3.8% in December
by Calculated Risk on 1/27/2022 10:03:00 AM
From the NAR: Pending Home Sales Slide 3.8% in December
Pending home sales fell in December, denoting two straight months of declines, according to the National Association of Realtors®. All four major U.S. regions posted both month-over-month and year-over-year drops in contract activity.This was well below expectations of a 0.3% increase for this index. Note: Contract signings usually lead sales by about 45 to 60 days, so this would usually be for closed sales in January and February.
The Pending Home Sales Index (PHSI), a forward-looking indicator of home sales based on contract signings, fell 3.8% to 117.7 in December. Year-over-year, transactions decreased 6.9%. An index of 100 is equal to the level of contract activity in 2001.
...
Month-over-month, the Northeast PHSI fell 1.2% to 98.2 in December, a 10.5% decline from a year ago. In the Midwest, the index dropped 3.7% to 112.8 last month, down 1.2% from December 2020.
Pending home sales transactions in the South slid 1.8% to an index of 145.2 in December, down 3.9% from December 2020. The index in the West decreased 10.0% in December to 95.0, down 16.2% from a year prior.
emphasis added
BEA: Real GDP increased at 6.9% Annualized Rate in Q4
by Calculated Risk on 1/27/2022 08:36:00 AM
From the BEA: Gross Domestic Product, Fourth Quarter and Year 2021 (Advance Estimate)
Real gross domestic product (GDP) increased at an annual rate of 6.9 percent in the fourth quarter of 2021, according to the "advance" estimate released by the Bureau of Economic Analysis. In the third quarter, real GDP increased 2.3 percent....The advance Q4 GDP report, with 6.9% annualized growth, was above expectations.
The increase in real GDP primarily reflected increases in private inventory investment, exports, personal consumption expenditures (PCE), and nonresidential fixed investment that were partly offset by decreases in both federal and state and local government spending. Imports, which are a subtraction in the calculation of GDP, increased.
emphasis added
I'll have more later ...
Weekly Initial Unemployment Claims Decrease to 260,000
by Calculated Risk on 1/27/2022 08:33:00 AM
The DOL reported:
In the week ending January 22, the advance figure for seasonally adjusted initial claims was 260,000, a decrease of 30,000 from the previous week's revised level. The previous week's level was revised up by 4,000 from 286,000 to 290,000. The 4-week moving average was 247,000, an increase of 15,000 from the previous week's revised average. The previous week's average was revised up by 1,000 from 231,000 to 232,000.The following graph shows the 4-week moving average of weekly claims since 1971.
emphasis added
 Click on graph for larger image.
The dashed line on the graph is the current 4-week average. The four-week average of weekly unemployment claims increased to 247,000.
The previous week was revised up.
Weekly claims were close to the consensus forecast, and are elevated likely due to the current COVID wave.
Wednesday, January 26, 2022
Thursday: GDP, Unemployment Claims, Durable Goods, Pending Home Sales
by Calculated Risk on 1/26/2022 08:22:00 PM
Thursday:
• At 8:30 AM ET, Gross Domestic Product, 4th quarter 2021 (Advance estimate). The consensus is that real GDP increased 5.4% annualized in Q4.
• Also, at 8:30 AM, The initial weekly unemployment claims report will be released. The consensus is for a decrease to 260 thousand from 286 thousand last week.
• Also, at 8:30 AM, Durable Goods Orders for December. The consensus is for a 0.5% decrease in durable goods.
• At 10:00 AM, Pending Home Sales Index for December. The consensus is for a 0.3% increase in the index.
• At 11:00 AM, the Kansas City Fed manufacturing survey for January. This is the last of regional manufacturing surveys for January.
On COVID (focus on hospitalizations and deaths):
| COVID Metrics | ||||
|---|---|---|---|---|
| Now | Week Ago | Goal | ||
| Percent fully Vaccinated | 63.5% | --- | ≥70.0%1 | |
| Fully Vaccinated (millions) | 210.9 | --- | ≥2321 | |
| New Cases per Day3 | 627,294 | 756,355 | ≤5,0002 | |
| Hospitalized3 | 142,194 | 144,642 | ≤3,0002 | |
| Deaths per Day3🚩 | 2,246 | 1,698 | ≤502 | |
| 1 Minimum to achieve "herd immunity" (estimated between 70% and 85%). 2my goals to stop daily posts, 37-day average for Cases, Currently Hospitalized, and Deaths 🚩 Increasing 7-day average week-over-week for Cases, Hospitalized, and Deaths ✅ Goal met. | ||||
 Click on graph for larger image.
This graph shows the daily (columns) and 7-day average (line) of positive tests reported.
New cases are now declining.
Unfortunately, deaths are still rising - now averaging over 2 thousand deaths per day - but below the previous 7-day average record of 3,421 in January 2021.
FOMC Statement: End Asset Purchases in Early March, "Soon appropriate" to Raise Rates
by Calculated Risk on 1/26/2022 02:04:00 PM
Fed Chair Powell press conference video here starting at 2:30 PM ET.
FOMC Statement:
Indicators of economic activity and employment have continued to strengthen. The sectors most adversely affected by the pandemic have improved in recent months but are being affected by the recent sharp rise in COVID-19 cases. Job gains have been solid in recent months, and the unemployment rate has declined substantially. Supply and demand imbalances related to the pandemic and the reopening of the economy have continued to contribute to elevated levels of inflation. Overall financial conditions remain accommodative, in part reflecting policy measures to support the economy and the flow of credit to U.S. households and businesses.
The path of the economy continues to depend on the course of the virus. Progress on vaccinations and an easing of supply constraints are expected to support continued gains in economic activity and employment as well as a reduction in inflation. Risks to the economic outlook remain, including from new variants of the virus.
The Committee seeks to achieve maximum employment and inflation at the rate of 2 percent over the longer run. In support of these goals, the Committee decided to keep the target range for the federal funds rate at 0 to 1/4 percent. With inflation well above 2 percent and a strong labor market, the Committee expects it will soon be appropriate to raise the target range for the federal funds rate. The Committee decided to continue to reduce the monthly pace of its net asset purchases, bringing them to an end in early March. Beginning in February, the Committee will increase its holdings of Treasury securities by at least $20 billion per month and of agency mortgage‑backed securities by at least $10 billion per month. The Federal Reserve's ongoing purchases and holdings of securities will continue to foster smooth market functioning and accommodative financial conditions, thereby supporting the flow of credit to households and businesses.
In assessing the appropriate stance of monetary policy, the Committee will continue to monitor the implications of incoming information for the economic outlook. The Committee would be prepared to adjust the stance of monetary policy as appropriate if risks emerge that could impede the attainment of the Committee's goals. The Committee's assessments will take into account a wide range of information, including readings on public health, labor market conditions, inflation pressures and inflation expectations, and financial and international developments.
Voting for the monetary policy action were Jerome H. Powell, Chair; John C. Williams, Vice Chair; Michelle W. Bowman; Lael Brainard; James Bullard; Esther L. George; Patrick Harker; Loretta J. Mester; and Christopher J. Waller. Patrick Harker voted as an alternate member at this meeting.
emphasis added
December New Home Sales: Inventory of homes under construction highest since 2007
by Calculated Risk on 1/26/2022 10:47:00 AM
Today, in the Calculated Risk Real Estate Newsletter: December New Home Sales: Inventory of homes under construction highest since 2007
Brief excerpt:
The next graph shows new home sales for 2020 and 2021 by month (Seasonally Adjusted Annual Rate). Sales in 2021 (762 thousand) were 7.3% below sales in 2020 (822 thousand).You can subscribe at https://calculatedrisk.substack.com/.
The year-over-year comparisons were easy in the first half of 2021 - especially in March and April. However, sales will be down year-over-year again in January since the sales were delayed in 2020 - and sales in the winter were strong.
...
The next graph shows the months of supply by stage of construction. “Months of supply” is inventory at each stage, divided by the sales rate.
The inventory of completed homes for sale was at 39 thousand in December, up from the record low of 33 thousand in March, April, May and July 2021. That is about 0.6 months of completed supply (red line). This is about half the normal level.
The inventory of new homes under construction is at 3.9 months (blue line) - well above the normal level. This elevated level of homes under construction is due to supply chain constraints. And 101 thousand homes have not been started - about 1.5 months of supply (grey line) - almost double the normal level.
New Home Sales increase to 811,000 Annual Rate in December; Sales down 7.3% in 2021
by Calculated Risk on 1/26/2022 10:09:00 AM
The Census Bureau reports New Home Sales in December were at a seasonally adjusted annual rate (SAAR) of 744 thousand.
The previous three months were revised down, combined.
Sales of new single‐family houses in December 2021 were at a seasonally adjusted annual rate of 811,000, according to estimates released jointly today by the U.S. Census Bureau and the Department of Housing and Urban Development. This is 11.9 percent above the revised November rate of 725,000, but is 14.0 percent below the December 2020 estimate of 943,000.
An estimated 762,000 new homes were sold in 2021. This is 7.3 percent below the 2020 figure of 822,000.
emphasis added
 Click on graph for larger image.
The first graph shows New Home Sales vs. recessions since 1963. The dashed line is the current sales rate.
New home sales are now declining year-over-year since sales soared following the first few months of the pandemic.
The second graph shows New Home Months of Supply.
 The months of supply decreased in December to 6.0 months from 6.6 months in November.
 The all-time record high was 12.1 months of supply in January 2009. The all-time record low was 3.5 months, most recently in October 2020.
This is at the top of the normal range (about 4 to 6 months of supply is normal).
"The seasonally‐adjusted estimate of new houses for sale at the end of December was 403,000. This represents a supply of 6.0 months at the current sales rate."
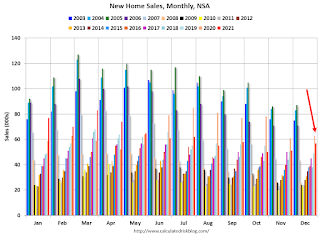 The last graph shows sales NSA (monthly sales, not seasonally adjusted annual rate).
In December 2021 (red column), 57 thousand new homes were sold (NSA). Last year, 61 thousand homes were sold in December.
The all-time high for December was 87 thousand in 2005, and the all-time low for December was 23 thousand in 2010.
This was above expectations of 760 thousand SAAR, however sales in the three previous months were revised down, combined. I'll have more later today.


