by Calculated Risk on 11/24/2021 03:43:00 PM
Wednesday, November 24, 2021
November Vehicle Sales Forecast: Increase to 13.6 million SAAR
From WardsAuto: U.S. Light-Vehicle Sales to Continue Growth in November; More Strength Likely in December (pay content)
Low inventories and supply issues continue to impacting vehicle sales, but sales are bouncing back.

This graph shows actual sales from the BEA (Blue), and Wards forecast for November (Red).
The Wards forecast of 13.6 million SAAR, would be up about 4.7% from last month, and down 14% from a year ago (sales were solid in November 2020, as sales recovered from the depths of the pandemic).
November 24th COVID-19: New Cases and Hospitalizations Increasing
by Calculated Risk on 11/24/2021 03:40:00 PM
| COVID Metrics | ||||
|---|---|---|---|---|
| Today | Week Ago | Goal | ||
| Percent fully Vaccinated | 59.1% | --- | ≥70.0%1 | |
| Fully Vaccinated (millions) | 196.2 | --- | ≥2321 | |
| New Cases per Day3🚩 | 94,266 | 85,927 | ≤5,0002 | |
| Hospitalized3🚩 | 43,896 | 40,950 | ≤3,0002 | |
| Deaths per Day3 | 982 | 982 | ≤502 | |
| 1 Minimum to achieve "herd immunity" (estimated between 70% and 85%). 2my goals to stop daily posts, 37-day average for Cases, Currently Hospitalized, and Deaths 🚩 Increasing 7-day average week-over-week for Cases, Hospitalized, and Deaths ✅ Goal met. | ||||
IMPORTANT: For "herd immunity" most experts believe we need 70% to 85% of the total population fully vaccinated (or already had COVID). Note: COVID will probably stay endemic (at least for some time).
The following 19 states have between 50% and 59.9% fully vaccinated: Wisconsin at 59.3%, Nebraska, Iowa, Utah, Michigan, Texas, Kansas, Arizona, Nevada, South Dakota, North Carolina, Alaska, Ohio, Kentucky, Montana, Oklahoma, South Carolina, Missouri and Indiana at 50.5%.
Next up (total population, fully vaccinated according to CDC) are Georgia at 49.4%, Tennessee at 49.4%, Arkansas at 49.1%, Louisiana at 48.7% and North Dakota at 48.6%.
 Click on graph for larger image.
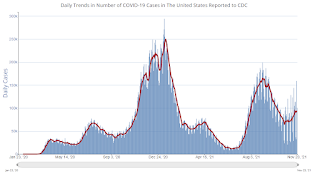
This graph shows the daily (columns) and 7-day average (line) of positive tests reported.
FOMC Minutes: "Participants expected significant inflation pressures to last for longer than they previously expected"
by Calculated Risk on 11/24/2021 02:11:00 PM
From the Fed: FOMC Minutes, Minutes of the Federal Open Market Committee, November 2-3, 2021. Excerpt on inflation:
Participants generally saw the current elevated level of inflation as largely reflecting factors that were likely to be transitory but judged that inflation pressures could take longer to subside than they had previously assessed. They remarked that the Delta wave had intensified the impediments to supply chains and had helped sustain the high level of goods demand, adding to the upward pressure on prices. Participants also observed that increases in energy prices, stronger rates of nominal wage growth, and higher housing rental costs had been forces adding to inflation. Some participants highlighted the fact that price increases had become more widespread. Although participants expected significant inflation pressures to last for longer than they previously expected, they generally continued to anticipate that the inflation rate would diminish significantly during 2022 as supply and demand imbalances abated. Nonetheless, they indicated that their uncertainty regarding this assessment had increased. Many participants pointed to considerations that might suggest that elevated inflation could prove more persistent. These participants noted that average inflation already exceeded 2 percent when measured on a multiyear basis and cited a number of factors—such as businesses' enhanced scope to pass on higher costs to their customers, the possibility that nominal wage growth had become more sensitive to labor market pressures, or accommodative financial conditions—that might result in inflation continuing at elevated levels. Some other participants, however, remarked that although inflationary pressures were lasting longer than anticipated, those pressures continued to reflect the same pandemic-related imbalances and would likely abate when supply constraints eased. These participants also noted that the most sizable price increases may have already occurred, that there was as yet little evidence of a change in inflation dynamics—such as the development of a wage–price spiral—that would tend to prolong elevated levels of inflation, and that forces already in motion would likely bring inflation down toward 2 percent over the medium term. Participants were attentive to the sizable increase in the cost of living that had taken place this year and the associated burden on U.S. households, particularly those who had limited scope to pay higher prices for essential goods and services.
In their comments on inflation expectations, a number of participants discussed the risk that, in light of recent elevated levels of inflation, the public's longer-term expectations of inflation might increase to a level above that consistent with the Committee's longer-run inflation objective; such a development could make it harder for the Committee to achieve 2 percent inflation over the longer run. A couple of participants pointed to increases in survey- and market-based indicators of expected inflation—including the notable rise in the five-year TIPS-based measure of inflation compensation—as possible signs that inflation expectations were becoming less well anchored. Several other participants, however, remarked that measures of near- and medium-term inflation expectations typically had been sensitive to movements in realized inflation and that they had not exhibited greater sensitivity recently. They additionally pointed out that indicators of longer-term inflation expectations—including the five-year, five-year-forward measure of inflation compensation—continued to display less sensitivity to realized inflation and remained well anchored at levels consistent with the Committee's longer-run 2 percent goal.
...
Various participants noted that the Committee should be prepared to adjust the pace of asset purchases and raise the target range for the federal funds rate sooner than participants currently anticipated if inflation continued to run higher than levels consistent with the Committee's objectives. At the same time, because of the continuing considerable uncertainty about developments in supply chains, production logistics, and the course of the virus, a number of participants stressed that a patient attitude toward incoming data remained appropriate to allow for careful evaluation of evolving supply chain developments and their implications for the labor market and inflation. That said, participants noted that the Committee would not hesitate to take appropriate actions to address inflation pressures that posed risks to its longer-run price stability and employment objectives.
emphasis added
New Home Sales: Record 109 thousand homes have not been started
by Calculated Risk on 11/24/2021 12:21:00 PM
Today, in the Real Estate Newsletter: New Home Sales: Record 109 thousand homes have not been started
Brief excerpt:
Sales, year to date in 2021, are 4.4% below sales in 2020, and new home sales in 2021 will finish solidly below sales in 2020 - since sales in 2020 finished strong.You can subscribe at https://calculatedrisk.substack.com/ (Currently all content is available for free, but please subscribe).
This graph shows new home sales for 2020 and 2021 by month (Seasonally Adjusted Annual Rate).
The year-over-year comparisons were easy in the first half of 2021 - especially in March and April. However, sales will likely be down year-over-year for the remainder of 2021 - since the selling season was delayed in 2020.
...
The next graph shows the months of supply by stage of construction. “Months of supply” is inventory at each stage, divided by the sales rate.
The inventory of completed homes for sale was at 38 thousand in October, just above the record low of 33 thousand in March, April, May and July 2021. That is about 0.6 months of completed supply (red line). This is about half the normal level.
The inventory of new homes under construction is at 3.9 months (blue line) - well above the normal level. This elevated level of homes under construction is due to supply chain constraints.
And a record 109 thousand homes have not been started - about 1.8 months of supply (grey line) - almost double the normal level. Homebuilders are probably waiting to start some homes until they have a firmer grasp on prices.
Personal Income increased 0.5% in October; Spending increased 1.3%
by Calculated Risk on 11/24/2021 10:17:00 AM
The BEA released the Personal Income and Outlays, October 2021 report:
Personal income increased $93.4 billion (0.5 percent) in October according to estimates released today by the Bureau of Economic Analysis. Disposable personal income (DPI) increased $63.0 billion (0.3 percent) and personal consumption expenditures (PCE) increased $214.3 billion (1.3 percent).The October PCE price index increased 5.0 percent year-over-year and the October PCE price index, excluding food and energy, increased 4.1 percent year-over-year.
Real DPI decreased 0.3 percent in October and Real PCE increased 0.7 percent; goods increased 1.0 percent and services increased 0.5 percent. The PCE price index increased 0.6 percent. Excluding food and energy, the PCE price index increased 0.4 percent.
emphasis added
The following graph shows real Personal Consumption Expenditures (PCE) through October 2021 (2012 dollars). Note that the y-axis doesn't start at zero to better show the change.
 Click on graph for larger image.
The dashed red lines are the quarterly levels for real PCE.
Personal income and personal spending were above expectations, and the increase in the PCE price index was above expectations.
New Home Sales at 745,000 Annual Rate in October
by Calculated Risk on 11/24/2021 10:08:00 AM
The Census Bureau reports New Home Sales in October were at a seasonally adjusted annual rate (SAAR) of 745 thousand.
The previous three months were revised down significantly.
Sales of new single‐family houses in October 2021 were at a seasonally adjusted annual rate of 745,000, according to estimates released jointly today by the U.S. Census Bureau and the Department of Housing and Urban Development. This is 0.4 percent above the revised September rate of 742,000, but is 23.1 percent below the October 2020 estimate of 969,000.
emphasis added
 Click on graph for larger image.
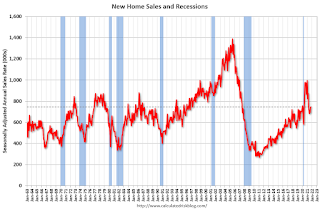
The first graph shows New Home Sales vs. recessions since 1963. The dashed line is the current sales rate.
New home sales are now declining year-over-year since sales soared following the first few months of the pandemic.
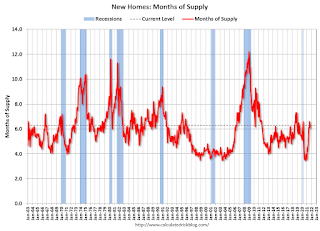
The second graph shows New Home Months of Supply.
 The months of supply increased in October to 6.3 months from 6.1 months in September.
 The all-time record high was 12.1 months of supply in January 2009. The all-time record low was 3.5 months, most recently in October 2020.
This is slightly above the normal range (about 4 to 6 months of supply is normal).
"The seasonally‐adjusted estimate of new houses for sale at the end of October was 389,000. This represents a supply of 6.3 months at the current sales rate."
 The last graph shows sales NSA (monthly sales, not seasonally adjusted annual rate).
In October 2021 (red column), 59 thousand new homes were sold (NSA). Last year, 78 thousand homes were sold in October.
The all-time high for October was 105 thousand in 2005, and the all-time low for October was 23 thousand in 2010.
This was well below expectations of 801 thousand SAAR, and sales in the three previous months were revised down significantly. I'll have more later today.
Weekly Initial Unemployment Claims Decrease to 199,000
by Calculated Risk on 11/24/2021 08:37:00 AM
The DOL reported:
In the week ending November 20, the advance figure for seasonally adjusted initial claims was 199,000, a decrease of 71,000 from the previous week's revised level. This is the lowest level for initial claims since November 15, 1969 when it was 197,000. The previous week's level was revised up by 2,000 from 268,000 to 270,000. The 4-week moving average was 252,250, a decrease of 21,000 from the previous week's revised average. This is the lowest level for this average since March 14, 2020 when it was 225,500. The previous week's average was revised up by 500 from 272,750 to 273,250.The following graph shows the 4-week moving average of weekly claims since 1971.
emphasis added
 Click on graph for larger image.
The dashed line on the graph is the current 4-week average. The four-week average of weekly unemployment claims decreased to 252,250.
The previous week was revised up.
Regular state continued claims decreased to 2,049,000 (SA) from 2,109,000 (SA) the previous week.
Weekly claims were well below the consensus forecast.
Q3 GDP Growth Revised up to 2.1% Annual Rate
by Calculated Risk on 11/24/2021 08:33:00 AM
From the BEA: Gross Domestic Product, Third Quarter 2021 (Second Estimate); Corporate Profits, Third Quarter 2021 (Preliminary Estimate)
Real gross domestic product (GDP) increased at an annual rate of 2.1 percent in the third quarter of 2021, according to the "second" estimate released by the Bureau of Economic Analysis. In the second quarter, real GDP increased 6.7 percent.Here is a Comparison of Second and Advance Estimates. PCE growth was revised up from 1.6% to 1.7%. Residential investment was revised down from -7.7% to -8.3%. This was at the consensus forecast.
The GDP estimate released today is based on more complete source data than were available for the "advance" estimate issued last month. In the advance estimate, the increase in real GDP was 2.0 percent. The update primarily reflects upward revisions to personal consumption expenditures (PCE) and private inventory investment.
emphasis added
MBA: Mortgage Applications Increase in Latest Weekly Survey
by Calculated Risk on 11/24/2021 07:00:00 AM
From the MBA: Mortgage Applications Increase in Latest MBA Weekly Survey
Mortgage applications increased 1.8 percent from one week earlier, according to data from the Mortgage Bankers Association’s (MBA) Weekly Mortgage Applications Survey for the week ending November 19, 2021.
... The Refinance Index increased 0.4 percent from the previous week and was 34 percent lower than the same week one year ago. The seasonally adjusted Purchase Index increased 5 percent from one week earlier. The unadjusted Purchase Index decreased 0.4 percent compared with the previous week and was 4 percent lower than the same week one year ago.
“The financial markets continue to discern the Federal Reserve’s policy path in the coming months in light of the current high growth, high inflation environment. Despite a fair amount of rate volatility last week, mortgage rates were higher, with the 30-year fixed rate increasing 4 basis points to 3.24 percent,” said Joel Kan, MBA’s Associate Vice President of Economic and Industry Forecasting. “Despite the increase in rates, refinance applications rose slightly, driven by a 2 percent gain in conventional refinances. Borrowers continue to lock in mortgages in anticipation of higher rates in the future. Refinance applications were still more than 30 percent below a year ago, when the 30-year fixed rate was 32 basis points lower.”
Added Kan, “Purchase activity increased for the third straight week, as housing demand remains robust, even as the housing market approaches the typically slower holiday season. Both conventional and government loan applications increased, and the average loan size for a purchase loan was at $407,200, continuing its ongoing 2021 run of being mostly above $400,000.”
...
The average contract interest rate for 30-year fixed-rate mortgages with conforming loan balances ($548,250 or less) increased to 3.24 percent from 3.20 percent, with points decreasing to 0.36 from 0.43 (including the origination fee) for 80 percent loan-to-value ratio (LTV) loans.
emphasis added
 Click on graph for larger image.
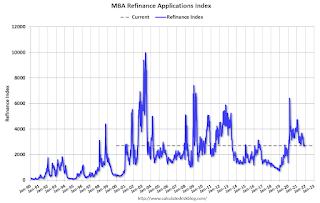
The first graph shows the refinance index since 1990.
With relatively low rates, the index remains somewhat elevated, but down sharply from last year.
The second graph shows the MBA mortgage purchase index
 According to the MBA, purchase activity is down 4% year-over-year unadjusted.
Note: Red is a four-week average (blue is weekly).
Tuesday, November 23, 2021
Wednesday: New Home Sales, GDP, Unemployment Claims, Personal Income & Outlays and More
by Calculated Risk on 11/23/2021 09:00:00 PM
Wednesday:
• At 7:00 AM ET, The Mortgage Bankers Association (MBA) will release the results for the mortgage purchase applications index.
• At 8:30 AM, The initial weekly unemployment claims report will be released. The consensus is for 270 thousand initial claims, up from 268 thousand last week.
• Also at 8:30 AM, Gross Domestic Product, 3nd quarter 2020 (Second estimate). The consensus is that real GDP increased 2.1% annualized in Q3, up from 2.0% in the advance estimate of GDP.
• Also at 8:30 AM, Durable Goods Orders for October from the Census Bureau. The consensus is for a 0.2% increase in durable goods orders.
• At 10:00 AM, Personal Income and Outlays for October. The consensus is for a 0.2% increase in personal income, and for a 1.0% increase in personal spending. And for the Core PCE price index to increase 0.4%.
• Also at 10:00 AM, New Home Sales for October from the Census Bureau. The consensus is for 801 thousand SAAR, up from 800 thousand in September.
• At 10:00 AM, University of Michigan's Consumer sentiment index (Final for November). The consensus is for a reading of 66.8.
• At 2:00 PM, FOMC Minutes, Meeting of November 2-3, 2021


