by Calculated Risk on 8/18/2021 08:36:00 AM
Wednesday, August 18, 2021
Housing Starts decreased to 1.534 Million Annual Rate in July
From the Census Bureau: Permits, Starts and Completions
Housing Starts:
Privately‐owned housing starts in July were at a seasonally adjusted annual rate of 1,534,000. This is 7.0 percent below the revised June estimate of 1,650,000, but is 2.5 percent above the July 2020 rate of 1,497,000. Single‐family housing starts in July were at a rate of 1,111,000; this is 4.5 percent below the revised June figure of 1,163,000. The July rate for units in buildings with five units or more was 412,000.
Building Permits:
Privately‐owned housing units authorized by building permits in July were at a seasonally adjusted annual rate of 1,635,000. This is 2.6 percent above the revised June rate of 1,594,000 and is 6.0 percent above the July 2020 rate of 1,542,000. Single‐family authorizations in July were at a rate of 1,048,000; this is 1.7 percent below the revised June figure of 1,066,000. Authorizations of units in buildings with five units or more were at a rate of 532,000 in July
emphasis added
 Click on graph for larger image.
The first graph shows single and multi-family housing starts for the last several years.
Multi-family starts (red, 2+ units) decreased in July compared to June. Multi-family starts were down 16% year-over-year in July.
Single-family starts (blue) decreased in July, and were up 12% year-over-year (starts slumped at the beginning of the pandemic, but picked up in July 2020).
 The second graph shows total and single unit starts since 1968.
 The second graph shows the huge collapse following the housing bubble, and then the eventual recovery (but still not historically high).
Total housing starts in July were well below expectations, however starts in May and June were revised up slightly.
I'll have more later …
MBA: Mortgage Applications Decrease in Latest Weekly Survey
by Calculated Risk on 8/18/2021 07:00:00 AM
From the MBA: Mortgage Applications Decrease in Latest MBA Weekly Survey
Mortgage applications decreased 3.9 percent from one week earlier, according to data from the Mortgage Bankers Association’s (MBA) Weekly Mortgage Applications Survey for the week ending August 13, 2021.
... The Refinance Index decreased 5 percent from the previous week and was 8 percent lower than the same week one year ago. The seasonally adjusted Purchase Index decreased 1 percent from one week earlier. The unadjusted Purchase Index decreased 2 percent compared with the previous week and was 19 percent lower than the same week one year ago.
“Mortgage rates were at their highest levels in around a month, with the 30-year fixed rate increasing above 3 percent to 3.06 percent. Mortgage rates followed an overall increase in Treasury yields last week, which started higher from the strong July jobs report before slowing because of weaker consumer sentiment and concerns about rising COVID-19 cases,” said Joel Kan, MBA’s Associate Vice President of Economic and Industry Forecasting. “The increase in mortgage rates caused a 5 percent decrease in refinancing, driven by a 7 percent drop in conventional refinance applications. Even though rates are 7 basis points lower than the same week a year ago, the refinance index is around 8 percent lower. The eligible pool of homeowners who stand to benefit from a refinance is smaller now.”
Added Kan, “Purchase applications also saw a mixed results, with conventional purchase applications down and government purchases up. Government purchase loans, such as FHA loans, are typically popular with first-time buyers. Despite a second-straight weekly decrease, average loan sizes remain close to record highs. This is a continuing sign that sales prices are still elevated, driven by stiff competition leading to accelerating home-price growth.”
...
The average contract interest rate for 30-year fixed-rate mortgages with conforming loan balances ($548,250 or less) increased to 3.06 percent from 2.99 percent, with points increasing to 0.34 from 0.30 (including the origination fee) for 80 percent loan-to-value ratio (LTV) loans.
emphasis added
 Click on graph for larger image.
The first graph shows the refinance index since 1990.
With low rates, the index remains elevated.
The second graph shows the MBA mortgage purchase index
 According to the MBA, purchase activity is down 19% year-over-year unadjusted.
Note: The year ago comparisons for the unadjusted purchase index are now difficult since purchase activity picked up in late May 2020.
Note: Red is a four-week average (blue is weekly).
Tuesday, August 17, 2021
Wednesday: Housing Starts, Preliminary Employment Benchmark, FOMC Minutes
by Calculated Risk on 8/17/2021 09:00:00 PM
Wednesday:
• At 7:00 AM ET, The Mortgage Bankers Association (MBA) will release the results for the mortgage purchase applications index.
• At 8:30 AM, Housing Starts for July. The consensus is for 1.602 million SAAR, down from 1.643 million SAAR in June.
• At 10:00 AM, the Bureau of Labor Statistics (BLS) will release the preliminary estimate of the upcoming annual benchmark revision.
• During the day, The AIA's Architecture Billings Index for July (a leading indicator for commercial real estate).
• At 2:00 PM, FOMC Minutes, July 27-28, 2021
August 17th COVID-19: Wave Still Increasing
by Calculated Risk on 8/17/2021 05:02:00 PM
New data from Israel: A grim warning from Israel: Vaccination blunts, but does not defeat Delta (get vaccinated and mask up!)
The 7-day average deaths is the highest since May 14th.
According to the CDC, on Vaccinations.
Total doses administered: 357,894,995, as of a week ago 352,550,944. Average doses last week: 0.76 million per day.
| COVID Metrics | ||||
|---|---|---|---|---|
| Today | Yesterday | Week Ago | Goal | |
| Percent fully Vaccinated | 50.9% | 50.8% | 50.3% | ≥70.0%1 |
| Fully Vaccinated (millions) | 168.9 | 168.7 | 166.9 | ≥2321 |
| New Cases per Day3🚩 | 128,347 | 125,036 | 112,259 | ≤5,0002 |
| Hospitalized3🚩 | 72,874 | 71,266 | 57,307 | ≤3,0002 |
| Deaths per Day3🚩 | 553 | 547 | 501 | ≤502 |
| 1 Minimum to achieve "herd immunity" (estimated between 70% and 85%). 2my goals to stop daily posts, 37 day average for Cases, Currently Hospitalized, and Deaths 🚩 Increasing 7 day average week-over-week for Cases, Hospitalized, and Deaths ✅ Goal met. | ||||
IMPORTANT: For "herd immunity" most experts believe we need 70% to 85% of the total population fully vaccinated (or already had COVID).
The following 19 states have between 50% and 59.9% fully vaccinated: New Jersey at 59.9%, New Hampshire, Washington, New York State, New Mexico, Oregon, District of Columbia, Virginia, Colorado, Minnesota, Hawaii, California, Delaware, Pennsylvania, Wisconsin, and Nebraska, Florida and Iowa all at 50.6%.
Next up (total population, fully vaccinated according to CDC) are Illinois at 49.9%, Michigan at 49.6%, South Dakota at 48.0, Ohio at 47.4%, Kentucky at 46.9%, Arizona at 46.6%, Kansas at 46.6%, Alaska at 46.3%, Nevada at 46.0% and Utah at 45.8%.
 Click on graph for larger image.
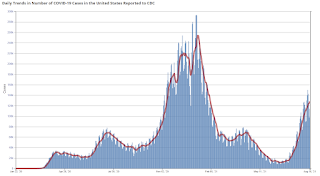
This graph shows the daily (columns) and 7 day average (line) of positive tests reported.
LA Area Port Traffic: Solid Imports, Weak Exports in July
by Calculated Risk on 8/17/2021 02:41:00 PM
Note: The expansion to the Panama Canal was completed in 2016 (As I noted a few years ago), and some of the traffic that used the ports of Los Angeles and Long Beach is probably going through the canal. This might be impacting TEUs on the West Coast.
Container traffic gives us an idea about the volume of goods being exported and imported - and usually some hints about the trade report since LA area ports handle about 40% of the nation's container port traffic.
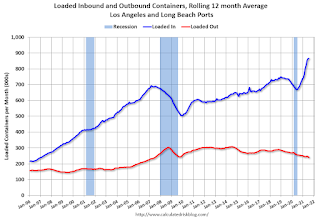
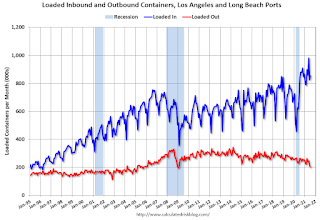
The following graphs are for inbound and outbound traffic at the ports of Los Angeles and Long Beach in TEUs (TEUs: 20-foot equivalent units or 20-foot-long cargo container).
To remove the strong seasonal component for inbound traffic, the first graph shows the rolling 12 month average.

On a rolling 12 month basis, inbound traffic was up 0.2% in July compared to the rolling 12 months ending in June. Outbound traffic was down 2.2% compared to the rolling 12 months ending the previous month.
The 2nd graph is the monthly data (with a strong seasonal pattern for imports).

Imports were up 2% YoY in July (recovered last year in July following the early months of the pandemic), and exports were down 24.0% YoY.
NAHB: Builder Confidence Declined to 75 in August
by Calculated Risk on 8/17/2021 10:05:00 AM
The National Association of Home Builders (NAHB) reported the housing market index (HMI) was at 75, down from 80 in July. Any number above 50 indicates that more builders view sales conditions as good than poor.
From the NAHB: Builder Confidence at 13-Month Low on Higher Material Costs, Home Prices
Builder sentiment in the market for newly-built single-family homes fell five points to 75 in August, according to the latest National Association of Home Builders/Wells Fargo Housing Market Index (HMI). The index is at its lowest point since July 2020.
Higher construction costs and supply shortages have led to significant price growth, which in turn has caused prospective buyers to experience sticker shock. The decline in the buyer traffic index to its lowest level since July 2020 is evidence that supply-side constraints have begun to hold consumers back.
...
The HMI index gauging current sales conditions fell five points to 81 and the component measuring traffic of prospective buyers also posted a five-point decline to 60. The gauge charting sales expectations in the next six months held steady at 81.
Looking at the three-month moving averages for regional HMI scores, the Northeast fell one point to 74, the Midwest dropped two points to 68, the South posted a three-point decline to 82 and the West registered a two-point drop to 85.
 Click on graph for larger image.
This graph show the NAHB index since Jan 1985.
This was well below the consensus forecast, but still a solid reading.
Industrial Production Increased 0.9 Percent in July
by Calculated Risk on 8/17/2021 09:22:00 AM
From the Fed: Industrial Production and Capacity Utilization
Industrial production increased 0.9 percent in July after moving up 0.2 percent in June. In July, manufacturing output rose 1.4 percent. About half of the gain in factory output is attributable to a jump of 11.2 percent for motor vehicles and parts, as a number of vehicle manufacturers trimmed or canceled their typical July shutdowns. Despite the large increase last month, vehicle assemblies continued to be constrained by a persistent shortage of semiconductors; the production of motor vehicles and parts in July was about 3-1/2 percent below its recent peak in January 2021. The output of utilities decreased 2.1 percent in July, while the index for mining rose 1.2 percent.
At 101.1 percent of its 2017 average, total industrial production in July was 6.6 percent above its year-earlier level but 0.2 percent below its pre-pandemic (February 2020) level. Capacity utilization for the industrial sector rose 0.7 percentage point in July to 76.1 percent, a rate that is 3.5 percentage points below its long-run (1972–2020) average.
emphasis added
 Click on graph for larger image.
This graph shows Capacity Utilization. This series is up from the record low set in April 2020, but still below the level in February 2020.
Capacity utilization at 76.1% is 3.5% below the average from 1972 to 2020.
Note: y-axis doesn't start at zero to better show the change.
 The second graph shows industrial production since 1967.
Industrial production increased in July to 101.1. This is 0.2% below the February 2020 level.
The change in industrial production was above consensus expectations, probably due to vehicle manufacturers not shutting down in July.
Retail Sales Decreased 1.1% in July
by Calculated Risk on 8/17/2021 08:39:00 AM
On a monthly basis, retail sales were decreased 1.1% from June to July (seasonally adjusted), and sales were up 15.8 percent from July 2020.
From the Census Bureau report:
Advance estimates of U.S. retail and food services sales for July 2021, adjusted for seasonal variation and holiday and trading-day differences, but not for price changes, were $617.7 billion, a decrease of 1.1 percent from the previous month, but 15.8 percent above July 2020. ... The May 2021 to June 2021 percent change was revised from up 0.6 percent to up 0.7 percent.
emphasis added
 Click on graph for larger image.
This graph shows retail sales since 1992. This is monthly retail sales and food service, seasonally adjusted (total and ex-gasoline).
Retail sales ex-gasoline were down 1.4% in July.
The second graph shows the year-over-year change in retail sales and food service (ex-gasoline) since 1993.
 Retail and Food service sales, ex-gasoline, increased by 14.2% on a YoY basis.
Sales in July were below expectations, however sales in May and June were revised up.
Monday, August 16, 2021
Tuesday: Retail Sales, Industrial Production, Homebuilder Survey and More
by Calculated Risk on 8/16/2021 09:00:00 PM
From Matthew Graham at Mortgage News Daily: MBS RECAP: Drifty Day, Treasuries Hold Weekly Gains, MBS Underperform
MBS underperformed, ultimately returning to 'unchanged' levels in the 4pm hour even as Treasuries remined slightly stronger on the day. ... [30 year fixed 2.93%]Tuesday:
emphasis added
• At 8:30 AM ET, Retail sales for July is scheduled to be released. The consensus is for 0.2% decrease in retail sales.
• At 9:15 AM, The Fed will release Industrial Production and Capacity Utilization for July. The consensus is for a 0.5% increase in Industrial Production, and for Capacity Utilization to increase to 75.7%.
• At 10:00 AM, The August NAHB homebuilder survey. The consensus is for a reading of 80, unchanged from 80. Any number above 50 indicates that more builders view sales conditions as good than poor.
• At 12:00 PM, MBA Q2 National Delinquency Survey (expected)
• At 1:30 PM, Fed Chair Powell speaks: Conversation with the Chair: A Virtual Teacher Town Hall Meeting
August 16th COVID-19: Data reported on Monday is always low, and is revised up as data is received
by Calculated Risk on 8/16/2021 08:15:00 PM
According to the CDC, on Vaccinations.
Total doses administered: 357,292,057, as of a week ago 351,933,175. Average doses last week: 0.77 million per day.
| COVID Metrics | ||||
|---|---|---|---|---|
| Today | Yesterday | Week Ago | Goal | |
| Percent fully Vaccinated | 50.8% | 50.7% | 50.3% | ≥70.0%1 |
| Fully Vaccinated (millions) | 168.7 | 168.4 | 166.7 | ≥2321 |
| New Cases per Day3 | 108,470 | 115,299 | 110,656 | ≤5,0002 |
| Hospitalized3🚩 | 65,935 | 67,640 | 54,857 | ≤3,0002 |
| Deaths per Day3 | 495 | 523 | 495 | ≤502 |
| 1 Minimum to achieve "herd immunity" (estimated between 70% and 85%). 2my goals to stop daily posts, 37 day average for Cases, Currently Hospitalized, and Deaths 🚩 Increasing 7 day average week-over-week for Cases, Hospitalized, and Deaths ✅ Goal met. | ||||
IMPORTANT: For "herd immunity" most experts believe we need 70% to 85% of the total population fully vaccinated (or already had COVID).
The following 19 states have between 50% and 59.9% fully vaccinated: New Jersey at 59.8%, New Hampshire, Washington, New York State, New Mexico, Oregon, District of Columbia, Virginia, Colorado, Minnesota, Hawaii, California, Delaware, Pennsylvania, Wisconsin, Nebraska, Florida and Iowa at 50.4%.
Next up (total population, fully vaccinated according to CDC) are Illinois at 49.8%, Michigan at 49.6%, South Dakota at 47.9, Ohio at 47.4%, Kentucky at 46.8%, Arizona at 46.5%, Kansas at 46.5%, Alaska at 46.3%, Nevada at 46.0% and Utah at 45.8%.
 Click on graph for larger image.
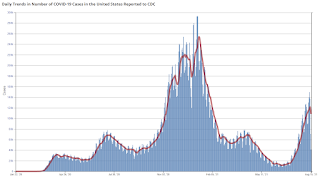
This graph shows the daily (columns) and 7 day average (line) of positive tests reported.


