 RSS Feed
 by Calculated Risk on 8/17/2021 05:02:00 PM
Tuesday, August 17, 2021
August 17th COVID-19: Wave Still Increasing
New data from Israel: A grim warning from Israel: Vaccination blunts, but does not defeat Delta (get vaccinated and mask up!)
Update: Great explainer here (not as bad as it seemed) Israeli data: How can efficacy vs. severe disease be strong when 60% of hospitalized are vaccinated?
The 7-day average deaths is the highest since May 14th.
According to the CDC, on Vaccinations.
Total doses administered: 357,894,995, as of a week ago 352,550,944. Average doses last week: 0.76 million per day.
IMPORTANT: For "herd immunity" most experts believe we need 70% to 85% of the total population fully vaccinated (or already had COVID).
The following 19 states have between 50% and 59.9% fully vaccinated: New Jersey at 59.9%, New Hampshire, Washington, New York State, New Mexico, Oregon, District of Columbia, Virginia, Colorado, Minnesota, Hawaii, California, Delaware, Pennsylvania, Wisconsin, and Nebraska, Florida and Iowa all at 50.6%.
Next up (total population, fully vaccinated according to CDC) are Illinois at 49.9%, Michigan at 49.6%, South Dakota at 48.0, Ohio at 47.4%, Kentucky at 46.9%, Arizona at 46.6%, Kansas at 46.6%, Alaska at 46.3%, Nevada at 46.0% and Utah at 45.8%.
 Click on graph for larger image.
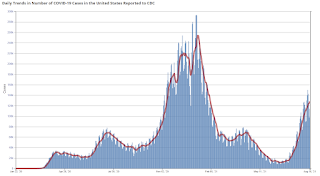
This graph shows the daily (columns) and 7 day average (line) of positive tests reported.
The 7-day average cases is the highest since February 5th.
The 7-day average hospitalizations is the highest since February 11th.
The 7-day average deaths is the highest since May 14th.
This data is from the CDC.
According to the CDC, on Vaccinations.
Total doses administered: 357,894,995, as of a week ago 352,550,944. Average doses last week: 0.76 million per day.
| COVID Metrics | ||||
|---|---|---|---|---|
| Today | Yesterday | Week Ago | Goal | |
| Percent fully Vaccinated | 50.9% | 50.8% | 50.3% | ≥70.0%1 |
| Fully Vaccinated (millions) | 168.9 | 168.7 | 166.9 | ≥2321 |
| New Cases per Day3🚩 | 128,347 | 125,036 | 112,259 | ≤5,0002 |
| Hospitalized3🚩 | 72,874 | 71,266 | 57,307 | ≤3,0002 |
| Deaths per Day3🚩 | 553 | 547 | 501 | ≤502 |
| 1 Minimum to achieve "herd immunity" (estimated between 70% and 85%). 2my goals to stop daily posts, 37 day average for Cases, Currently Hospitalized, and Deaths 🚩 Increasing 7 day average week-over-week for Cases, Hospitalized, and Deaths ✅ Goal met. | ||||
IMPORTANT: For "herd immunity" most experts believe we need 70% to 85% of the total population fully vaccinated (or already had COVID).
KUDOS to the residents of the 6 states that have achieved 60% of total population fully vaccinated: Vermont at 67.1%, Massachusetts, Maine, Connecticut, Rhode Island and Maryland.
The following 19 states have between 50% and 59.9% fully vaccinated: New Jersey at 59.9%, New Hampshire, Washington, New York State, New Mexico, Oregon, District of Columbia, Virginia, Colorado, Minnesota, Hawaii, California, Delaware, Pennsylvania, Wisconsin, and Nebraska, Florida and Iowa all at 50.6%.
Next up (total population, fully vaccinated according to CDC) are Illinois at 49.9%, Michigan at 49.6%, South Dakota at 48.0, Ohio at 47.4%, Kentucky at 46.9%, Arizona at 46.6%, Kansas at 46.6%, Alaska at 46.3%, Nevada at 46.0% and Utah at 45.8%.
 Click on graph for larger image.
This graph shows the daily (columns) and 7 day average (line) of positive tests reported.
This data is from the CDC.


