 RSS Feed
 by Calculated Risk on 6/21/2021 10:57:00 AM
Monday, June 21, 2021
Housing Inventory June 21st Update: Inventory Increased Week-over-week
One of the key questions for 2021 is: Will inventory increase as the pandemic subsides, or will inventory decrease further in 2021?
Tracking inventory will be very important this year.
 Click on graph for larger image in graph gallery.
This inventory graph is courtesy of Altos Research.
As of June 18th, inventory was at 353 thousand (7 day average), compared to 690 thousand the same week a year ago. That is a decline of 48.8%.
A week ago, inventory was at 342 thousand, and was down 51.0% YoY.
Seasonally, inventory has bottomed. Inventory was about 15.3% above the low in early April.
Mike Simonsen discusses this data regularly on Youtube.
Seven High Frequency Indicators for the Economy
by Calculated Risk on 6/21/2021 08:09:00 AM
These indicators are mostly for travel and entertainment. It will interesting to watch these sectors recover as the pandemic subsides.
The TSA is providing daily travel numbers.
 Click on graph for larger image.
This data shows the seven day average of daily total traveler throughput from the TSA for 2019 (Light Blue), 2020 (Blue) and 2021 (Red).
The dashed line is the percent of 2019 for the seven day average.
This data is as of June 20th.
The seven day average is down 27.0% from the same day in 2019 (73.0% of 2019). (Dashed line)
There was a slow increase from the bottom - and TSA data has picked up in 2021.
The second graph shows the 7 day average of the year-over-year change in diners as tabulated by OpenTable for the US and several selected cities.
IMPORTANT: OpenTable notes: "we’ve updated the data including downloadable dataset from January 1, 2021 onward to compare seated diners from 2021 to 2019, as opposed to year over year." Thanks!
 Thanks to OpenTable for providing this restaurant data:
This data is updated through June 19, 2021.
This data is "a sample of restaurants on the OpenTable network across all channels: online reservations, phone reservations, and walk-ins. For year-over-year comparisons by day, we compare to the same day of the week from the same week in the previous year."
Note that this data is for "only the restaurants that have chosen to reopen in a given market". Since some restaurants have not reopened, the actual year-over-year decline is worse than shown.
Dining picked up during the holidays, then slumped with the huge winter surge in cases. Dining is picking up again, and was only down 11% in US (7-day average compared to 2019). Florida and Texas are above 2019 levels.
----- Movie Tickets: Box Office Mojo -----
 This data shows domestic box office for each week and the median for the years 2016 through 2019 (dashed light blue).
 Thanks to OpenTable for providing this restaurant data:
This data is updated through June 19, 2021.
This data is "a sample of restaurants on the OpenTable network across all channels: online reservations, phone reservations, and walk-ins. For year-over-year comparisons by day, we compare to the same day of the week from the same week in the previous year."
Note that this data is for "only the restaurants that have chosen to reopen in a given market". Since some restaurants have not reopened, the actual year-over-year decline is worse than shown.
Dining picked up during the holidays, then slumped with the huge winter surge in cases. Dining is picking up again, and was only down 11% in US (7-day average compared to 2019). Florida and Texas are above 2019 levels.
 This data shows domestic box office for each week and the median for the years 2016 through 2019 (dashed light blue).
 Blue is 2020 and Red is 2021.
The data is from BoxOfficeMojo through June 17th.
Note that the data is usually noisy week-to-week and depends on when blockbusters are released.
Movie ticket sales were at $88 million last week, down about 66 from the median for the week.
Note that the data is usually noisy week-to-week and depends on when blockbusters are released.
Movie ticket sales were at $88 million last week, down about 66 from the median for the week.
 This graph shows the seasonal pattern for the hotel occupancy rate using the four week average.
 The red line is for 2021, black is 2020, blue is the median, dashed purple is 2019, and dashed light blue is for 2009 (the worst year on record for hotels prior to 2020).
Occupancy is now above the horrible 2009 levels and weekend occupancy (leisure) has been solid.
This data is through June 12th. Hotel occupancy is currently down 10% compared to same week in 2019). Note: Occupancy was up year-over-year, since occupancy declined sharply at the onset of the pandemic. However, the 4-week average occupancy is still down from normal levels.
Notes: Y-axis doesn't start at zero to better show the seasonal change.
 This graph, based on weekly data from the U.S. Energy Information Administration (EIA), shows gasoline supplied compared to the same week of 2019.
Blue is for 2020. Red is for 2021.
As of June 11th, gasoline supplied was down about 5.7% (about 94.3% of the same week in 2019).
Three weeks ago was the first week this year with gasoline supplied up compared to the same week in 2019.
This graph is from Apple mobility. From Apple: "This data is generated by counting the number of requests made to Apple Maps for directions in select countries/regions, sub-regions, and cities." This is just a general guide - people that regularly commute probably don't ask for directions.
There is also some great data on mobility from the Dallas Fed Mobility and Engagement Index. However the index is set "relative to its weekday-specific average over January–February", and is not seasonally adjusted, so we can't tell if an increase in mobility is due to recovery or just the normal increase in the Spring and Summer.
 This data is through June 19th for the United States and several selected cities.
The graph is the running 7 day average to remove the impact of weekends.
IMPORTANT: All data is relative to January 13, 2020. This data is NOT Seasonally Adjusted. People walk and drive more when the weather is nice, so I'm just using the transit data.
According to the Apple data directions requests, public transit in the 7 day average for the US is at 95% of the January 2020 level and moving up.
Here is some interesting data on New York subway usage (HT BR).
 This graph is from Todd W Schneider. This is weekly data since 2015.
 Most weeks are between 30 and 35 million entries, and currently there are close to 13 million subway turnstile entries per week - and generally increasing.
This data is through Friday, June 18th.
Schneider has graphs for each borough, and links to all the data sources.
He notes: "Data updates weekly from the MTA’s public turnstile data, usually on Saturday mornings".
This data is through Friday, June 18th.
Schneider has graphs for each borough, and links to all the data sources.
He notes: "Data updates weekly from the MTA’s public turnstile data, usually on Saturday mornings".
Sunday, June 20, 2021
Sunday Night Futures
by Calculated Risk on 6/20/2021 08:45:00 PM
Weekend:
• Schedule for Week of June 20, 2021
• Homebuilder Comments in Mid-June: "Interest lists are shrinking slightly, Traffic down"
Monday:
• At 8:30 AM ET, Chicago Fed National Activity Index for May. This is a composite index of other data.
From CNBC: Pre-Market Data and Bloomberg futures S&P 500 are down 8 and DOW futures are down 63 (fair value).
Oil prices were up over the last week with WTI futures at $71.87 per barrel and Brent at $73.70 per barrel. A year ago, WTI was at $40, and Brent was at $42 - so WTI oil prices are UP about 75% year-over-year (oil prices collapsed at the beginning of the pandemic).
Here is a graph from Gasbuddy.com for nationwide gasoline prices. Nationally prices are at $3.05 per gallon. A year ago prices were at $2.14 per gallon, so gasoline prices are up $0.91 per gallon year-over-year.
June 20th COVID-19 New Cases, Vaccinations, Hospitalizations
by Calculated Risk on 6/20/2021 04:36:00 PM
Congratulations to the residents of Virginia on joining the 70% club! Go for 80%!!!
This data is from the CDC.
According to the CDC, on Vaccinations.
Total doses administered: 317,966,408, as of yesterday 317,117,797. Daily change: 0.85 million.
| COVID Metrics | ||||
|---|---|---|---|---|
| Today | Yesterday | Week Ago | Goal | |
| Percent over 18, One Dose | 65.4% | 65.3% | 64.4% | ≥70.0%1,2 |
| Fully Vaccinated (millions) | 149.7 | 149.1 | 143.9 | ≥1601 |
| New Cases per Day3,4 | 11,432 | 11,976 | 14,274 | ≤5,0002 |
| Hospitalized3 | 12,879 | 13,344 | 14,683 | ≤3,0002 |
| Deaths per Day3,4 | 284 | 284 | 350 | ≤502 |
| 1 America's Goal by July 4th, 2my goals to stop daily posts, 37 day average for Cases, Hospitalized, and Deaths 4Cases and Deaths updated Mon - Fri | ||||
KUDOS to the residents of the 15 states and D.C. that have already achieved the 70% goal: Vermont, Hawaii and Massachusetts are at 80%+, and Connecticut, New Jersey, Maine, Rhode Island, Pennsylvania, New Mexico, California, New Hampshire, Maryland, Washington, New York, Illinois, Virginia and D.C. are all over 70%.
Next up are Minnesota at 69.2%, Delaware at 68.9%, Oregon at 68.7%, Colorado at 68.7%, Wisconsin at 64.6%, Nebraska at 63.4%, and South Dakota at 63.4%.
 Click on graph for larger image.
This graph shows the daily (columns) and 7 day average (line) of positive tests reported.
This data is from the CDC.
Homebuilder Comments in Mid-June: "Interest lists are shrinking slightly, Traffic down"
by Calculated Risk on 6/20/2021 09:27:00 AM
Some twitter comments from Rick Palacios Jr., Director of Research at John Burns Real Estate Consulting:
Here's a housing Thread to chew on over weekend. Mid-June update from 100+home builders across country. 1) rumblings of price ceiling. 2) slightly shrinking pool of qualified buyers. 3) some home releases not selling out immediately. 4) normal summer slowing as vacations take priority.
#Austin builder: “Some interest lists are shrinking & others are not. Seeing buyers who are no longer able or willing to afford the monthly payment. Definitely seeing attrition here. Frustration that prices continued going up without an opportunity to purchase.”
#Dallas builder: “Interest lists are definitely shrinking because of pricing. Some drop off is happening due to price. But the re-sale market is still so tight it hasn’t dropped substantially. Extremely concerned about pricing going forward.”
#Houston builder: “Interest lists are shrinking slightly. Likely just too much price pressure. It's out of hand. Some buyers are unable or unwilling to afford the monthly payments now, but only what we see from the slight decrease in contracts. Price shock is certainly a factor.”
#Orlando builder: “Traffic & interest high, but waned a bit past 60 days. Higher end slowing faster, buyers under $400K stayed steady. Intentionally slowing sales pace (missing budgets). Fingers crossed market still there when we release.”
#Tampa builder: “Traffic down b/c little to sell until sold backlog reduced. Monthly allocations are gone within 7-10 days. Traffic weakening mostly w/out of state buyer."
#WestPalmBeach builder: “Traffic slowed. Not sure yet if market slowing or fact that we don’t have anything to sell. Probably bit of both. Takes more than a day or two to sell a unit. It was selling same day as release before, now pricing high enough that some people saying no.”
#Chicago builder: “Traffic slowed, ~50% of where it was in Q1 and beginning of Q2. Feels like seasonality, not sure. Last raised prices 1st week of June after 3 increases in May. Plan is to try & maintain from here. Felt some pushback & hesitancy.”
#Cleveland builder: “Traffic has slowed. Many people now taking vacations for first time in a long time. People pushing back from massive price increases we’ve had.”
#Indianapolis builder: “Traffic down somewhat from May, which was already down from prior months. Quality still good. Seeing some resistance overall to higher prices. Sales in June lightest we’ve seen in almost a year. Part of that is having no spec inventory available.”
#Minneapolis builder: “New traffic down but be-backs are consistent. Quality is good. No differences by buyer segment. Continuing to increase prices every 2-3 weeks as needed due to material price increases.”
#EastBay builder: “Traffic still good but aren’t seeing as many 1st time buyers coming in. Temporarily sold out at all communities. Raise prices w/each sales release. Getting appliances & exterior stone seem to be worst delays. Labor also a problem w/every trade.”
#Reno builder: “Traffic down slightly vs. this time last month, but school’s out & people taking vacations now. Investors are not taking vacations apparently & still very active. Continuing to increase prices & amount of increases are down slightly.”
#Sacramento builder: “Slowed a little due to business reopening from COVID, also this time of year tends to be busy w/graduations & vacations. Increasing prices every release.”
#Baltimore builder: “Traffic continues to be strong. All price points still have strong interest & increasing prices every few sales. Just starting to see price resistance especially those in the “middle” price ranges that no longer qualify for a mortgage.”
#Boston builder: “No differences in traffic. Still selling off waiting lists & taking sales office visits on appointment only. Continue to push price w/each release – haven’t reached resistance yet.”
#Philadelphia builder: “Traffic definitely slowed. Reduced advertising & promotions because sold out into next year.”
#WashingtonDC builder: “Traffic down, mostly due to increased pricing & caps on sales. Starting to see some people drop out due to rising costs, many entry level buyers. Still increasing prices but not as frequently or as high.”
#Seattle builder: “Traffic remains strong however, slowdown over Memorial Day weekend. Continuing to get multiple offers on limited monthly releases but number of offers are noticeably decreasing. Continuing to increase pricing each month but not as aggressively.”
#RiversideSanBernardino builder: “First week of June was good, however, this past week it appears that all of the potential buyers were taking vacations. Increasing prices slowly.”
#Atlanta builder: “Traffic remains strong. Seeing move up buyer w/school age children wanting inventory to close before school. Don’t have a lot of standing inventory so seeing more sales lost to resales. Still have price escalators in place.”
#Birmingham builder: “Still restricting sales. Traffic is good, however, prices are starting to affect buyers. Just did a price increase a week ago and it knocked 2 of 3 buyers out of writing contracts in one community.”
#Charleston builder: “Definitely felt a decline in traffic. Combination of people getting out & about/traveling w/restrictions lifted. Mortgage pre-qualification becoming more of a challenge. Have homes that sold as far back as last year that costs have eroded profit margins.”
#Charlotte builder: “Still capping sales each month based on availability. Raised prices in some of stronger communities where interest list was longest & had lots coming. Sales agents told me they didn’t hear back from some prospects after calls/emails with price increases.”
#Nashville builder: “Sales are extremely slow, by design, as restricting new contracts to inventory homes that have reached completed drywall stage. Increasing prices ~2% per month. IF we had inventory to sell, traffic & sales would be great."
#RaleighDurham builder: “Traffic down in June. Don’t have anything to really market for sale right now which has an effect on the drop in traffic. Sales are intentionally down again due to the cap in releases. We are not pricing homes until lumber is on site and framing begins.”
#Tucson builder: “Sales are showing some signs of slowing likely due to price increases. Raising prices across the board.”
#SaltLakeCity builder: “Traffic & demand still strong. Sales way down due to intentional price increases & limited homes released for sale. Continuing to raise prices at crazy high rates, w/most communities that are selling up 30%+ in less than a year.”
#Denver builder: “Basically stopped sales so far this month so we are at zero. Traffic is okay, but still really strong online traffic & interest. Still pushing pricing as costs keep rising, but it is pushing buyers out of the market.”
#Phoenix builder: “Traffic down. Could be due to seasonality, locations opening up, & people getting early starts to summer. Sales paces could be higher if we let them & continuing to push prices. Last week we received price increases from 6 different trades.”
#LasVegas builder: “Traffic still busy, no real drop. Sales still super healthy, although it seems going deeper into priority lists to sell on the higher end (some people have either taken themselves out of the market or have purchased elsewhere). Prices still rising.” END
Saturday, June 19, 2021
June 19th COVID-19 New Cases, Vaccinations, Hospitalizations
by Calculated Risk on 6/19/2021 06:06:00 PM
This data is from the CDC.
According to the CDC, on Vaccinations.
Total doses administered: 317,117,797, as of yesterday 316,048,776. Daily change: 1.07 million.
| COVID Metrics | ||||
|---|---|---|---|---|
| Today | Yesterday | Week Ago | Goal | |
| Percent over 18, One Dose | 65.3% | 65.1% | 64.3% | ≥70.0%1,2 |
| Fully Vaccinated (millions) | 149.1 | 148.5 | 143.1 | ≥1601 |
| New Cases per Day3,4 | 11,432 | 11,976 | 14,274 | ≤5,0002 |
| Hospitalized3 | 13,344 | 13,538 | 15,304 | ≤3,0002 |
| Deaths per Day3,4 | 284 | 284 | 350 | ≤502 |
| 1 America's Goal by July 4th, 2my goals to stop daily posts, 37 day average for Cases, Hospitalized, and Deaths 4Cases and Deaths updated Mon - Fri | ||||
KUDOS to the residents of the 15 states and D.C. that have already achieved the 70% goal: Vermont, Hawaii and Massachusetts are at 80%+, and Connecticut, New Jersey, Maine, Rhode Island, Pennsylvania, New Mexico, California, New Hampshire, Maryland, Washington, New York, Illinois and D.C. are all over 70%.
Next up are Virginia at 69.9%, Minnesota at 69.1%, Delaware at 68.9%, Oregon at 68.6%, Colorado at 68.6%, Wisconsin at 64.5%, Nebraska at 63.4%, and South Dakota at 63.4%.
Click on graph for larger image.This graph shows the daily (columns) and 7 day average (line) of positive tests reported.
This data is from the CDC.
Schedule for Week of June 20, 2021
by Calculated Risk on 6/19/2021 08:11:00 AM
The key reports this week are the third estimate of Q1 GDP, May New and Existing Home Sales, and Personal Income and Outlays for May.
For manufacturing, the June Richmond and Kansas City Fed manufacturing surveys will be released.
8:30 AM ET: Chicago Fed National Activity Index for May. This is a composite index of other data.
 10:00 AM: Existing Home Sales for May from the National Association of Realtors (NAR). The consensus is for 5.72 million SAAR, down from 5.85 million.
The graph shows existing home sales from 1994 through the report last month.
Housing economist Tom Lawler expects the NAR to report sales of 5.78 million SAAR for May.
10:00 AM: Richmond Fed Survey of Manufacturing Activity for June.
2:00 PM: Testimony, Fed Chair Jerome Powell, The Federal Reserve's Response to the Coronavirus Pandemic, Before the Select Subcommittee on Coronavirus Crisis, U.S. House of Representatives
7:00 AM ET: The Mortgage Bankers Association (MBA) will release the results for the mortgage purchase applications index.
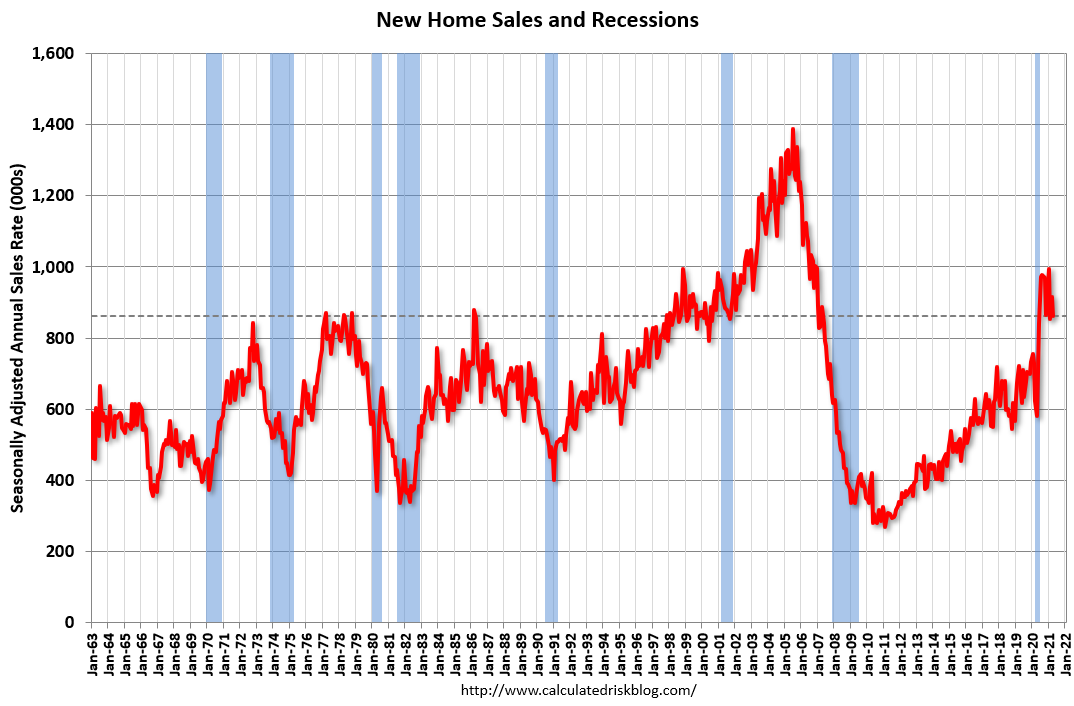 10:00 AM: New Home Sales for May from the Census Bureau.
 This graph shows New Home Sales since 1963. The dashed line is the sales rate for last month.
The consensus is for 880 thousand SAAR, up from 863 thousand in April.
During the day: The AIA's Architecture Billings Index for May (a leading indicator for commercial real estate).
8:30 AM: The initial weekly unemployment claims report will be released. The consensus is for a decrease to 390 thousand from 412 thousand last week.
8:30 AM: Durable Goods Orders for May from the Census Bureau. The consensus is for a 3.0% increase in durable goods orders.
8:30 AM: Gross Domestic Product, 1st quarter 2020 (Third estimate). The consensus is that real GDP increased 6.4% annualized in Q1, unchanged from the second estimate of a 6.4% increase.
11:00 AM: the Kansas City Fed manufacturing survey for June. This is the last of regional manufacturing surveys for June.
4:30 PM: Federal Reserve releases 2021 bank stress tests results
8:30 AM ET: Personal Income and Outlays, May 2021. The consensus is for a 2.5 decrease in personal income, and for a 0.3% increase in personal spending. And for the Core PCE price index to increase 0.6% (3.4% YoY).
10:00 AM: University of Michigan's Consumer sentiment index (Final for June). The consensus is for a reading of 86.8.
Friday, June 18, 2021
The Housing Conundrum
by Calculated Risk on 6/18/2021 02:50:00 PM
I've seen several housing booms and busts in my life. The biggest boom was the housing bubble in the mid-'00s, and the worst bust followed the bubble. Booms and bust have always been frequent in real estate.
My Spidey senses are tingling again, however it isn't obvious why this time - or what the outcome will be.
In general, demographics are very favorable for home buying. In Housing and Demographics: The Next Big Shift, I presented these graphs:
 Click on graph for larger image.
This graph shows the longer term trend for three key age groups: 20 to 29, 25 to 34, and 30 to 39 (the groups overlap).
This graph is from 1990 to 2060 (all data from BLS: current to 2060 is projected).
We can see the surge in the 20 to 29 age group last decade (red). Once this group exceeded the peak in earlier periods, there was an increase in apartment construction. This age group peaked in 2018 / 2019 (until the 2030s), and the 25 to 34 age group (orange, dashed) will peak around 2023.
For buying, the 30 to 39 age group (blue) is important (note: see Demographics and Behavior for some reasons for changing behavior). The population in this age group is increasing, and will increase further over this decade.
The current demographics are now very favorable for home buying - and will remain positive for most of the decade.
And on the supply side for demographics:
 This graph shows the longer term trend for two key age groups: 60 to 79, and 80+.
This graph is from 2010 to 2060 (all data from BLS: current to 2060 is projected).
The next big housing shift will be when the Baby Boom generation starts to downsize and move to retirement communities. No cohort is monolithic - some people will age-in-place until they pass away, others will move in with family (or family will move in with their parents), and some will move to retirement communities.
There is no magic age that people reach and start to transition, but looking at prior generations, it seems to start when people are around 80 years old.
The leading edge of the Baby Boom generation is currently 75 (born in 1946), and these people will be turning 80 in 2026.
The peak of the boomers will be turning 80 in 2035 or so, and the tail end turning 80 in 2044 (born in 1964).
My sense is there will be a pickup in Boomers selling their homes in the 2nd half of the 2020s and lasting until 2040 or so.
However, we also have to note that demographics have been dismal recently. Housing economist Tom Lawler send me a note yesterday that was a follow-up to his previous email Lawler: Update on the Dismal Demographics of 2020; "Smallest Population increase since 1918"
Provisional data from the CDC suggest that from April 1 of last year to April 1 of this year the so-called “natural” increase in the US population was barely positive. Provisional data show US births over the 12 month period ending March 2021 at 3.565 million, and US deaths over that period at 3.521 million.Another positive for the housing market is the near record low mortgage rates.
 This graph from MortgageNewsDaily shows the 30 year mortgage rate since 1971.
Currently 30 year rates are around 3.25%, up from around 2.75% last year, but still near record lows.
And lending standards have been fairly solid, although there has been some loosening in recent years - like increases in allowable DTI (debt-to-income ratio). Delinquencies are low (not counting loans in forbearance due to the pandemic).
And we haven't seen a huge increase in equity extraction, meaning that most homeowners have substantial equity in their homes (so even if prices decline, there won't be cascading price declines).
And housing inventory is near record lows. In Some thoughts on Housing Inventory, I outlined some of the reasons why inventory is so low.
With solid demographics, low mortgage rates, and record low inventory, it is no surprise that house prices are increasing rapidly.
 This graph below shows existing home months-of-supply (inverted, from the NAR) vs. the seasonally adjusted month-to-month price change in the Case-Shiller National Index (both since January 1999 through March 2021).
There is a clear relationship, and this is no surprise (but interesting to graph). If months-of-supply is high, prices decline. If months-of-supply is very low (like now), prices rise quickly.
In March, the months-of-supply was at 2.1 months, and the Case-Shiller National Index (SA) increased 1.5% month-over-month (a month-over-month record). The black arrow points to the March dot.
In the April existing home sales report released last month, the NAR reported months-of-supply increased to 2.4 month in April. There is a seasonal pattern to inventory, but this is still very low - and prices are increasing sharply.
In the April existing home sales report released last month, the NAR reported months-of-supply increased to 2.4 month in April. There is a seasonal pattern to inventory, but this is still very low - and prices are increasing sharply.
So why the concern?
 Here is a similar graph using the Case-Shiller National and Composite 20 House Price Indexes.
This graph shows the price to rent ratio (January 2000 = 1.0). This suggested prices were way too high during the housing bubble, and also suggests prices might be high now - but not as high as the housing bubble.
If we factor in low rates, demographics, and if low supply persists (I think inventory will increase this year), maybe prices are only a little out of line.
Here is another measure - house prices to the Median Household income.
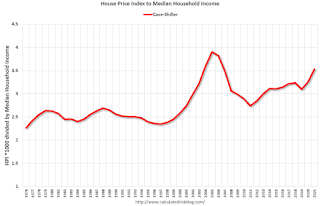 This graph uses the year end Case-Shiller house price index - and the nominal median household income through 2020 (from the Census Bureau). 2021 median income is estimated at a 5% gain.
This graph shows the ratio of house price indexes divided by the Median Household Income through 2021 (the HPI is first multiplied by 1000).
This uses the year end National Case-Shiller index since 1976 (2021 estimated).
House price appear elevated relative to incomes, but still well below the levels of the housing bubble.
In 2012, housing economist Tom Lawler dug through some data and calculated that real prices increased 0.83% per year (See: Lawler: On the upward trend in Real House Prices)
In my previous posts, I tracked the bottom of real prices over time. This graph shows the peaks over time (the trend lines are 0.83% and 1.1%).
 This graph shows there have been four surges in real prices since the early '70s. One in the late '70s, one in the late '80s, the housing bubble, and the current surge in prices.
It is important to note that nationally nominal house prices did not decline following the surges in the '70s and '80s. However, there were regional declines.
Since homeowners are concerned about nominal prices (not real prices), I wasn't concerned in December 2018, when Professor Shiller wrote in the NY Times: The Housing Boom Is Already Gigantic. How Long Can It Last?
Here were my comments on Shiller's article in 2018:
During the housing bubble, the difference between a slight upward slope in real prices (0.2% per year according to Shiller's index) and a slightly larger increase in real prices using other indexes (probably between 1% and 1.5% per year) didn't make any difference; there was obviously a huge bubble in house prices. But when comparing price "booms" over time, there is a huge difference.
If we use 1.5% per year for real price increases, the current "boom" in prices would be the fourth largest since the 1970s (and only about half the size of the late '70s and late '80s price boom), and if we use a 1.0% real increase, the current "boom" is on the same order as the late '70s and '80s price booms.
No big deal, and definitely not a "gigantic" boom in house prices.
Since I wrote that post in 2018, house prices have increased 19% nationally (from November 2018 to March 2021) according to the Case-Shiller index. Prices in Phoenix are up 31%, and in Seattle and San Diego, up about 26% since that Shiller article was written.
And prices are still increasing quickly.
Now, I'd argue house prices are too high based on historical fundamentals. I wouldn't call this a "bubble" because of the lack of both speculation and loose lending (see: Is there a New Housing Bubble?). But I am concerned about house prices.
Now, I'd argue house prices are too high based on historical fundamentals. I wouldn't call this a "bubble" because of the lack of both speculation and loose lending (see: Is there a New Housing Bubble?). But I am concerned about house prices.
And there doesn't appear to be any end in sight to the sharp increases in house prices. Goldman Sachs economists' model is projecting double digit price gain in 2021 and 2022:
Strong demand for housing looks sustainable. Even before the pandemic, demographic tailwinds and historically-low mortgage rates had pushed demand to high levels. ... consumer surveys indicate that household buying intentions are now the highest in 20 years. ... mortgage lending standards have remained fairly tight. With demographic trends still strong, mortgage rates very low, housing affordability still high, and household wealth as a share of income at the highest level in US history, demand should remain strong.The recent price increases make sense from a supply and demand perspective, but prices do seem too high. And I suppose the frenzy is bothering me.
The supply picture offers no quick fixes to the shortage of available homes ... The resulting picture is one of a persistent supply-demand imbalance in the years ahead. ... [Our] model suggests that rising prices will only gradually reduce affordability enough to dampen demand and mitigate the supply-demand imbalance. As a result, the model projects double-digit price gains both this year and next.
June 18th COVID-19 New Cases, Vaccinations, Hospitalizations
by Calculated Risk on 6/18/2021 02:44:00 PM
This data is from the CDC.
According to the CDC, on Vaccinations.
Total doses administered: 316,048,776, as of yesterday 314,969,386. Daily change: 1.08 million.
| COVID Metrics | ||||
|---|---|---|---|---|
| Today | Yesterday | Week Ago | Goal | |
| Percent over 18, One Dose | 65.1% | 65.0% | 64.1% | ≥70.0%1,2 |
| Fully Vaccinated (millions) | 148.5 | 147.8 | 142.1 | ≥1601 |
| New Cases per Day3 | 11,432 | 11,976 | 14,274 | ≤5,0002 |
| Hospitalized3 | 13,538 | 13,826 | 15,717 | ≤3,0002 |
| Deaths per Day3 | 284 | 284 | 350 | ≤502 |
| 1 America's Goal by July 4th, 2my goals to stop daily posts, 37 day average for Cases, Hospitalized, and Deaths | ||||
KUDOS to the residents of the 15 states and D.C. that have already achieved the 70% goal: Vermont, Hawaii and Massachusetts are at 80%+, and Connecticut, New Jersey, Maine, Rhode Island, Pennsylvania, New Mexico, California, New Hampshire, Maryland, Washington, New York, Illinois and D.C. are all over 70%.
Next up are Virginia at 69.8%, Minnesota at 69.0%, Delaware at 68.8%, Oregon at 68.5%, Colorado at 68.4%, Wisconsin at 64.4%, Nebraska at 63.4%, and South Dakota at 63.4%.
Click on graph for larger image.This graph shows the daily (columns) and 7 day average (line) of positive tests reported.
This data is from the CDC.
Q2 GDP Forecasts: Around 10%
by Calculated Risk on 6/18/2021 11:33:00 AM
From Merrill Lynch:
Retail sales boosted our 2Q GDP tracking estimate up to 11% qoq saar from 9.5% previously. [June 18 estimate]From Goldman Sachs:
emphasis added
We left our Q2 GDP tracking estimate unchanged at +9.0% (qoq ar). [June 16 estimate]From the NY Fed Nowcasting Report
The New York Fed Staff Nowcast stands at 3.7% for 2021:Q2 and 4.4% for 2021:Q3. [June 18 estimate]And from the Altanta Fed: GDPNow
The GDPNow model estimate for real GDP growth (seasonally adjusted annual rate) in the second quarter of 2021 is 10.3 percent on June 16, down from 10.5 percent on June 15. [June 16 estimate]


