 RSS Feed
 by Calculated Risk on 4/30/2021 12:19:00 PM
Friday, April 30, 2021
Early Q2 GDP Forecasts: 10%
From Goldman Sachs:
We launched our Q2 GDP tracking estimate at +10.5% (qoq ar). [Apr 30 estimate]From the NY Fed Nowcasting Report
emphasis added
The New York Fed Staff Nowcast stands at 5.3% for 2021:Q2. [Apr 30 estimate]And from the Altanta Fed: GDPNow
The GDPNow model estimate for real GDP growth (seasonally adjusted annual rate) in the second quarter of 2021 is 10.4 percent on April 30. [Apr 30 estimate]
Real Personal Income less Transfer Payments
by Calculated Risk on 4/30/2021 10:29:00 AM
Government transfer payments increased sharply in March compared to February, and were $4.8 trillion (on SAAR basis) above the February 2020 level (pre-pandemic). Most of the increase in transfer payments - compared to the levels prior to the crisis - is from unemployment insurance and "other" (includes direct payments).
This table shows the amount of unemployment insurance and "Other" transfer payments since February 2020 (pre-crisis level). The increase in "Other" was mostly due to parts of the relief acts including direct payments.
There was a large increase in "Other" in March due to the American Rescue Plan Act.
A key measure of the health of the economy (Used by NBER in recession dating) is Real Personal Income less Transfer payments.
 Click on graph for larger image.
This graph shows real personal income less transfer payments since 1990.
This measure of economic activity increased 0.9% in March, compared to February, and was down 1.2% compared to February 2020 (previous peak).
 Another way to look at this data is as a percent of the previous peak.
Real personal income less transfer payments was off 8.1% in April 2020. That was a larger decline than the worst of the great recession.
Currently personal income less transfer payments are still off 1.2% (dashed line).
| Selected Transfer Payments Billions of dollars, SAAR | ||
|---|---|---|
| Other | Unemployment Insurance | |
| Feb-20 | $506 | $28 |
| Mar-20 | $515 | $74 |
| Apr-20 | $3,379 | $493 |
| May-20 | $1,360 | $1,356 |
| Jun-20 | $758 | $1,405 |
| Jul-20 | $760 | $1,331 |
| Aug-20 | $692 | $636 |
| Sep-20 | $936 | $359 |
| Oct-20 | $732 | $304 |
| Nov-20 | $620 | $281 |
| Dec-20 | $654 | $304 |
| Jan-21 | $2,357 | $556 |
| Feb-21 | $782 | $535 |
| Mar-21 | $4,751 | $541 |
A key measure of the health of the economy (Used by NBER in recession dating) is Real Personal Income less Transfer payments.
 Click on graph for larger image.
This graph shows real personal income less transfer payments since 1990.
This measure of economic activity increased 0.9% in March, compared to February, and was down 1.2% compared to February 2020 (previous peak).
 Another way to look at this data is as a percent of the previous peak.
Real personal income less transfer payments was off 8.1% in April 2020. That was a larger decline than the worst of the great recession.
Currently personal income less transfer payments are still off 1.2% (dashed line).
Black Knight: Number of Homeowners in COVID-19-Related Forbearance Plans Increased Slightly
by Calculated Risk on 4/30/2021 10:10:00 AM
Note: Both Black Knight and the MBA (Mortgage Bankers Association) are putting out weekly estimates of mortgages in forbearance.
This data is as of April 27th.
From Black Knight: A Jump in Portfolio/Pls Forbearances Breaks Eight-Week Improvement Streak
New data from our McDash Flash Forbearance Tracker showed an increase in forbearance volumes for the first time in nine weeks. Mid-month increases have been relatively common in recent months, and despite the 20,000 weekly increase in forbearance plans, plan volumes are still down 228,000 (-8.9%) from the same time last month.
We saw continued improvement among GSE (-9,000) and FHA/VA forbearances (-2,000), but these decreases were more than offset by an increase of 31,000 forbearance plans among portfolio-held and privately securitized mortgages.
Click on graph for larger image.
More than 200,000 plans are still set to expire in April. With less than a week remaining in the month, the opportunity still remains for additional improvement in late April/early May. As of April 27, there are 2.33 million (4.4% of) homeowners in COVID-19 related forbearance plans, including 2.6% of GSE, 7.8% of FHA/VA and 5% of portfolio/PLS loans.
With the large amount of plans up for review in the next week, it’ll be worth watching these numbers going into May. We’ll have another update here on our blog next Friday, May 7.
emphasis added

Personal Income increased 21.1% in March, Spending increased 4.2%
by Calculated Risk on 4/30/2021 08:36:00 AM
The BEA released the Personal Income and Outlays report for March:
Personal income increased $4.21 trillion (21.1 percent) in March according to estimates released today by the Bureau of Economic Analysis. Disposable personal income (DPI) increased $4.18 trillion (23.6 percent) and personal consumption expenditures (PCE) increased $616.0 billion (4.2 percent).The March PCE price index increased 2.3 percent year-over-year and the March PCE price index, excluding food and energy, increased 1.8 percent year-over-year.
Real DPI increased 23.0 percent in March and Real PCE increased 3.6 percent; goods increased 7.3 percent and services increased 1.7 percent. The PCE price index increased 0.5 percent. Excluding food and energy, the PCE price index increased 0.4 percent .
emphasis added
The following graph shows real Personal Consumption Expenditures (PCE) through March 2021 (2012 dollars). Note that the y-axis doesn't start at zero to better show the change.
 Click on graph for larger image.
The dashed red lines are the quarterly levels for real PCE.
Personal income was slightly above expectations (boosted by American Rescue Act), and the increase in PCE was at expectations.
Thursday, April 29, 2021
Friday: Personal Income and Outlays
by Calculated Risk on 4/29/2021 09:00:00 PM
Friday:
• At 8:30 AM ET, Personal Income and Outlays, March 2021. The consensus is for a 20.1% increase in personal income, and for a 4.2% increase in personal spending. And for the Core PCE price index to increase 0.3%.
• At 9:45 AM, Chicago Purchasing Managers Index for April.
• At 10:00 AM, University of Michigan's Consumer sentiment index (Final for April). The consensus is for a reading of 87.5.
Freddie Mac: Mortgage Serious Delinquency Rate decreased in March
by Calculated Risk on 4/29/2021 05:51:00 PM
Freddie Mac reported that the Single-Family serious delinquency rate in March was 2.34%, down from 2.52% in February. Freddie's rate is up from 0.60% in March 2020.
Freddie's serious delinquency rate peaked in February 2010 at 4.20% following the housing bubble, and peaked at 3.17% in August 2020 during the pandemic.
These are mortgage loans that are "three monthly payments or more past due or in foreclosure".
 Click on graph for larger image
Mortgages in forbearance are being counted as delinquent in this monthly report, but they will not be reported to the credit bureaus.
This is very different from the increase in delinquencies following the housing bubble. Lending standards have been fairly solid over the last decade, and most of these homeowners have equity in their homes - and they will be able to restructure their loans once (if) they are employed.
Also - for multifamily - delinquencies were at 0.17%, up from 0.14% in February, and up more than double from 0.08% in March 2020.
April 29th COVID-19 Vaccinations, New Cases, Hospitalizations; Lowest 7-Day Average New Cases Since October 2020
by Calculated Risk on 4/29/2021 03:49:00 PM
Note: I'm looking forward to not posting this daily! I've been posting this data daily for over a year, and I'll stop once all three of these criteria are met:
1) 70% of the population over 18 has had at least one dose of vaccine, and
2) new cases are under 5,000 per day, and
3) hospitalizations are below 3,000.
According to the CDC, 237.4 million doses have been administered. 38.4% of the population over 18 is fully vaccinated, and 54.9% of the population over 18 has had at least one dose (141.8 million people over 18 have had at least one dose).
And check out COVID Act Now to see how each state is doing.
Over 18,500 US deaths were reported so far in April due to COVID.
 Click on graph for larger image.
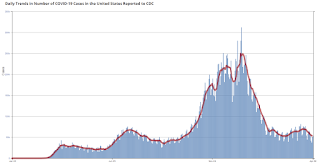
This graph shows the daily (columns) 7 day average (line) of positive tests reported.
Note: The ups and downs during the Winter surge were related to reporting delays due to the Thanksgiving and Christmas holidays.
This data is from the CDC.
 Click on graph for larger image.
This graph shows the daily (columns) 7 day average (line) of positive tests reported.
Note: The ups and downs during the Winter surge were related to reporting delays due to the Thanksgiving and Christmas holidays.
This data is from the CDC.
The 7-day average is 52,528, down from 54,010 yesterday, and down from the recent peak of 69,881 on April 13, 2021. This is the lowest since October 12, 2020, but well above the post-summer surge low of 34,668.
The second graph shows the number of people hospitalized.
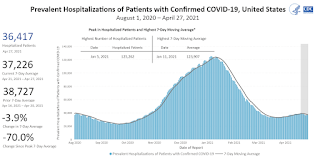 This data is also from the CDC.
The CDC cautions that due to reporting delays, the area in grey will probably increase.
The second graph shows the number of people hospitalized.
 This data is also from the CDC.
The CDC cautions that due to reporting delays, the area in grey will probably increase.
The current 7-day average is 37,226, down from 37,606 reported yesterday, and well above the post-summer surge low of 23,000.
Hotels: Occupancy Rate Down 17% Compared to Same Week in 2019
by Calculated Risk on 4/29/2021 01:02:00 PM
Note: The year-over-year occupancy comparisons are easy, since occupancy declined sharply at the onset of the pandemic. However, occupancy is still down significantly from normal levels.
The occupancy rate is down 17% compared to the same week in 2019.
From CoStar: STR: US Weekly Hotel Occupancy Flat From Prior Week
U.S. weekly hotel occupancy remained flat from the previous week, according to STR‘s latest data through April 24.The following graph shows the seasonal pattern for the hotel occupancy rate using the four week average.
April 18-24, 2021:
• Occupancy: 57.3%
• Average daily rate (ADR): US$108.10
• Revenue per available room (RevPAR): US$61.93
Overall industry occupancy will likely remain plateaued until the summer leisure travel boom, but there has been noticeable uptick in weekday occupancy, which is indicative of increased business travel. ADR was up slightly from the previous week, and the Luxury, Midscale and Economy classes have each recovered more than 90% of their 2019 ADR levels.
emphasis added
 Click on graph for larger image.
The red line is for 2021, black is 2020, blue is the median, and dashed light blue is for 2009 (the worst year on record for hotels prior to 2020).
Occupancy is now slightly above the horrible 2009 levels.
Note: Y-axis doesn't start at zero to better show the seasonal change.
Note: Y-axis doesn't start at zero to better show the seasonal change.
A Few Comments on Q1 GDP
by Calculated Risk on 4/29/2021 11:36:00 AM
Earlier from the BEA: Gross Domestic Product, First Quarter 2021 (Advance Estimate)
Real gross domestic product (GDP) increased at an annual rate of 6.4 percent in the first quarter of 2021, according to the "advance" estimate released by the Bureau of Economic Analysis. In the fourth quarter of 2020, real GDP increased 4.3 percent.On a Q1-over-Q1 basis, GDP was up 0.4%.
emphasis added
 Click on graph for larger image.
This graph shows the percent decline in real GDP from the previous peak (currently the previous peak was in Q4 2019).
This graph is through Q1 2021, and real GDP is currently off 0.9% from the previous peak.
The advance Q1 GDP report, at 6.4% annualized, was slightly below expectations, largely due to a decline in private inventories.
Personal consumption expenditures (PCE) increased at a 10.7% annualized rate in Q1, due, in part, to the American Rescue Plan Act.
The second graph below shows the contribution to GDP from residential investment, equipment and software, and nonresidential structures (3 quarter trailing average). This is important to follow because residential investment tends to lead the economy, equipment and software is generally coincident, and nonresidential structure investment trails the economy.
In the graph, red is residential, green is equipment and software, and blue is investment in non-residential structures. So the usual pattern - both into and out of recessions is - red, green, blue.
Of course - with the sudden economic stop due to COVID-19 - the usual pattern doesn't apply.
The dashed gray line is the contribution from the change in private inventories.
 Residential investment (RI) increased at a 10.8% annual rate in Q1.
Equipment investment increased at a 16.7% annual rate, and investment in
non-residential structures decreased at a 4.8% annual rate (after getting crushed over the previous year)..
Residential investment (RI) increased at a 10.8% annual rate in Q1.
Equipment investment increased at a 16.7% annual rate, and investment in
non-residential structures decreased at a 4.8% annual rate (after getting crushed over the previous year)..The contribution to Q1 GDP from investment in private inventories was -2.64 percentage points (this will likely be a positive for Q2).
On a 3 quarter trailing average basis, RI (red) is up solidly, equipment (green) is also up solidly, and nonresidential structures (blue) is down.
On a 3 quarter trailing average basis, RI (red) is up solidly, equipment (green) is also up solidly, and nonresidential structures (blue) is down.
I'll post more on the components of non-residential investment once the
supplemental data is released.
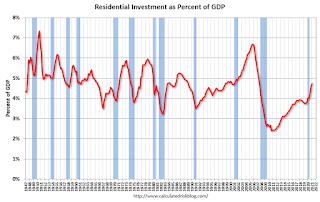 The second graph shows residential investment as a percent of GDP.
Residential Investment as a percent of GDP increased in Q1.
I'll break down Residential Investment into components after the GDP details are released.
Note: Residential investment (RI) includes new single family structures, multifamily structures, home improvement, broker's commissions, and a few minor categories.
 The third graph shows non-residential investment in
structures, equipment and "intellectual property products".
The third graph shows non-residential investment in
structures, equipment and "intellectual property products".
Investment in non-residential structures declined in Q1 as a percent GDP, and will probably be weak for some time (hotel occupancy is still low, office and mall vacancy rates are high).
NAR: Pending Home Sales Increased 1.9% in March
by Calculated Risk on 4/29/2021 10:03:00 AM
From the NAR: Pending Home Sales Grow 1.9% in March
Pending home sales increased in March, snapping two consecutive months of declines, according to the National Association of Realtors®. All but one of the four major U.S. regions experienced month-over-month gains in March, while each area recorded year-over-year growth.This was below expectations for this index. Note: Contract signings usually lead sales by about 45 to 60 days, so this would usually be for closed sales in April and May.
The Pending Home Sales Index (PHSI), a forward-looking indicator of home sales based on contract signings, rose 1.9% to 111.3 in March. Year-over-year, contract signings jumped 23.3%, with the difference due in large part to the pandemic-induced lockdown in March 2020. An index of 100 is equal to the level of contract activity in 2001.
...
The Northeast PHSI rose 6.1% to 97.9 in March, a 16.7% increase from a year ago. In the Midwest, the index fell 3.7% to 98.6 last month, up 14.1% from March 2020.
Pending home sales transactions in the South jumped 2.9% to an index of 137.2 in March, up 27.9% from March 2020. The index in the West grew 2.9% in March to 94.5, up 29.8% from a year prior.
emphasis added


