 RSS Feed
 by Calculated Risk on 4/29/2021 11:36:00 AM
Thursday, April 29, 2021
A Few Comments on Q1 GDP
Earlier from the BEA: Gross Domestic Product, First Quarter 2021 (Advance Estimate)
Real gross domestic product (GDP) increased at an annual rate of 6.4 percent in the first quarter of 2021, according to the "advance" estimate released by the Bureau of Economic Analysis. In the fourth quarter of 2020, real GDP increased 4.3 percent.On a Q1-over-Q1 basis, GDP was up 0.4%.
emphasis added
 Click on graph for larger image.
This graph shows the percent decline in real GDP from the previous peak (currently the previous peak was in Q4 2019).
This graph is through Q1 2021, and real GDP is currently off 0.9% from the previous peak.
The advance Q1 GDP report, at 6.4% annualized, was slightly below expectations, largely due to a decline in private inventories.
Personal consumption expenditures (PCE) increased at a 10.7% annualized rate in Q1, due, in part, to the American Rescue Plan Act.
The second graph below shows the contribution to GDP from residential investment, equipment and software, and nonresidential structures (3 quarter trailing average). This is important to follow because residential investment tends to lead the economy, equipment and software is generally coincident, and nonresidential structure investment trails the economy.
In the graph, red is residential, green is equipment and software, and blue is investment in non-residential structures. So the usual pattern - both into and out of recessions is - red, green, blue.
Of course - with the sudden economic stop due to COVID-19 - the usual pattern doesn't apply.
The dashed gray line is the contribution from the change in private inventories.
 Residential investment (RI) increased at a 10.8% annual rate in Q1.
Equipment investment increased at a 16.7% annual rate, and investment in
non-residential structures decreased at a 4.8% annual rate (after getting crushed over the previous year)..
Residential investment (RI) increased at a 10.8% annual rate in Q1.
Equipment investment increased at a 16.7% annual rate, and investment in
non-residential structures decreased at a 4.8% annual rate (after getting crushed over the previous year)..The contribution to Q1 GDP from investment in private inventories was -2.64 percentage points (this will likely be a positive for Q2).
On a 3 quarter trailing average basis, RI (red) is up solidly, equipment (green) is also up solidly, and nonresidential structures (blue) is down.
On a 3 quarter trailing average basis, RI (red) is up solidly, equipment (green) is also up solidly, and nonresidential structures (blue) is down.
I'll post more on the components of non-residential investment once the
supplemental data is released.
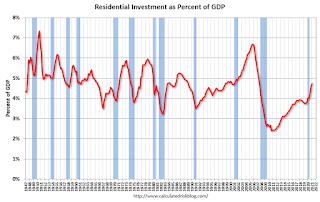 The second graph shows residential investment as a percent of GDP.
Residential Investment as a percent of GDP increased in Q1.
I'll break down Residential Investment into components after the GDP details are released.
Note: Residential investment (RI) includes new single family structures, multifamily structures, home improvement, broker's commissions, and a few minor categories.
 The third graph shows non-residential investment in
structures, equipment and "intellectual property products".
The third graph shows non-residential investment in
structures, equipment and "intellectual property products".
Investment in non-residential structures declined in Q1 as a percent GDP, and will probably be weak for some time (hotel occupancy is still low, office and mall vacancy rates are high).


