 RSS Feed
 by Calculated Risk on 4/11/2021 09:56:00 AM
Sunday, April 11, 2021
NMHC: Rent Payment Tracker Shows Households Paying Rent Increased 1.9% YoY in Early April
From the NMHC: NMHC Rent Payment Tracker Finds 79.8 Percent of Apartment Households Paid Rent as of April 6
The National Multifamily Housing Council (NMHC)’s Rent Payment Tracker found 79.8 percent of apartment households made a full or partial rent payment by April 6 in its survey of 11.6 million units of professionally managed apartment units across the country. This marks one year of tracking rent payment data following the onset of the pandemic.
This is a 1.9 percentage point increase from the share who paid rent through April 6, 2020 and compares to 82.9 percent that had been paid by April 6, 2019. This data encompasses a wide variety of market-rate rental properties across the United States, which can vary by size, type and average rental price.
“This month’s data is more evidence of a recovering economy and the resilience of the multifamily industry,” said Doug Bibby, NMHC President. “While we are not out of the woods yet, there is light at the end of the tunnel. The recently passed American Rescue Plan included $26 billion in rental assistance as well as billions more of housing resources that will prove critical to keeping families safely and securely housed and the nation’s rental housing sector stable.
emphasis added
 Click on graph for larger image.
This graph from the NMHC Rent Payment Tracker shows the percent of household making full or partial rent payments by the 6th of the month compared to 2019 and to the first COVID year.
Although payments are down from 2019, rent payments are up from last year.
This is mostly for large, professionally managed properties.
The second graph shows full month payments through March compared to the same month the prior year.
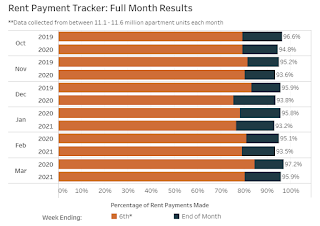 This shows a decline in rent payments year-over-year.
This is mostly for large, professionally managed properties.
The second graph shows full month payments through March compared to the same month the prior year.
 This shows a decline in rent payments year-over-year.
CR Note: There are some timing issues month to month, but full month rent payments have declined year-over-year through March.
Saturday, April 10, 2021
April 10th COVID-19 Vaccinations, New Cases, Hospitalizations
by Calculated Risk on 4/10/2021 11:41:00 PM
Note: I'm looking forward to not posting this daily! I've been posting this data daily for over a year, and I'll stop once all three of these criteria are met:
1) 70% of the population over 18 has had at least one dose of vaccine,
2) new cases are under 5,000 per day, and
3) hospitalizations are below 3,000.
According to the CDC, 183.5 million doses have been administered. 27.3% of the population over 18 is fully vaccinated, and 45.1% of the population over 18 has had at least one dose (116.4 million people have had at least one dose).
And check out COVID Act Now to see how each state is doing.
Over 6,300 US deaths were reported so far in April due to COVID.
 Click on graph for larger image.
This graph shows the daily (columns) 7 day average (line) of positive tests reported.
Note: The ups and downs during the Winter surge were related to reporting delays due to the Thanksgiving and Christmas holidays.
This data is from the CDC.
 Click on graph for larger image.
This graph shows the daily (columns) 7 day average (line) of positive tests reported.
Note: The ups and downs during the Winter surge were related to reporting delays due to the Thanksgiving and Christmas holidays.
This data is from the CDC.
The 7-day average is 66,633, up
from 64,393 yesterday, and close to the summer surge peak of 67,337 on July 23, 2020.
The second graph shows the number of people hospitalized.
 This data is also from the CDC.
The CDC cautions that due to reporting delays, the area in grey will probably increase.
The second graph shows the number of people hospitalized.
 This data is also from the CDC.
The CDC cautions that due to reporting delays, the area in grey will probably increase.
The current 7-day average is 35,559, up from 35,187 reported yesterday, and well above the post-summer surge low of 23,000.
Atlanta Real Estate in March: Sales Up 15% YoY, Inventory Down 58% YoY
by Calculated Risk on 4/10/2021 09:43:00 AM
Note: I'm tracking data for many local markets around the U.S. I think it is especially important to watch inventory this year.
From the GAMLS for Atlanta:
Total Residential Units Sold in March 2021 were 9,021, up 14.6% from 7,874 in March 2020.
Active Residential Listings in March 2021 were 7,418, down 58.3% from 17,802 in March 2020.
Months of Supply was 0.89 Months in March 2021, compared to 2.27 Months in March 2020.
 Click on graph for larger image.
This graph from the Georgia MLS shows inventory in Atlanta over the last several years - and the sharp decline in inventory at the start of the pandemic.
Schedule for Week of April 11, 2021
by Calculated Risk on 4/10/2021 08:11:00 AM
The key reports this week are March housing starts, CPI and retail sales.
For manufacturing, the March Industrial Production report and the April NY and Philly Fed manufacturing surveys will be released this week.
No major economic releases scheduled.
6:00 AM ET: NFIB Small Business Optimism Index for March.
8:30 AM: The Consumer Price Index for March from the BLS. The consensus is for 0.5% increase in CPI, and a 0.2% increase in core CPI.
7:00 AM ET: The Mortgage Bankers Association (MBA) will release the results for the mortgage purchase applications index.
12:00 PM: Discussion, Fed Chair Jerome Powell, Economic Club of Washington Interview, At the Economic Club of Washington
2:00 PM: the Federal Reserve Beige Book, an informal review by the Federal Reserve Banks of current economic conditions in their Districts.
8:30 AM: The initial weekly unemployment claims report will be released. The consensus is for a decrease to 720 thousand from 744 thousand last week.
 8:30 AM: Retail sales for March is scheduled to be released. The consensus is for a 5.5% increase in retail sales. The consensus is probably low (given the stimulus checks).
This graph shows the year-over-year change in retail sales and food service (ex-gasoline) since 1993. Retail and Food service sales, ex-gasoline, increased by 7.0% on a YoY basis in February.
8:30 AM: The New York Fed Empire State manufacturing survey for April. The consensus is for a reading of 18.2, up from 17.4.
8:30 AM: the Philly Fed manufacturing survey for April. The consensus is for a reading of 43.0, down from 51.8.
 9:15 AM: The Fed will release Industrial Production and Capacity Utilization for March.
This graph shows industrial production since 1967.
The consensus is for a 3.0% increase in Industrial Production, and for Capacity Utilization to increase to 75.8%.
10:00 AM: The April NAHB homebuilder survey. The consensus is for a reading of 83, up from 82. Any number above 50 indicates that more builders view sales conditions as good than poor.
 8:30 AM ET: Housing Starts for March.
 This graph shows single and total housing starts since 1968.
The consensus is for 1.600 million SAAR, up from 1.421 million SAAR in February.
10:00 AM: University of Michigan's Consumer sentiment index (Preliminary for April).
10:00 AM: State Employment and Unemployment (Monthly) for March 2021
Friday, April 09, 2021
April 9th COVID-19 Vaccinations, New Cases, Hospitalizations
by Calculated Risk on 4/09/2021 05:08:00 PM
Note: I'm looking forward to not posting this daily! I've been posting this data daily for over a year, and I'll stop once all three of these criteria are met:
1) 70% of the population over 18 has had at least one dose of vaccine,
2) new cases are under 5,000 per day, and
3) hospitalizations are below 3,000.
According to the CDC, 178.8 million doses have been administered. 26.4% of the population over 18 is fully vaccinated, and 44.1% of the population over 18 has had at least one dose (113.7 million people have had at least one dose).
And check out COVID Act Now to see how each state is doing.
Almost 5,500 US deaths were reported so far in April due to COVID.
 Click on graph for larger image.
This graph shows the daily (columns) 7 day average (line) of positive tests reported.
Note: The ups and downs during the Winter surge were related to reporting delays due to the Thanksgiving and Christmas holidays.
This data is from the CDC.
 Click on graph for larger image.
This graph shows the daily (columns) 7 day average (line) of positive tests reported.
Note: The ups and downs during the Winter surge were related to reporting delays due to the Thanksgiving and Christmas holidays.
This data is from the CDC.
The 7-day average is 64,393, up
from 64,344 yesterday, and close to the summer surge peak of 67,337 on July 23, 2020.
The second graph shows the number of people hospitalized.
 This data is also from the CDC.
The CDC cautions that due to reporting delays, the area in grey will probably increase.
The second graph shows the number of people hospitalized.
 This data is also from the CDC.
The CDC cautions that due to reporting delays, the area in grey will probably increase.
The current 7-day average is 35,187, up from 34,883 reported yesterday, and well above the post-summer surge low of 23,000.
North Texas Real Estate in March: Sales Up 7% YoY, Inventory Down 65% YoY
by Calculated Risk on 4/09/2021 02:10:00 PM
Note: I'm posting data for many local markets around the U.S. The story is the same everywhere ... inventory is at record lows.
From the NTREIS for North Texas (including Dallas/Ft. Worth):
Single Family Homes sold in March 2021 were 9,712, up 5.0% from 9,252 in March 2020.
Condos and Townhomes sold in March 2021 were 805, up 50.2% from 536 in March 2020.
Combined, sales were up 7.4% year-over-year.
Single Family Active Listings in March 2021 were 6,859, down 67.1% from 20,853 in March 2020.
Combined, sales were up 7.4% year-over-year.
Single Family Active Listings in March 2021 were 6,859, down 67.1% from 20,853 in March 2020.
For Condos and Townhomes, Active Listings in March 2021 were 1,264, down 37.7% from 2,030 in March 2020.
Combined, active listings declined 64.5% year-over-year.
Combined, active listings declined 64.5% year-over-year.
Q1 GDP Forecasts: Around 7%
by Calculated Risk on 4/09/2021 01:48:00 PM
Note that the forecasts of the automated systems (based on released data) are lower than the forecasts of economists. Economists are expecting March to be very strong.
From Merrrill Lynch:
We continue to track 7.0% for 1Q GDP growth. [Apr 9 estimate]From Goldman Sachs:
emphasis added
We left our Q1 GDP tracking estimate unchanged at +7.5% (qoq ar). [Apr 9 estimate]From the NY Fed Nowcasting Report
The New York Fed Staff Nowcast stands at 6.0% for 2021:Q1 and 1.5% for 2021:Q2. [Apr 9 estimate]And from the Altanta Fed: GDPNow
The GDPNow model estimate for real GDP growth (seasonally adjusted annual rate) in the first quarter of 2021 is 6.0 percent on April 9, down from 6.2 percent on April 7. [Apr 9 estimate]
Is there a New Housing Bubble?
by Calculated Risk on 4/09/2021 11:36:00 AM
There is discussion of another housing bubble. I wouldn't call the current situation a "bubble".
Way back in early 2005, I wrote: Housing: Speculation is the Key
Ben Carlson discusses lending (and other issues) in Why This is Not Another Housing Bubble.
The lack of wild speculation doesn't mean house prices can't decline, but it means that we won't see cascading declines in prices like what happened when the housing bubble burst. In the 2006 through 2011 period, as prices fell, and teaser rates and other "affordability products" expired - more and more homeowners were forced to sell (or just walk away). That drove prices down 26% nationally from peak to trough, and much more in certain "bubble" cities like Las Vegas (down 62% from peak) and Phoenix (down 56%).
A bubble requires both overvaluation based on fundamentals and speculation. It is natural to focus on an asset’s fundamental value, but the real key for detecting a bubble is speculation ... Speculation tends to chase appreciating assets, and then speculation begets more speculation, until finally, for some reason that will become obvious to all in hindsight, the "bubble" bursts.Maybe prices are too high based on fundamentals (due to extremely low supply and record low mortgage rates), but there is very little evidence of speculation (not like the loose lending of the housing bubble).
Ben Carlson discusses lending (and other issues) in Why This is Not Another Housing Bubble.
The lack of wild speculation doesn't mean house prices can't decline, but it means that we won't see cascading declines in prices like what happened when the housing bubble burst. In the 2006 through 2011 period, as prices fell, and teaser rates and other "affordability products" expired - more and more homeowners were forced to sell (or just walk away). That drove prices down 26% nationally from peak to trough, and much more in certain "bubble" cities like Las Vegas (down 62% from peak) and Phoenix (down 56%).
We might see some price declines, especially in some 2nd home areas that saw a surge in demand at the onset of the pandemic, but the recent buyers are all well qualified, and some price declines will not lead to forced selling. So there is no threat to the financial system with widespread defaults.
On fundamentals:
Every month, I post a price-to-rent graph based on 2004 paper by Fed economist John Krainer and researcher Chishen Wei: House Prices and Fundamental Value. Kainer and Wei presented a price-to-rent ratio using the OFHEO house price index and the Owners' Equivalent Rent (OER) from the BLS.
 Here is a similar graph using the Case-Shiller National and Composite 20 House Price Indexes.
This graph shows the price to rent ratio (January 2000 = 1.0). This suggested prices were way too high during the housing bubble, and also suggests prices might be high now - but only about half the housing bubble.
If we factor in low rates, demographics, and if low supply persists (I think inventory will increase this year), maybe prices are only a little out of line.
Here is another measure - house prices to the Median Household income.
 This graph uses the year end Case-Shiller house price index - and the nominal median household income through 2019 (from the Census Bureau). 2020 median income is estimated at a 5% gain.
This graph shows the ratio of house price indexes divided by the Median Household Income through 2020 (the HPI is first multiplied by 1000).
This uses the year end National Case-Shiller index since 1976 (December 2020 estimated).
House price appear elevated relative to incomes, but still well below the levels of the housing bubble.
From a historical perspective, house prices are high. But lending standards have been solid, and we haven't seen significant speculation - so I wouldn't call this a bubble.
Black Knight: Number of Homeowners in COVID-19-Related Forbearance Plans Decreased
by Calculated Risk on 4/09/2021 08:53:00 AM
Note: Both Black Knight and the MBA (Mortgage Bankers Association) are putting out weekly estimates of mortgages in forbearance.
This data is as of April 6th.
From Black Knight: U.S. Sees Largest Weekly Forbearance Decline in Six Months
We continue to see great improvements in forbearance plan numbers, with this week showing the largest weekly decline in six months. The number of outstanding forbearances fell by 228,000 (-9.0%), largely driven by early forbearance entrants exiting their plans at or around the 12-month mark.The number of loans in forbearance continues to decline.
Significant improvements were seen across investor classes, with decline of 94,000 in FHA/VA plans, a 69,000 decline in GSE forbearances and portfolio/PLS plan volumes declining by 65,000 this week alone. Overall, an estimated 280,000 borrowers exited forbearance this week, representing more than half of all loans being reviewed for extension and removal.
Click on graph for larger image.
Forbearance plan starts also continue to improve, with an estimated 158,000 such starts (including re-starts) over the past four weeks, down 18 percent from the preceding four-week period. All in, some 2.3 million borrowers remain in forbearance as of April 6, representing 4.4% of all outstanding first-lien mortgage holders.
With an estimated 500,000 additional forbearance plans with scheduled expirations at the end of April, we could see additional improvements near the end of this month and into early May. We’ll keep an eye on the numbers and have another report on Friday, April 16.
emphasis added

Thursday, April 08, 2021
Sacramento Real Estate in March: Sales up 10% YoY, Active Inventory down 45% YoY
by Calculated Risk on 4/08/2021 07:25:00 PM
From SacRealtor.org: Sales volume up 25% over Feb., sales price over $480k
March closed with 1,292 sales, up 25% from the 1,034 sales in February. Compared to one year ago (1,170), the current figure is up 10.4%.
...
The Active Listing Inventory increased 9.4% from February to March, from 839 units to 918 units. Compared with March 2020 (1,658), inventory is down 44.6%. The Months of Inventory decreased from .8 Months to .7 Months. This figure represents the amount of time (in months) it would take for the current rate of sales to deplete the total active listing inventory.
...
The Median DOM (days on market) remained at 6 and the Average DOM decreased from 15 to 13. “Days on market” represents the days between the initial listing of the home as “active” and the day it goes “pending.” Of the 1,292 sales this month, 91.2% (1,178) were on the market for 30 days or less and 96.5% (1,246) were on the market for 60 days or less.
emphasis added
 Click on graph for larger image.
This graph from the Sacramento Association of REALTORS® shows single family sales and inventory since February 2018. Usually inventory (red) was higher than sales (blue), but now there are more sales each month than inventory. Inventory declined sharply during the pandemic.


