 RSS Feed
 by Calculated Risk on 2/02/2021 10:19:00 AM
Tuesday, February 02, 2021
HVS: Q4 2020 Homeownership and Vacancy Rates
The Census Bureau released the Residential Vacancies and Homeownership report for Q4 2020.
It is likely the results of this survey were significantly distorted by the pandemic. See note from Census below.
This report is frequently mentioned by analysts and the media to track household formation, the homeownership rate, and the homeowner and rental vacancy rates. However, there are serious questions about the accuracy of this survey.
This survey might show the trend, but I wouldn't rely on the absolute numbers. The Census Bureau is investigating the differences between the HVS, ACS and decennial Census, and analysts probably shouldn't use the HVS to estimate the excess vacant supply or household formation, or rely on the homeownership rate, except as a guide to the trend.
"National vacancy rates in the fourth quarter 2020 were 6.5 percent for rental housing and 1.0 percent for homeowner housing. The rental vacancy rate of 6.5 percent was not statistically different from the rate in the fourth quarter 2019 (6.4 percent) and not statistically different from the rate in the third quarter 2020 (6.4 percent). The homeowner vacancy rate of 1.0 percent was 0.4 percentage points lower than the rate in the fourth quarter 2019 (1.4 percent) and not statistically different from the rate in the third quarter 2020 (0.9 percent).
The homeownership rate of 65.8 percent was 0.7 percentage points higher than the rate in the fourth quarter 2019 (65.1 percent) and 1.6 percentage points lower than the rate in the third quarter 2020 (67.4 percent)."
 Click on graph for larger image.
The Red dots are the decennial Census homeownership rates for April 1st 1990, 2000 and 2010. The HVS homeownership rate decreased to 65.8% in Q4, from 67.4% in Q3.
I'd put more weight on the decennial Census numbers. The results in Q2 through Q4 of 2020 were distorted by the pandemic.
 The HVS homeowner vacancy increased to 1.0% from 0.9% in Q3.
 Once again - this probably shows the general trend, but I wouldn't rely on the absolute numbers.
From Census:
Due to the coronavirus pandemic (COVID-19), data collection operations for the CPS/HVS were affected during the fourth quarter of 2020, as in-person interviews were only allowed for portions of the sample in October (100 percent), November (98 percent), and December (84 percent). If the Field Representative was unable to get contact information on the sample unit, the unit was made a Type A noninterview (no one home, refusal, etc). We are unable to determine the extent to which this data collection change affected our estimates.
 The rental vacancy rate increased to 6.5% in Q4.
The quarterly HVS is the most timely survey on households, but there are many questions about the accuracy of this survey.
CoreLogic: House Prices up 9.2% Year-over-year in December
by Calculated Risk on 2/02/2021 08:00:00 AM
Notes: This CoreLogic House Price Index report is for December. The recent Case-Shiller index release was for November. The CoreLogic HPI is a three month weighted average and is not seasonally adjusted (NSA).
From CoreLogic: Onward and Upward: Annual US Home Price Appreciation in 2020 Outpaced 2019 Levels by 50%, CoreLogic Reports
CoreLogic® ... today released the CoreLogic Home Price Index (HPI™) and HPI Forecast™ for December 2020, providing a lookback at the state of the housing market and the pandemic’s impact on home price performance throughout 2020.
The housing market exceeded expectations in 2020, closing out the year with the highest annual home price gain since February 2014 in December at 9.2%. Despite a blip in April, home-purchase demand surged as record-low mortgage rates persuaded first-time homebuyers to enter the market. Meanwhile, the consequences of the pandemic were seen in the dwindling supply of homes — dropping, on average, 24% below 2019 levels — as homeowners delayed selling.
These factors translated to significant home price growth in 2020, surpassing the previous year’s levels with an average monthly year-over-year gain of 5.7%, compared with 3.8% in 2019. However, with the severe shortage of for-sale homes, we may see rising affordability concerns and some prospective buyers priced out of the market in 2021.
“At the start of the pandemic, many braced for a Great Recession-era collapse of the housing market,” said Frank Martell, president and CEO of CoreLogic. “However, market conditions leading into the crisis — namely low home supply, desire for more space and millennial demand — amplified the rapid acceleration of home prices.”
“Two record lows are fueling home price gains: for-sale inventory and mortgage rates,” said Dr. Frank Nothaft, chief economist at CoreLogic. “Prospective sellers with flexible timetables have opted to delay listing their home until the pandemic fades or they are vaccinated. We can expect more inventory to come available in the second half of the year, leading to slowing in price growth toward year-end.”
emphasis added
Monday, February 01, 2021
Mortgage Rates still near Record Lows
by Calculated Risk on 2/01/2021 09:12:00 PM
From Matthew Graham at Mortgage News Daily: Mortgage Rates Hold Steady to Start New Week
The average mortgage lender offered rates that were at least as good as Friday's with purchases still seeing 2.5-2.625% and no-cash-out refis in the 2.75-2.875% neighborhood (this assumes a top tier conventional 30yr fixed loan with at least 20% equity, 740+ credit, and no other negative loan level price adjustments).Tuesday:
emphasis added
• Early, Corelogic House Price index for December.
• At 10:00 AM ET, the Q4 2020 Housing Vacancies and Homeownership from the Census Bureau.
• All day, Light vehicle sales for January. The consensus is for light vehicle sales to be 16.3 million SAAR in January, unchanged from 16.3 million in December (Seasonally Adjusted Annual Rate).
February 1 COVID-19 Test Results and Vaccinations
by Calculated Risk on 2/01/2021 07:09:00 PM
Note: Bloomberg has great data on vaccinations.
"In the U.S., more Americans have now received at least one dose than have tested positive for the virus since the pandemic began. Some 32.8 million doses have been given, most recently at an average rate of 1.34 million doses per day."Also check out the graphs at COVID-19 Vaccine Projections The site has several interactive graphs related to US COVID vaccinations including a breakdown of how many have had one shot, and how many have had both shots.
The US is now averaging close to 2 million tests per day. Based on the experience of other countries, for adequate test-and-trace (and isolation) to reduce infections, the percent positive needs to be under 5% (probably close to 1%), so the US has far too many daily cases - and percent positive - to do effective test-and-trace.
There were 1,610,238 test results reported over the last 24 hours.
There were 119,747 positive tests.
Over 1,500 US deaths have been reported in February. See the graph on US Daily Deaths here.
This data is from the COVID Tracking Project.
And check out COVID Act Now to see how each state is doing. (updated link to new site)
 Click on graph for larger image.
This graph shows the 7 day average of positive tests reported and daily hospitalizations.
The percent positive over the last 24 hours was 7.4%. The percent positive is calculated by dividing positive results by total tests (including pending).
It seems likely cases and hospitalizations have peaked, but are declining from a very high level.
Black Knight Mortgage Monitor for December
by Calculated Risk on 2/01/2021 05:39:00 PM
Black Knight released their Mortgage Monitor report for December today. According to Black Knight, 6.08% of mortgages were delinquent in December, down from 6.33% of mortgages in November, and up from 3.40% in December 2019. Black Knight also reported that 0.33% of mortgages were in the foreclosure process, down from 0.46% a year ago.
This gives a total of 6.54% delinquent or in foreclosure.
Press Release: Black Knight: 24% of Active Forbearance Plans Scheduled to End in March, When More than 600,000 Homeowners Face 12-Month Expirations
Today, the Data & Analytics division of Black Knight, Inc. (NYSE:BKI) released its latest Mortgage Monitor Report, based upon the company’s industry-leading mortgage, real estate and public records datasets. As the final, 12-month expiration point for many forbearance plans quickly approaches, this month’s report looks at how the slowdown in improvement in recent months may present new challenges to recovery for seriously delinquent homeowners. According to Black Knight Data & Analytics President Ben Graboske, the end of March 2021 is shaping up to be an inflection point for the industry.
“For the roughly 6.7 million Americans who have been in COVID-19 related mortgage forbearance at some point since the onset of the pandemic, the programs have represented an essential lifeline,” said Graboske. “The vast majority of plans have a 12-month cap on payment forbearance, though. And the various moratoriums which have kept foreclosure actions at bay over the past 10 months may be lulling us into a false sense of security about the scope of the post-forbearance problem we will need to confront come the end of March. Last year saw the largest number of homeowners – nearly 3.6 million – become 90 or more days past due since 2009, and as of the end of December, 2.1 million remained so.
“When nearly a quarter of all forbearance plans come to an end on March 31, at the current rate of improvement there would still be approximately 1.5 million more such serious delinquencies than before the pandemic. With that rate of improvement slowing in recent weeks, current trends suggest more than 2.5 million homeowners would still in forbearance at that point. While early in the pandemic roughly half of homeowners in forbearance continued to make their monthly mortgage payments, that number has steadily declined. Today, it’s about 12%, which suggests the people who are taking the full forbearance period afforded to them may well be experiencing prolonged financial distress, and face extended challenges as they return to making payments.”
emphasis added
 Click on graph for larger image.
Here is a graph from the Mortgage Monitor that shows Black Knight's estimate of inventory over the last several years.
From Black Knight:
• Severe inventory shortages persist across the country, with the number of homes listed for sale down 40% from last year, representing a 450K decline in the number of homes available for sale compared to the same time last year
• Even factoring in a slight downward trend in new listings in recent years, volumes for 2020 suggest that more than 750K homeowners chose to forego listing their homes for sale in 2020 because of the pandemic (a 16% decline year-over-year)
• Nearly 2/3 of the shortage of listings came in Q2 2020 alone, which was down more than 470K new listings from the year prior
• By December, new listings were flat year-over-year, suggesting that volumes may be normalizing to some degree; even so, a return to the status quo would still leave us at a significant deficit should buyer demand remain strong
 And on delinquencies from Black Knight:
 • December saw another modest improvement in mortgage delinquencies, with the national mortgage delinquency rate falling by 3.9% for the month to 6.08%There is much more in the mortgage monitor.
• Serious delinquencies (90+ days) also improved in December, falling to 3.43M from 3.56M the month prior
• Nearly 40% of the pandemic-related rise in overall delinquencies has now been reversed, but only 11% of the rise in serious delinquencies, providing a more accurate representation of the true recovery to date
MBA Survey: "Share of Mortgage Loans in Forbearance Remains Unchanged at 5.38%"
by Calculated Risk on 2/01/2021 04:00:00 PM
Note: This is as of January 24th.
From the MBA: Share of Mortgage Loans in Forbearance Remains Unchanged at 5.38%
The Mortgage Bankers Association’s (MBA) latest Forbearance and Call Volume Survey revealed that the total number of loans now in forbearance remained unchanged relative to the prior week at 5.38% of servicers’ portfolio volume as of January 24, 2021. According to MBA’s estimate, 2.7 million homeowners are in forbearance plans.
...
“The share of loans in forbearance was unchanged in the prior week, with a gain in the portfolio/PLS loan segment offset by declines in the Ginnie Mae and GSE investor loan categories. When servicers buy out delinquent loans from Ginnie Mae pools, they are reclassified as portfolio loans, which can lead to a decrease in the Ginnie Mae forbearance share and an increase in the portfolio/PLS share,” said Mike Fratantoni, MBA’s Senior Vice President and Chief Economist. “While new forbearance requests dropped slightly, the rate of exits from forbearance was at the slowest pace since MBA began tracking exit data last summer.”
Fratantoni added, “Overall, the forbearance numbers have been little changed over the past few months. Homeowners still in forbearance are likely facing ongoing challenges with lost jobs, lost income, and other impacts from the pandemic.”
emphasis added
 Click on graph for larger image.
This graph shows the percent of portfolio in forbearance by investor type over time. Most of the increase was in late March and early April, then trended down - and has mostly moved sideways recently.
The MBA notes: "Total weekly forbearance requests as a percent of servicing portfolio volume (#) decreased relative to the prior week: from 0.07% to 0.06%."
Housing Inventory Weekly Update: At Record Lows
by Calculated Risk on 2/01/2021 12:46:00 PM
One of the key questions for 2021 is: Will inventory increase as the pandemic subsides, or will inventory decrease further in 2021?
Tracking inventory will be very important this year, and I'll be using some weekly sources.
 Click on graph for larger image in graph gallery.
This inventory graph is courtesy of Altos Research.
As of January 29th, inventory was at 367 thousand (7 day average), compared to 732 thousand the same week a year ago. That is a decline of almost 50%.
A week ago, inventory was at 380 thousand, and was down 48% YoY. Seasonally inventory should bottom by early March.
Mike Simonsen discusses this data regularly on Youtube.
Mike Simonsen discusses this data regularly on Youtube.
Construction Spending Increased 1.0% in December; 4.7% Annual Increase
by Calculated Risk on 2/01/2021 10:38:00 AM
From the Census Bureau reported that overall construction spending increased:
Construction spending during December 2020 was estimated at a seasonally adjusted annual rate of $1,490.4 billion, 1.0 percent above the revised November estimate of $1,475.6 billion. The December figure is 5.7 percent above the December 2019 estimate of $1,410.3 billion.Both private and public spending increased:
The value of construction in 2020 was $1,429.7 billion, 4.7 percent above the $1,365.1 billion spent in 2019.
emphasis added
Spending on private construction was at a seasonally adjusted annual rate of $1,137.6 billion, 1.2 percent above the revised November estimate of $1,124.4 billion. ...
In December, the estimated seasonally adjusted annual rate of public construction spending was $352.8 billion, 0.5 percent above the revised November estimate of $351.1 billion.
 Click on graph for larger image.
This graph shows private residential and nonresidential construction spending, and public spending, since 1993. Note: nominal dollars, not inflation adjusted.
Residential spending is 2% above the bubble peak (in nominal terms - not adjusted for inflation).
Non-residential spending is 8% above the previous peak in January 2008 (nominal dollars), but has been weak recently.
Public construction spending is 8% above the previous peak in March 2009, and 35% above the austerity low in February 2014.
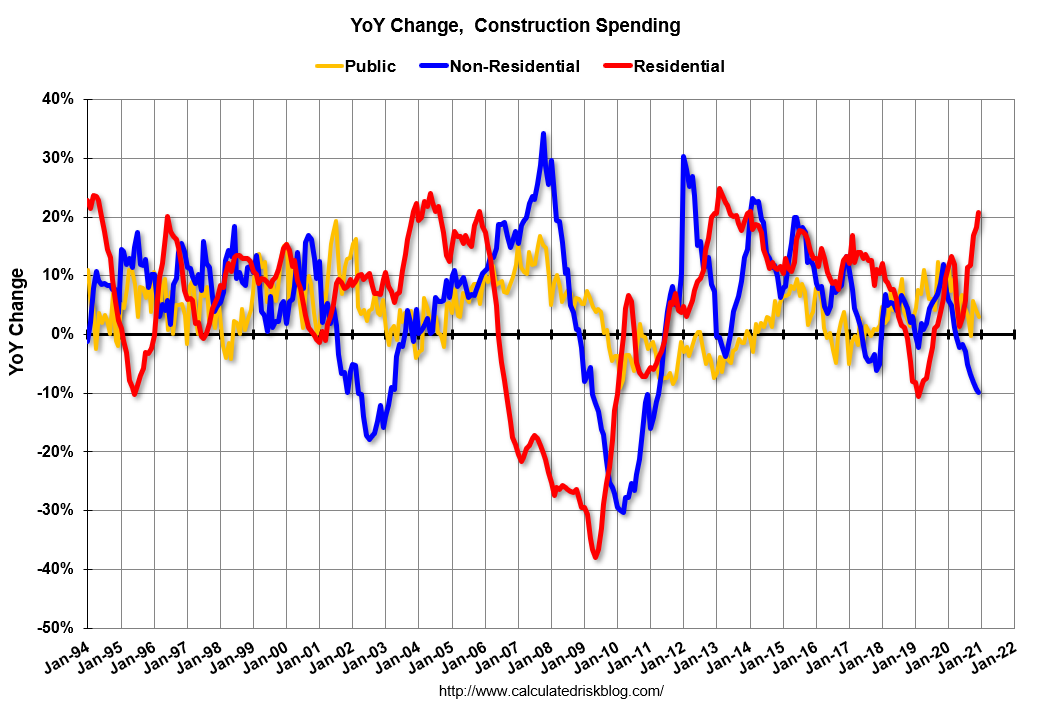 The second graph shows the year-over-year change in construction spending.
On a year-over-year basis, private residential construction spending is up 20.7%. Non-residential spending is down 9.8% year-over-year. Public spending is up 3.0% year-over-year.
Construction was considered an essential service in most areas and did not decline sharply like many other sectors, but it seems likely that non-residential, and public spending (depending on disaster relief), will be under pressure. For example, lodging is down 25% YoY, multi-retail down 21% YoY, and office down 3% YoY.
This was slightly above consensus expectations of a 0.9% increase in spending, and construction spending for the previous two months was revised up. A strong report.
ISM Manufacturing index Decreased to 58.7 in January
by Calculated Risk on 2/01/2021 10:15:00 AM
The ISM manufacturing index indicated expansion in January. The PMI was at 58.7% in January, down from 60.5% in December. The employment index was at 52.6%, up from 51.7% last month, and the new orders index was at 61.1%, down from 67.5%.
From ISM: Manufacturing PMI® at 58.7%; January 2021 Manufacturing ISM® Report On Business®
Economic activity in the manufacturing sector grew in January, with the overall economy notching an eighth consecutive month of growth, say the nation's supply executives in the latest Manufacturing ISM® Report On Business®.This was below expectations.
The report was issued today by Timothy R. Fiore, CPSM, C.P.M., Chair of the Institute for Supply Management® (ISM®) Manufacturing Business Survey Committee:
"The January Manufacturing PMI® registered 58.7 percent, down 1.8 percentage points from the seasonally adjusted December reading of 60.5 percent. This figure indicates expansion in the overall economy for the eighth month in a row after contraction in March, April, and May. The New Orders Index registered 61.1 percent, down 6.4 percentage points from the seasonally adjusted December reading of 67.5 percent. The Production Index registered 60.7 percent, a decrease of 4 percentage points compared to the seasonally adjusted December reading of 64.7 percent. The Backlog of Orders Index registered 59.7 percent, 0.6 percentage point above the December reading of 59.1 percent. The Employment Index registered 52.6 percent, 0.9 percentage point higher from the seasonally adjusted December reading of 51.7 percent. The Supplier Deliveries Index registered 68.2 percent, up 0.5 percentage point from the December figure of 67.7 percent. The Inventories Index registered 50.8 percent, 0.2 percentage point lower than the seasonally adjusted December reading of 51 percent. The Prices Index registered 82.1 percent, up 4.5 percentage points compared to the December reading of 77.6 percent. The New Export Orders Index registered 54.9 percent, a decrease of 2.6 percentage points compared to the December reading of 57.5 percent. The Imports Index registered 56.8 percent, a 2.2-percentage point increase from the December reading of 54.6 percent."
emphasis added
This suggests manufacturing expanded at a slower pace in January than in December.
Seven High Frequency Indicators for the Economy
by Calculated Risk on 2/01/2021 08:48:00 AM
These indicators are mostly for travel and entertainment. It will interesting to watch these sectors recover as the vaccine is distributed.
IMPORTANT: Be safe now - if all goes well, we could all be vaccinated by Q2 2021.
----- Airlines: Transportation Security Administration -----
The TSA is providing daily travel numbers.
 Click on graph for larger image.
This data shows the seven day average of daily total traveler throughput from the TSA for 2019-2020 (Blue) and 2020-2021 (Red).
The dashed line is the percent of last year for the seven day average.
This data is as of January 31st.
The seven day average is down 64.4% from last year (35.6% of last year). (Dashed line)
There was a slow increase from the bottom, with ups and downs due to the holidays - but TSA data has mostly moved sideways.
----- Restaurants: OpenTable -----
The second graph shows the 7 day average of the year-over-year change in diners as tabulated by OpenTable for the US and several selected cities.
 Thanks to OpenTable for providing this restaurant data:
This data is updated through January 30, 2021.
This data is "a sample of restaurants on the OpenTable network across all channels: online reservations, phone reservations, and walk-ins. For year-over-year comparisons by day, we compare to the same day of the week from the same week in the previous year."
Note that this data is for "only the restaurants that have chosen to reopen in a given market". Since some restaurants have not reopened, the actual year-over-year decline is worse than shown.
Dining picked up during the holidays. Note that dining is generally lower in the northern states - Illinois, Pennsylvania, and New York. Note that California dining is picking up now that the orders to close has been lifted.
----- Movie Tickets: Box Office Mojo -----
 This data shows domestic box office for each week (red) and the maximum and minimum for the years 2016 through 2019. Blue is 2020 and Red is 2021.
The TSA is providing daily travel numbers.
 Click on graph for larger image.
This data shows the seven day average of daily total traveler throughput from the TSA for 2019-2020 (Blue) and 2020-2021 (Red).
The dashed line is the percent of last year for the seven day average.
This data is as of January 31st.
The seven day average is down 64.4% from last year (35.6% of last year). (Dashed line)
There was a slow increase from the bottom, with ups and downs due to the holidays - but TSA data has mostly moved sideways.
The second graph shows the 7 day average of the year-over-year change in diners as tabulated by OpenTable for the US and several selected cities.
 Thanks to OpenTable for providing this restaurant data:
This data is updated through January 30, 2021.
This data is "a sample of restaurants on the OpenTable network across all channels: online reservations, phone reservations, and walk-ins. For year-over-year comparisons by day, we compare to the same day of the week from the same week in the previous year."
Note that this data is for "only the restaurants that have chosen to reopen in a given market". Since some restaurants have not reopened, the actual year-over-year decline is worse than shown.
Dining picked up during the holidays. Note that dining is generally lower in the northern states - Illinois, Pennsylvania, and New York. Note that California dining is picking up now that the orders to close has been lifted.
 This data shows domestic box office for each week (red) and the maximum and minimum for the years 2016 through 2019. Blue is 2020 and Red is 2021.
 The data is from BoxOfficeMojo through January 28th.
Note that the data is usually noisy week-to-week and depends on when blockbusters are released.
Movie ticket sales were at $9 million last week (compared to usually around $200 million per week at this time of year).
----- Hotel Occupancy: STR -----
 This graph shows the seasonal pattern for the hotel occupancy rate using the four week average.
The red line is for 2021, black is 2020, blue is the median, and dashed light blue is for 2009 (the worst year since the Great Depression for hotels - before 2020).
This data is through January 23rd. Hotel occupancy is currently down 30.6% year-over-year. Seasonally we'd expect that business travel would start to pick up in the new year, but there will probably not be much pickup early in 2021.
Notes: Y-axis doesn't start at zero to better show the seasonal change.
----- Gasoline Supplied: Energy Information Administration -----
 This graph, based on weekly data from the U.S. Energy Information Administration (EIA), shows gasoline supplied compared to the same week of 2019.
Blue is for 2020. At one point, gasoline supplied was off almost 50% YoY. Red is for 2021.
As of January 2nd, gasoline supplied was off about 18.1% (about 81.9% of the same week in 2019).
Note: People driving instead of flying might have boosted gasoline consumption.
----- Transit: Apple Mobility -----
This graph is from Apple mobility. From Apple: "This data is generated by counting the number of requests made to Apple Maps for directions in select countries/regions, sub-regions, and cities." This is just a general guide - people that regularly commute probably don't ask for directions.
There is also some great data on mobility from the Dallas Fed Mobility and Engagement Index. However the index is set "relative to its weekday-specific average over January–February", and is not seasonally adjusted, so we can't tell if an increase in mobility is due to recovery or just the normal increase in the Spring and Summer.
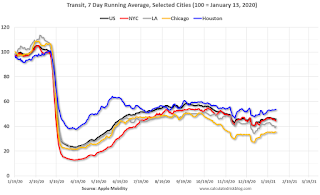 This data is through January 30th for the United States and several selected cities.
The graph is the running 7 day average to remove the impact of weekends.
IMPORTANT: All data is relative to January 13, 2020. This data is NOT Seasonally Adjusted. People walk and drive more when the weather is nice, so I'm just using the transit data.
According to the Apple data directions requests, public transit in the 7 day average for the US is at 46% of the January 2020 level. It is at 35% in Chicago, and 54% in Houston - and mostly moving sideways.
----- New York City Subway Usage -----
Here is some interesting data on New York subway usage (HT BR).
 This graph is from Todd W Schneider. This is daily data since early 2020.
This data is through Friday, January 29th.
Schneider has graphs for each borough, and links to all the data sources.
He notes: "Data updates weekly from the MTA’s public turnstile data, usually on Saturday mornings".
Note that the data is usually noisy week-to-week and depends on when blockbusters are released.
Movie ticket sales were at $9 million last week (compared to usually around $200 million per week at this time of year).
 This graph shows the seasonal pattern for the hotel occupancy rate using the four week average.
 The red line is for 2021, black is 2020, blue is the median, and dashed light blue is for 2009 (the worst year since the Great Depression for hotels - before 2020).
This data is through January 23rd. Hotel occupancy is currently down 30.6% year-over-year. Seasonally we'd expect that business travel would start to pick up in the new year, but there will probably not be much pickup early in 2021.
Notes: Y-axis doesn't start at zero to better show the seasonal change.
 This graph, based on weekly data from the U.S. Energy Information Administration (EIA), shows gasoline supplied compared to the same week of 2019.
Blue is for 2020. At one point, gasoline supplied was off almost 50% YoY. Red is for 2021.
As of January 2nd, gasoline supplied was off about 18.1% (about 81.9% of the same week in 2019).
Note: People driving instead of flying might have boosted gasoline consumption.
This graph is from Apple mobility. From Apple: "This data is generated by counting the number of requests made to Apple Maps for directions in select countries/regions, sub-regions, and cities." This is just a general guide - people that regularly commute probably don't ask for directions.
There is also some great data on mobility from the Dallas Fed Mobility and Engagement Index. However the index is set "relative to its weekday-specific average over January–February", and is not seasonally adjusted, so we can't tell if an increase in mobility is due to recovery or just the normal increase in the Spring and Summer.
 This data is through January 30th for the United States and several selected cities.
The graph is the running 7 day average to remove the impact of weekends.
IMPORTANT: All data is relative to January 13, 2020. This data is NOT Seasonally Adjusted. People walk and drive more when the weather is nice, so I'm just using the transit data.
According to the Apple data directions requests, public transit in the 7 day average for the US is at 46% of the January 2020 level. It is at 35% in Chicago, and 54% in Houston - and mostly moving sideways.
Here is some interesting data on New York subway usage (HT BR).
 This graph is from Todd W Schneider. This is daily data since early 2020.
This data is through Friday, January 29th.
Schneider has graphs for each borough, and links to all the data sources.
He notes: "Data updates weekly from the MTA’s public turnstile data, usually on Saturday mornings".


