by Calculated Risk on 1/31/2021 08:01:00 PM
Sunday, January 31, 2021
Monday: ISM Mfg, Construction Spending
Weekend:
• Schedule for Week of January 31, 2021
Monday:
• At 10:00 AM ET, ISM Manufacturing Index for January. The consensus is for the ISM to be at 60.0, down from 60.7 in December.
• Also at 10:00 AM, Construction Spending for December. The consensus is for a 0.9% increase in construction spending.
• At 2:00 PM, Senior Loan Officer Opinion Survey on Bank Lending Practices for January.
From CNBC: Pre-Market Data and Bloomberg futures S&P 500 are down 20 and DOW futures are down 100 (fair value).
Oil prices were down slightly over the last week with WTI futures at $52.03 per barrel and Brent at $54.92 barrel. A year ago, WTI was at $52, and Brent was at $58 - so WTI oil prices are unchanged year-over-year.
Here is a graph from Gasbuddy.com for nationwide gasoline prices. Nationally prices are at $2.42 per gallon. A year ago prices were at $2.48 per gallon, so gasoline prices are down $0.06 per gallon year-over-year.
January 31 COVID-19 Test Results and Vaccinations; January Deadliest Month
by Calculated Risk on 1/31/2021 07:53:00 PM
Note: Bloomberg has great data on vaccinations.
"Vaccinations in the U.S. began Dec. 14 with health-care workers, and so far 31.8 million shots have been given, according to a state-by-state tally by Bloomberg and data from the Centers for Disease Control and Prevention. In the last week, an average of 1.35 million doses per day were administered."Also check out the graphs at COVID-19 Vaccine Projections The site has several interactive graphs related to US COVID vaccinations including a breakdown of how many have had one shot, and how many have had both shots.
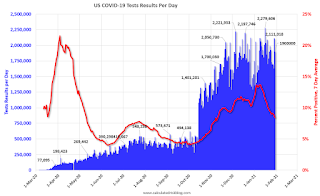
The US is now averaging close to 2 million tests per day. Based on the experience of other countries, for adequate test-and-trace (and isolation) to reduce infections, the percent positive needs to be under 5% (probably close to 1%), so the US has far too many daily cases - and percent positive - to do effective test-and-trace.
There were 1,661,492 test results reported over the last 24 hours.
There were 118,211 positive tests.
Over 95,000 US deaths have been reported in January, surpassing December as the deadliest month. See the graph on US Daily Deaths here.
This data is from the COVID Tracking Project.
And check out COVID Act Now to see how each state is doing. (updated link to new site)
 Click on graph for larger image.
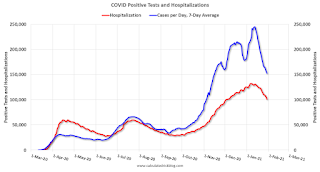
This graph shows the 7 day average of positive tests reported and daily hospitalizations.
The percent positive over the last 24 hours was 7.1%. The percent positive is calculated by dividing positive results by total tests (including pending).
It seems likely cases and hospitalizations have peaked, but are declining from a very high level.
Q4 2020 GDP Details on Residential and Commercial Real Estate
by Calculated Risk on 1/31/2021 11:15:00 AM
The BEA has released the underlying details for the Q4 advance GDP report.
The BEA reported that investment in non-residential structures increased at a 3.0% annual pace in Q4. This followed four consecutive quarterly declines (weakness started before the pandemic). On an annual basis, investment in non-residential structures was off 9.5% in 2020 from 2019.
Investment in petroleum and natural gas structures increased sharply in Q4 compared to Q3, but was still down 37% year-over-year. On an annual basis, investment in petroleum and natural gas structures was off 39% in 2020 compared to 2019.

The first graph shows investment in offices, malls and lodging as a percent of GDP.
Investment in offices decreased in Q4, and was only 6.1% year-over-year.
Investment in multimerchandise shopping structures (malls) peaked in 2007 and was down about 19% year-over-year in Q4 - and at a record low as a percent of GDP. The vacancy rate for malls is still very high, so investment will probably stay low for some time.
Lodging investment decreased in Q4, and lodging investment was down 23% year-over-year.
 The second graph is for Residential investment components as a percent of GDP. According to the Bureau of Economic Analysis, RI includes new single family structures, multifamily structures, home improvement, Brokers’ commissions and other ownership transfer costs, and a few minor categories (dormitories, manufactured homes).
Even though investment in single family structures has increased from the bottom, single family investment is still low, and still below the bottom for previous recessions as a percent of GDP.
Investment in single family structures was $337 billion (SAAR) (about 1.6% of GDP), and up 16.2% year-over-year.
Investment in multi-family structures increased in Q4.
Investment in home improvement was at a $306 billion Seasonally Adjusted Annual Rate (SAAR) in Q3 (about 1.4% of GDP). Home improvement spending has been solid during the pandemic.
Saturday, January 30, 2021
January 30 COVID-19 Test Results and Vaccinations
by Calculated Risk on 1/30/2021 07:46:00 PM
The reason I'm posting COVID data is this matters for the economy. From the FOMC statement this week:
"The path of the economy will depend significantly on the course of the virus, including progress on vaccinations."It appears the 7-day average cases has peaked. Stay safe! I'm looking forward to not posting this data soon.
"Vaccinations in the U.S. began Dec. 14 with health-care workers, and so far 30.5 million shots have been given, according to a state-by-state tally by Bloomberg and data from the Centers for Disease Control and Prevention. In the last week, an average of 1.35 million doses per day were administered."Also check out the graphs at COVID-19 Vaccine Projections The site has several interactive graphs related to US COVID vaccinations including a breakdown of how many have had one shot, and how many have had both shots.
The US is now averaging close to 2 million tests per day. Based on the experience of other countries, for adequate test-and-trace (and isolation) to reduce infections, the percent positive needs to be under 5% (probably close to 1%), so the US has far too many daily cases - and percent positive - to do effective test-and-trace.
There were 2,088,902 test results reported over the last 24 hours.
There were 146,657 positive tests.
Over 93,000 US deaths have been reported so far in January, surpassing December as the deadliest month. See the graph on US Daily Deaths here.
 Click on graph for larger image.
This data is from the COVID Tracking Project.
The percent positive over the last 24 hours was 7.0% (red line is 7 day average). The percent positive is calculated by dividing positive results by total tests (including pending).
And check out COVID Act Now to see how each state is doing. (updated link to new site)
 The second graph shows the 7 day average of positive tests reported and daily hospitalizations.
It seems likely cases and hospitalizations have peaked, but are declining from a very high level.
Schedule for Week of January 31, 2021
by Calculated Risk on 1/30/2021 08:11:00 AM
The key report scheduled for this week is the January employment report.
Other key indicators include January ISM manufacturing and services surveys, the December trade deficit, and January vehicle sales.
10:00 AM: ISM Manufacturing Index for January. The consensus is for the ISM to be at 60.0, down from 60.7 in December.
10:00 AM: Construction Spending for December. The consensus is for a 0.9% increase in construction spending.
2:00 PM: Senior Loan Officer Opinion Survey on Bank Lending Practices for January.
10:00 AM: Corelogic House Price index for December.
10:00 AM: the Q4 2020 Housing Vacancies and Homeownership from the Census Bureau.
 All day: Light vehicle sales for January. The consensus is for light vehicle sales to be 16.3 million SAAR in January, unchanged from 16.3 million in December (Seasonally Adjusted Annual Rate).
This graph shows light vehicle sales since the BEA started keeping data in 1967. The dashed line is the December sales rate.
7:00 AM ET: The Mortgage Bankers Association (MBA) will release the results for the mortgage purchase applications index.
8:15 AM: The ADP Employment Report for January. This report is for private payrolls only (no government). The consensus is for 45,000 payroll jobs added in January, up from 123,000 lost in December.
10:00 AM: the ISM Services Index for January.
8:30 AM: The initial weekly unemployment claims report will be released. The consensus is for a decrease to 820 thousand from 847 thousand last week.
 8:30 AM: Employment Report for January. The consensus is for 50 thousand jobs added, and for the unemployment rate to be unchanged at 6.7%. There were 140 thousand jobs lost in December, and the unemployment rate was at 6.7%.
This graph shows the job losses from the start of the employment recession, in percentage terms.
The current employment recession was by far the worst recession since WWII in percentage terms, and the worst in terms of the unemployment rate.
 8:30 AM: Trade Balance report for December from the Census Bureau.
 This graph shows the U.S. trade deficit, with and without petroleum, through the most recent report. The blue line is the total deficit, and the black line is the petroleum deficit, and the red line is the trade deficit ex-petroleum products.
The consensus is the trade deficit to be $65.7 billion. The U.S. trade deficit was at $68.1 billion in November.
Friday, January 29, 2021
January 29 COVID-19 Test Results and Vaccinations
by Calculated Risk on 1/29/2021 08:04:00 PM
The reason I'm posting COVID data is this matters for the economy. From the FOMC statement this week:
"The path of the economy will depend significantly on the course of the virus, including progress on vaccinations."It appears the 7-day average cases has peaked. Stay safe! I'm looking forward to not posting this data soon.
"Vaccinations in the U.S. began Dec. 14 with health-care workers, and so far 28.9 million shots have been given, according to a state-by-state tally by Bloomberg and data from the Centers for Disease Control and Prevention. In the last week, an average of 1.30 million doses per day were administered."Also check out the graphs at COVID-19 Vaccine Projections The site has several interactive graphs related to US COVID vaccinations including a breakdown of how many have had one shot, and how many have had both shots.
The US is now averaging close to 2 million tests per day. Based on the experience of other countries, for adequate test-and-trace (and isolation) to reduce infections, the percent positive needs to be under 5% (probably close to 1%), so the US has far too many daily cases - and percent positive - to do effective test-and-trace.
There were 1.9 million test results reported over the last 24 hours.
There were 165 thousand positive tests.
Over 90,000 US deaths have been reported so far in January, surpassing December as the deadliest month. See the graph on US Daily Deaths here.
 Click on graph for larger image.
This data is from the COVID Tracking Project.
The percent positive over the last 24 hours was 8.7% (red line is 7 day average). The percent positive is calculated by dividing positive results by total tests (including pending).
And check out COVID Act Now to see how each state is doing. (updated link to new site)
 The second graph shows the 7 day average of positive tests reported and daily hospitalizations.
It seems likely cases and hospitalizations have peaked, but are declining from a very high level.
Fannie Mae: Mortgage Serious Delinquency Rate Decreased in December
by Calculated Risk on 1/29/2021 04:26:00 PM
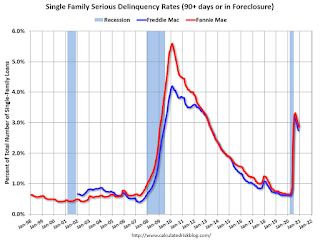
Fannie Mae reported that the Single-Family Serious Delinquency decreased to 2.87% in December, from 2.96% in November. The serious delinquency rate is up from 0.66% in December 2019.
These are mortgage loans that are "three monthly payments or more past due or in foreclosure".
The Fannie Mae serious delinquency rate peaked in February 2010 at 5.59%.

By vintage, for loans made in 2004 or earlier (2% of portfolio), 5.88% are seriously delinquent (up from 5.87% in November). For loans made in 2005 through 2008 (2% of portfolio), 9.98% are seriously delinquent (down from 10.00%), For recent loans, originated in 2009 through 2018 (95% of portfolio), 2.39% are seriously delinquent (down from 2.48%). So Fannie is still working through a few poor performing loans from the bubble years.
Mortgages in forbearance are counted as delinquent in this monthly report, but they will not be reported to the credit bureaus.
This is very different from the increase in delinquencies following the housing bubble. Lending standards have been fairly solid over the last decade, and most of these homeowners have equity in their homes - and they will be able to restructure their loans once they are employed.
Freddie Mac: Mortgage Serious Delinquency Rate decreased in December
by Calculated Risk on 1/29/2021 01:46:00 PM
Freddie Mac reported that the Single-Family serious delinquency rate in December was 2.64%, down from 2.75% in November. Freddie's rate is up from 0.63% in December 2019.
Freddie's serious delinquency rate peaked in February 2010 at 4.20%.
These are mortgage loans that are "three monthly payments or more past due or in foreclosure".

Mortgages in forbearance are being counted as delinquent in this monthly report, but they will not be reported to the credit bureaus.
This is very different from the increase in delinquencies following the housing bubble. Lending standards have been fairly solid over the last decade, and most of these homeowners have equity in their homes - and they will be able to restructure their loans once (if) they are employed.
Also - for multifamily - delinquencies were at 0.16%, unchanged from 0.16% in November, and up double from 0.08% in December 2019.
GDP Forecasts: Q1 and 2021
by Calculated Risk on 1/29/2021 11:28:00 AM
Some forecasters are increasing their 2021 forecasts significantly, and see possible further upside. However, there is ongoing concern about the pandemic, and the impact of the COVID variants.
From Merrrill Lynch on 2021:
We have become increasingly convinced of the prospects for exceptional growth this year. We came into the year with an above-consensus forecast of 4.5% which was boosted to 5.0% upon the earlier passage of stimulus. As we have been warning, we are now taking another leap forward and forecasting 6.0% growth this year [Jan 29 estimate] emphasis addedFrom Goldman Sachs on 2021:
[O]ur 2021 growth forecast—which currently stands 2½pp above consensus at +6.6% on a full-year basis ... there are significant upside risks as well. [Jan 29 estimate]From the NY Fed Nowcasting Report
The New York Fed Staff Nowcast stands at 6.5% for 2021:Q1. [Jan 29 estimate]And from the Altanta Fed: GDPNow
The initial GDPNow model estimate for real GDP growth (seasonally adjusted annual rate) in the first quarter of 2021 is 5.2 percent on January 29. [Jan 29 estimate]
NAR: Pending Home Sales Decrease 0.3% in December
by Calculated Risk on 1/29/2021 10:05:00 AM
From the NAR: Pending Home Sales Inch Back 0.3% in December
Despite dropping slightly in the last month of 2020, the latest pending home sales registered as the highest ever recorded in the month of December, according to the National Association of Realtors®. The decrease marks the fourth consecutive month of month-over-month declines. While contract transitions fell in one of the four major U.S. regions, activity climbed or remained flat in the three other areas. Compared to a year ago, all four regions witnessed double-digit gains in pending home sales transactions.This was slightly above expectations for this index. Note: Contract signings usually lead sales by about 45 to 60 days, so this would usually be for closed sales in January and February.
The Pending Home Sales Index (PHSI),a forward-looking indicator of home sales based on contract signings, waned 0.3% to 125.5 in December. Year-over-year, contract signings jumped 21.4%. An index of 100 is equal to the level of contract activity in 2001.
...
The Northeast PHSI rose 3.1% to 112.0 in December, a 22.1% increase from a year ago. In the Midwest, the index fell 3.6% to 111.7 last month, up 13.9% from December 2019.
Pending home sales in the South increased 0.1% to an index of 150.6 in December, up 26.6% from December 2019. The index in the West was unchanged in December, remaining at 111.3, which is up 18.9% from a year ago.
emphasis added


