 RSS Feed
 by Calculated Risk on 11/17/2020 09:15:00 PM
Tuesday, November 17, 2020
Wednesday: Housing Starts
Wednesday:
• At 7:00 AM ET, The Mortgage Bankers Association (MBA) will release the results for the mortgage purchase applications index.
• At 8:30 AM, Housing Starts for October. The consensus is for 1.460 million SAAR, up from 1.415 million SAAR.
• During the day, The AIA's Architecture Billings Index for October (a leading indicator for commercial real estate).
November 17 COVID-19 Test Results; Record Hospitalizations
by Calculated Risk on 11/17/2020 07:57:00 PM
The end of the pandemic is coming, possibly by Q2 2021!
Please be careful, especially over the holidays. Thanksgiving, Christmas and New Years will be tough this year, but keep your guard up - plan now to have a safe holiday.
The US is now averaging over 1 million tests per day. Based on the experience of other countries, for adequate test-and-trace (and isolation) to reduce infections, the percent positive needs to be well under 5% (probably close to 1%), so the US still needs to increase the number of tests per day significantly (or take actions to push down the number of new infections).
There were 1,243,225 test results reported over the last 24 hours.
There were 155,201 positive tests.
Almost 17,500 US deaths have been reported so far in November. See the graph on US Daily Deaths here.
 Click on graph for larger image.
This data is from the COVID Tracking Project.
The percent positive over the last 24 hours was 12.5% (red line is 7 day average). The percent positive is calculated by dividing positive results by the sum of negative and positive results (I don't include pending).
And check out COVID Exit Strategy to see how each state is doing.
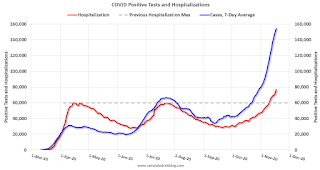 The second graph shows the 7 day average of positive tests reported and daily hospitalizations.
The dashed line is the previous hospitalization maximum.
Note that there were very few tests available in March and April, and many cases were missed, so the hospitalizations was higher relative to the 7-day average of positive tests in July.
• 7-day average cases are at a new record.
• 7-day average deaths at highest since May.
• Record Hospitalizations.
Lawler: Early Read on Existing Home Sales in October
by Calculated Risk on 11/17/2020 05:09:00 PM
From housing economist Tom Lawler:
Based on publicly-available local realtor/MLS reports released across the country through today, I project that existing home sales as estimated by the National Association of Realtors ran at a seasonally adjusted annual rate of 6.63 million in October, up 1.4% from September’s preliminary pace and up 22.6% from last October’s seasonally adjusted pace. I should note that several state and local realtor reports that would normally be available at this time of the month have not yet been released, and as a result my sample size is smaller than normal.
Local realtor reports, as well as reports from national inventory trackers, suggest that the YOY decline in the inventory of existing homes for sale was about the same in October as it was in September, though what that means for the NAR inventory estimate is unclear. As I’ve noted before, the inventory measure in most publicly-released local realtor/MLS reports excludes listings with pending contracts, but that is not the case for many of the reports sent to the NAR (referred to as the “NAR Report!”), Since the middle of last Spring inventory measures excluding pending listings have fallen much more sharply than inventory measures including such listings, and this latter inventory measure understates the decline in the effective inventory of homes for sale over the last several months.
Finally, local realtor/MLS reports suggest the median existing single-family home sales price last month was up by 14% from last October.
CR Note: The National Association of Realtors (NAR) is scheduled to release October existing home sales on Thursday, November 19, 2020 at 10:00 AM ET. The consensus is for 6.45 million SAAR.
Phoenix Real Estate in October: Sales Up 23.5% YoY, Active Inventory Down 42% YoY
by Calculated Risk on 11/17/2020 04:32:00 PM
The Arizona Regional Multiple Listing Service (ARMLS) reports ("Stats Report"):
1) Overall sales were at 9,690 in October, up from 9,305 in September, and up from 7,850 in October 2019. Sales were up 4.1% from September 2020 (last month), and up 23.5% from October 2019.
2) Active inventory was at 8,343, down from 14,427 in October 2019. That is down 42% year-over-year.
3) Months of supply decreased to 1.41 in October from 1.48 in September. This is very low.
Sales are reported at the close of escrow, so these sales were mostly signed in August and September.
NY Fed Q3 Report: "Total Household Debt Increased in Q3 2020, Led by Surge in New Credit Extensions"
by Calculated Risk on 11/17/2020 11:09:00 AM
From the NY Fed: Total Household Debt Increased in Q3 2020, Led by Surge in New Credit Extensions; Mortgage Originations, Including Refinances, Continue to Soar
The Federal Reserve Bank of New York's Center for Microeconomic Data today issued its Quarterly Report on Household Debt and Credit, which shows that total household debt increased by $87 billion (0.6%) to $14.35 trillion in the third quarter of 2020. The increase more than offset the decline seen in the second quarter of 2020 as total household debt has surpassed its 2020Q1 reading. The Report is based on data from the New York Fed's Consumer Credit Panel, a nationally representative sample of individual- and household-level debt and credit records drawn from anonymized Equifax credit data. This latest report reflects consumer credit data as of September 30, 2020.
Mortgage balances—the largest component of household debt—rose by $85 billion in the third quarter, and sat at $9.86 trillion on September 30. Mortgage originations, which include refinances, were at $1.05 trillion, the second highest volume in the history of the series and second only to the historic refinance boom in 2003Q3. Balances on home equity lines of credit saw a $13 billion decline, their 15th consecutive decrease since 2016Q4, bringing the outstanding balance to $362 billion.
...
Aggregate delinquency rates across all debt products fell again in the third quarter, indicating the ongoing effect of forbearances provided by the CARES Act or voluntarily offered by lenders. New transitions into early delinquency have also fallen across product type. The various forbearance offerings and uptake have largely protected borrowers' credit files from being marked delinquent from missed payments. As of September 30, 3.4% of outstanding debt was in some stage of delinquency, a 0.2 percentage point decrease from the second quarter, and 1.4 percentage points lower than the rate observed in 2019Q4. About 132,000 consumers had a bankruptcy notation added to their credit reports in 2020Q3, a decline from the previous quarter and a new historical low.
emphasis added
 Click on graph for larger image.
Here are two graphs from the report:
The first graph shows aggregate consumer debt decreased in Q3. Household debt previously peaked in 2008, and bottomed in Q3 2013.
From the NY Fed:
Aggregate household debt balances increased by $87 billion in the third quarter of 2020, a 0.6% rise from 2020Q2, and now stand at $14.35 trillion. The increase offsets the decline seen in the second quarter of 2020. Balances are $1.68 trillion higher, in nominal terms, than the 2008Q3 peak of $12.68 trillion and 28.7% above the 2013Q2 trough.
 The second graph shows the percent of debt in delinquency.
The overall delinquency rate decreased in Q3. From the NY Fed:
Aggregate delinquency rates have dropped markedly in the second and third quarter, reflecting an uptake in forbearances (provided by both the CARES Act and voluntarily offered by lenders), which protect borrowers’ credit records from the reporting of skipped or deferred payments. Note that accounts in forbearance might be categorized as delinquent on the lender’s book, but typically as current on the credit reports. As of September 30, 3.4% of outstanding debt was in some stage of delinquency, a 0.2 percentage point decrease from the second quarter, and 1.4 percentage points lower than the rate observed in the fourth quarter of 2019 and before the Covid pandemic hit the United States. Of the $485 billion of debt that is delinquent, $363 billion is seriously delinquent (at least 90 days late or “severely derogatory”, which includes some debts that have been removed from lenders books but upon which they continue to attempt collection).There is much more in the report.
The uptake in forbearances continues to be visible in the delinquency transition rates for mortgages. The share of mortgages that transitioned to early delinquency remained at a very low 0.5%, as the option to enter forbearance remained. Meanwhile, 47% of loans in early delinquency transitioned to current. There were only 16,000 new foreclosure starts; given that homeowners with federally backed mortgages are currently protected from foreclosure through a moratorium in the CARES Act.
NAHB: Builder Confidence Increased to 90 in November, Record High
by Calculated Risk on 11/17/2020 10:06:00 AM
The National Association of Home Builders (NAHB) reported the housing market index (HMI) was at 90, up from 85 in October. Any number above 50 indicates that more builders view sales conditions as good than poor.
From the NAHB: Sales Growth Lifts Builder Confidence to New Record High
In another sign that housing continues to lead the economy forward, builder confidence in the market for newly-built single-family homes increased five points to 90 in November, shattering the previous all-time of 85 recorded in October, according to the latest NAHB/Wells Fargo Housing Market Index (HMI) released today. Builder confidence levels have hit successive all-time highs over the past three months.
“Historically low mortgage rates, favorable demographics and an ongoing suburban shift for home buyer preferences have spurred demand and increased new home sales by nearly 17% in 2020 on a year-to-date basis,” said NAHB Chairman Chuck Fowke. “Though builders continue to sign sales contracts at a solid pace, lot and material availability is holding back some building activity. Looking ahead to next year, regulatory policy risk will be a key concern given these supply-side constraints.”
“Another record high for the HMI reflects that housing is a bright spot for the economy,” said NAHB Chief Economist Robert Dietz. “However, affordability remains an ongoing concern, as construction costs continue to rise and interest rates are expected to move higher as more positive news emerges on the coronavirus vaccine front. In the short run, the shift of housing demand to lower density markets such as suburbs and exurbs with ongoing low resale inventory levels is supporting demand for home building.”
...
All the HMI indices posted their highest readings ever in November. The HMI index gauging current sales conditions rose six points to 96, the component measuring sales expectations in the next six months increased one point to 89 and the measure charting traffic of prospective buyers rose three points to 77.
Looking at the three-month moving averages for regional HMI scores, the Northeast increased two points to 83, the Midwest jumped six points to 80, the South rose four points to 86 and the West increased four points to 94.
 Click on graph for larger image.
This graph show the NAHB index since Jan 1985.
This was above the consensus forecast.
Housing and homebuilding have been one of the best performing sectors during the pandemic.
Industrial Production Increased 1.1 Percent in October; 5.6% Below Pre-Crisis Level
by Calculated Risk on 11/17/2020 09:27:00 AM
From the Fed: Industrial Production and Capacity Utilization
Industrial production rose 1.1 percent in October. The index has recovered much of its 16.5 percent decline from February to April, but output in October was still 5.6 percent lower than its pre-pandemic February level. After edging up 0.1 percent in September, manufacturing output increased 1.0 percent in October. The output of utilities rose 3.9 percent, while the output at mines declined 0.6 percent to a level that was 14.4 percent below its year-earlier reading. At 103.2 percent of its 2012 average, total industrial production was 5.3 percent lower in October than it was a year earlier. Capacity utilization for the industrial sector increased 0.8 percentage point in October to 72.8 percent, a rate that is 7.0 percentage points below its long-run (1972–2019) average but 8.6 percentage points above its low in April.
emphasis added
 Click on graph for larger image.
This graph shows Capacity Utilization. This series is up from the record low set in April, but still well below the level in February 2020.
Capacity utilization at 72.8% is 7.0% below the average from 1972 to 2017.
Note: y-axis doesn't start at zero to better show the change.
 The second graph shows industrial production since 1967.
Industrial production increased in October to 103.2. This is 5.6% below the February 2020 level.
The change in industrial production was close to consensus expectations, and industrial production in August and September were revised up.
Retail Sales increased 0.3% in October
by Calculated Risk on 11/17/2020 08:37:00 AM
On a monthly basis, retail sales increased 0.3 percent from September to October (seasonally adjusted), and sales were up 5.7 percent from October 2019.
From the Census Bureau report:
Advance estimates of U.S. retail and food services sales for October 2020, adjusted for seasonal variation and holiday and trading-day differences, but not for price changes, were $553.3 billion, an increase of 0.3 percent from the previous month, and 5.7 percent above October 2019. Total sales for the August 2020 through October 2020 period were up 5.1 percent from the same period a year ago. The August 2020 to September 2020 percent change was revised from up 1.9 percent to up 1.6 percent.
emphasis added
 Click on graph for larger image.
This graph shows retail sales since 1992. This is monthly retail sales and food service, seasonally adjusted (total and ex-gasoline).
Retail sales ex-gasoline were up 0.2% in October.
The second graph shows the year-over-year change in retail sales and food service (ex-gasoline) since 1993.
 Retail and Food service sales, ex-gasoline, increased by 7.1% on a YoY basis.
The increase in October was below expectations, however sales in August and September were revised up, combined.
Monday, November 16, 2020
Tuesday: Retail Sales, Industrial Production, Homebuilder Confidence
by Calculated Risk on 11/16/2020 10:38:00 PM
Tuesday:
• At 8:30 AM ET, Retail sales for October will be released. The consensus is for a 0.5% increase in retail sales.
• At 9:15 AM, The Fed will release Industrial Production and Capacity Utilization for October. The consensus is for a 1.0% increase in Industrial Production, and for Capacity Utilization to increase to 72.4%.
• At 10:00 AM, The November NAHB homebuilder survey. The consensus is for a reading of 85, unchanged from 85. Any number above 50 indicates that more builders view sales conditions as good than poor.
• At 11:00 AM, NY Fed: Q3 Quarterly Report on Household Debt and Credit
November 16 COVID-19 Test Results; Record Hospitalizations
by Calculated Risk on 11/16/2020 06:50:00 PM
More good news with the initial Moderna vaccine results released today. The end of the pandemic is coming, possibly by Q2 2021!
Please be careful, especially over the holidays. Thanksgiving, Christmas and New Years will be tough this year, but keep your guard up - plan now to have a safe holiday.
The US is now averaging over 1 million tests per day. Based on the experience of other countries, for adequate test-and-trace (and isolation) to reduce infections, the percent positive needs to be well under 5% (probably close to 1%), so the US still needs to increase the number of tests per day significantly (or take actions to push down the number of new infections).
There were 1,251,892 test results reported over the last 24 hours.
There were 148,532 positive tests. Highest for a Monday.
Almost 16,000 US deaths have been reported so far in November. See the graph on US Daily Deaths here.
 Click on graph for larger image.
This data is from the COVID Tracking Project.
The percent positive over the last 24 hours was 11.9% (red line is 7 day average). The percent positive is calculated by dividing positive results by the sum of negative and positive results (I don't include pending).
And check out COVID Exit Strategy to see how each state is doing.
 The second graph shows the 7 day average of positive tests reported and daily hospitalizations.
The dashed line is the previous hospitalization maximum.
Note that there were very few tests available in March and April, and many cases were missed, so the hospitalizations was higher relative to the 7-day average of positive tests in July.
• 7-day average cases are at a new record.
• Record Hospitalizations.


