by Calculated Risk on 10/02/2020 08:42:00 AM
Friday, October 02, 2020
September Employment Report: 661 Thousand Jobs Added, 7.9% Unemployment Rate
From the BLS:
Total nonfarm payroll employment rose by 661,000 in September, and the unemployment rate declined to 7.9 percent, the U.S. Bureau of Labor Statistics reported today. These improvements in the labor market reflect the continued resumption of economic activity that had been curtailed due to the coronavirus (COVID-19) pandemic and efforts to contain it. In September, notable job gains occurred in leisure and hospitality, in retail trade, in health care and social assistance, and in professional and business services. Employment in government declined over the month, mainly in state and local government education.
...
In September, the unemployment rate declined by 0.5 percentage point to 7.9 percent, and the number of unemployed persons fell by 1.0 million to 12.6 million. Both measures have declined for 5 consecutive months but are higher than in February, by 4.4 percentage points and 6.8 million, respectively.
...
The change in total nonfarm payroll employment for July was revised up by 27,000, from +1,734,000 to +1,761,000, and the change for August was revised up by 118,000, from +1,371,000 to +1,489,000. With these revisions, employment in July and August combined was 145,000 more than previously reported.
emphasis added
 Click on graph for larger image.
The first graph shows the year-over-year change in total non-farm employment since 1968.
In September, the year-over-year change was negative 9.65 million jobs.
Total payrolls increased by 661 thousand in September.
Payrolls for July and August were revised up 145 thousand combined.
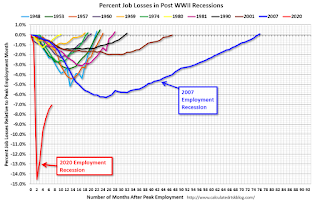
 The second graph shows the job losses from the start of the employment recession, in percentage terms.
The current employment recession is by far the worst recession since WWII in percentage terms, and is still worse than the worst of the "Great Recession".
The third graph shows the employment population ratio and the participation rate.
 The Labor Force Participation Rate decreased to 61.4% in September. This is the percentage of the working age population in the labor force.
 The Employment-Population ratio increased to 56.6% (black line).
I'll post the 25 to 54 age group employment-population ratio graph later.
 The fourth graph shows the unemployment rate.
 The unemployment rate decreased in September to 7.9%.
This was below consensus expectations, however July and August were revised up by 145,000 combined.
I'll have much more later …
Thursday, October 01, 2020
September Employment Preview
by Calculated Risk on 10/01/2020 09:00:00 PM
On Friday at 8:30 AM ET, the BLS will release the employment report for September. The consensus is for 850 thousand jobs added, and for the unemployment rate to decrease to 8.2%.
The decennial Census will subtract 41,400 temporary jobs. Also, due to the delays in school openings, it is likely the education will show a solid decline since many schools are online (support staff will probably be lower than usual).
The ADP employment report showed a gain of 749,000 private sector jobs, above the consensus estimate of 605 thousand jobs. The ADP report hasn't been very useful in predicting the BLS report, but this suggests the BLS report could be weaker than expected.
The ISM manufacturing employment index increased in September to 49.6% from, 46.3% in August. This would suggest few manufacturing jobs added in September - although ADP showed 130,000 manufacturing jobs added!
The weekly claims report showed a high number total continuing unemployment claims during the reference week, although this might not be very useful right now.
There are other indicators that analysts are looking at - like Homebase hours worked and Kronos (see Ernie Tedeschi comments).
Homebase data has flatlined in recent weeks. Pairing their data with UI claims yields a forecast of +290K jobs in September, not seasonally adjusted.Goldman Sachs forecasts:
Kronos meanwhile has accelerated. Using them instead leads to a +2.4 million forecast.
We estimate nonfarm payrolls rose 1.1mn in September ... We estimate the unemployment rate declined by three tenths to 8.1%.And Merrill Lynch forecasts: "We expect nonfarm payroll growth of 800k in September and the unemployment rate to improve to 8.1% from 8.4%."
• Conclusion: There is a wide range of estimates for the September report. The employment related data has been all over the place. My guess is the report will be lower than the consensus.
October 1 COVID-19 Test Results
by Calculated Risk on 10/01/2020 07:32:00 PM
The US is now mostly reporting 700 thousand to 1 million tests per day. Based on the experience of other countries, the percent positive needs to be well under 5% to really push down new infections (probably close to 1%), so the US still needs to increase the number of tests per day significantly (or take actions to push down the number of new infections).
There were 805,559 test results reported over the last 24 hours.
There were 45,694 positive tests.
847 Americans deaths from COVID have been reported in October. See the graph on US Daily Deaths here.

This data is from the COVID Tracking Project.
The percent positive over the last 24 hours was 5.7% (red line is 7 day average).
For the status of contact tracing by state, check out testandtrace.com.
And check out COVID Exit Strategy to see how each state is doing.

The dashed line is the June low.
Note that there were very few tests available in March and April, and many cases were missed (the percent positive was very high - see first graph). By June, the percent positive had dropped below 5%.
If people stay vigilant, the number of cases might drop to the June low towards the end of October (that would still be a large number of new cases, but progress).
Goldman September Payrolls Preview
by Calculated Risk on 10/01/2020 05:50:00 PM
A few brief excerpts from a note by Goldman Sachs economist Spencer Hill:
We estimate nonfarm payrolls rose 1.1mn in September, above consensus of +0.875mn. High-frequency labor market information indicates strong September job gains, and the second derivative improvement in the public-health situation suggests scope for a pickup in Sun Belt job growth. ...CR Note: The consensus is for 850 thousand jobs added, and for the unemployment rate to decrease to 8.2%.
We estimate the unemployment rate declined by three tenths to 8.1%.
emphasis added
Zillow Case-Shiller Forecast: Year-over-year House Price Growth to Increase Significantly in August
by Calculated Risk on 10/01/2020 02:40:00 PM
The Case-Shiller house price indexes for July were released Tuesday. Zillow forecasts Case-Shiller a month early, and I like to check the Zillow forecasts since they have been pretty close.
From Matthew Speakman at Zillow: July Case-Shiller Results and August Forecast: Pushing Decisively Higher
Home prices continued to push pandemic-related uncertainties aside and reach new heights into the summer months, as demand for housing outpaced supply....
...
An unprecedented lack of for-sale homes combined with persistently low mortgage rates have stoked a competition for housing in recent months that will not relent. Sales volume has held firm at a time when it would normally show signs of cooling, and home prices continue to push decisively higher. The question now is how much longer this will continue. While coronavirus-related developments will dictate the path forward for the economy, thus far, the housing market has withstood basically every obstacle that the pandemic has thrown its way, and home prices have grown without restriction. With mortgage rates poised to remain low for the near future, barring a sudden surge in inventory, it appears that upward price pressures should endure into the fall.
Annual growth in August as reported by Case-Shiller is expected to accelerate in all three main indices. S&P Dow Jones Indices is expected to release data for the August S&P CoreLogic Case-Shiller Indices on Tuesday, October 27.
emphasis added
 The Zillow forecast is for the year-over-year change for the Case-Shiller National index to be at 5.3% in August, up from 4.8% in July.
 The Zillow forecast is for the 20-City index to be up 4.5% YoY in August from 3.9% in July, and for the 10-City index to increase to be up 3.9% YoY compared to 3.3% YoY in July.
Hotels: Occupancy Rate Declined 31.5% Year-over-year
by Calculated Risk on 10/01/2020 11:42:00 AM
From HotelNewsNow.com: STR: U.S. hotel results for week ending 26 September
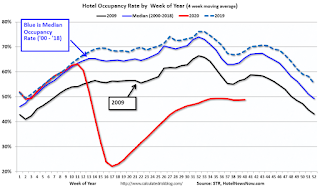
U.S. hotel occupancy remained nearly flat from the previous week, according to the latest data from STR through 26 September.The following graph shows the seasonal pattern for the hotel occupancy rate using the four week average.
20-26 September 2020 (percentage change from comparable week in 2019):
• Occupancy: 48.7% (-31.5%)
• Average daily rate (ADR): US$96.38 (-29.6%)
• Revenue per available room (RevPAR): US$46.96 (-51.7%)
...
Most of the markets with the highest occupancy levels were those in areas with displaced residents from natural disasters. Affected by Hurricane Sally, Mobile, Alabama, reported the week’s highest occupancy level at 74.9%. Amid continued wildfires, California South/Central was next at 74.3%.
emphasis added
 Click on graph for larger image.
The red line is for 2020, dash light blue is 2019, blue is the median, and black is for 2009 (the worst year since the Great Depression for hotels - before 2020).
There was some recent boost from natural disasters - perhaps 1 or 2 percentage points total based on previous disasters - but so far there has been little business travel pickup that usually happens in the Fall.
Note: Y-axis doesn't start at zero to better show the seasonal change.
ISM Manufacturing index Decreased to 55.4 in September
by Calculated Risk on 10/01/2020 10:24:00 AM
The ISM manufacturing index indicated expansion in September. The PMI was at 55.4% in September, down from 56.0% in August. The employment index was at 49.6%, up from 46.3% last month, and the new orders index was at 60.2%, down from 67.6%.
From ISM: PMI® at 55.4% September 2020 Manufacturing ISM® Report On Business®
Economic activity in the manufacturing sector grew in September, with the overall economy notching a fifth consecutive month of growth, say the nation's supply executives in the latest Manufacturing ISM® Report On Business®.This was below expectations of 56.2%, and the employment index improved, but indicated some further slight contraction.
The report was issued today by Timothy R. Fiore, CPSM, C.P.M., Chair of the Institute for Supply Management® (ISM®) Manufacturing Business Survey Committee: "The September PMI® registered 55.4 percent, down 0.6 percentage point from the August reading of 56 percent. This figure indicates expansion in the overall economy for the fifth month in a row after a contraction in April, which ended a period of 131 consecutive months of growth. The New Orders Index registered 60.2 percent, a decrease of 7.4 percentage points from the August reading of 67.6 percent. The Production Index registered 61 percent, down 2.3 percentage points compared to the August reading of 63.3 percent. The Backlog of Orders Index registered 55.2 percent, 0.6 percentage point higher compared to the August reading of 54.6 percent. The Employment Index registered 49.6 percent, an increase of 3.2 percentage points from the August reading of 46.4 percent. The Supplier Deliveries Index registered 59 percent, up 0.8 percentage point from the August figure of 58.2 percent.
This suggests manufacturing expanded at a slightly slower pace in September than in August.
Construction Spending Increased 1.4% in August
by Calculated Risk on 10/01/2020 10:17:00 AM
From the Census Bureau reported that overall construction spending decreased in June:
Construction spending during August 2020 was estimated at a seasonally adjusted annual rate of $1,412.8 billion, 1.4 percent above the revised July estimate of $1,392.7 billion. The August figure is 2.5 percent above the August 2019 estimate of $1,379.0 billion.Both private and public spending increased:
emphasis added
Spending on private construction was at a seasonally adjusted annual rate of $1,061.4 billion, 1.9 percent above the revised July estimate of $1,041.7 billion. ...
In August, the estimated seasonally adjusted annual rate of public construction spending was $351.4 billion, 0.1 percent above the revised July estimate of $350.9 billion.
 Click on graph for larger image.
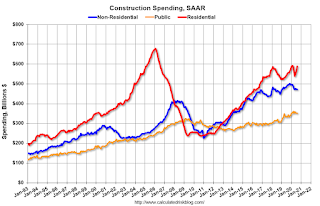
This graph shows private residential and nonresidential construction spending, and public spending, since 1993. Note: nominal dollars, not inflation adjusted.
Residential spending is 13% below the previous peak.
Non-residential spending is 14% above the previous peak in January 2008 (nominal dollars), but has been weak recently.
Public construction spending is 8% above the previous peak in March 2009, and 34% above the austerity low in February 2014.
 The second graph shows the year-over-year change in construction spending.
On a year-over-year basis, private residential construction spending is up 6.7%. Non-residential spending is down 4.3% year-over-year. Public spending is up 5.5% year-over-year.
This was above consensus expectations of a 0.7% increase in spending, and construction spending for the previous two months was revised up.
Construction was considered an essential service in most areas and did not decline sharply like many other sectors, but it seems likely that non-residential, and possibly public spending, will be under pressure.
Personal Income decreased 2.7% in August, Spending increased 1.0%
by Calculated Risk on 10/01/2020 08:56:00 AM
The BEA released the Personal Income and Outlays report for August:
Personal income decreased $543.5 billion (2.7 percent) in August according to estimates released today by the Bureau of Economic Analysis. Disposable personal income (DPI) decreased $570.9 billion (3.2 percent) and personal consumption expenditures (PCE) increased $141.1 billion (1.0 percent).The decrease in personal income was below expectations, and the increase in PCE was above expectations.
Real DPI decreased 3.5 percent in August and Real PCE increased 0.7 percent. The PCE price index increased 0.3 percent. Excluding food and energy, the PCE price index increased 0.3 percent.
The August PCE price index increased 1.4 percent year-over-year and the August PCE price index, excluding food and energy, increased 1.6 percent year-over-year.
The following graph shows real Personal Consumption Expenditures (PCE) since January 2019 through August 2020 (2012 dollars). Note that the y-axis doesn't start at zero to better show the change.
 Click on graph for larger image.
The dashed red lines are the quarterly levels for real PCE.
Note the low level in April (when the economy was partially shutdown). PCE has bounced back, but is still well below the February level.
Weekly Initial Unemployment Claims decreased to 837,000
by Calculated Risk on 10/01/2020 08:40:00 AM
Special technical note this week on California (see release).
The DOL reported:
In the week ending September 26, the advance figure for seasonally adjusted initial claims was 837,000, a decrease of 36,000 from the previous week's revised level. The previous week's level was revised up by 3,000 from 870,000 to 873,000. The 4-week moving average was 867,250, a decrease of 11,750 from the previous week's revised average. The previous week's average was revised up by 750 from 878,250 to 879,000.This does not include the 650,120 initial claims for Pandemic Unemployment Assistance (PUA) that was up from 615,599 the previous week. (There are some questions on PUA numbers).
emphasis added
The following graph shows the 4-week moving average of weekly claims since 1971.
 Click on graph for larger image.
The dashed line on the graph is the current 4-week average. The four-week average of weekly unemployment claims decreased to 867,250.
The previous week was revised up.
The second graph shows seasonally adjust continued claims since 1967 (lags initial by one week).
 At the worst of the Great Recession, continued claims peaked at 6.635 million, but then steadily declined.
Continued claims decreased to 11,767,000 (SA) from 12,747,000 (SA) last week and will likely stay at a high level until the crisis abates.
Note: There are an additional 11,828,338 receiving Pandemic Unemployment Assistance (PUA) that increased from 11,510,888 the previous week (there are questions about these numbers). This is a special program for business owners, self-employed, independent contractors or gig workers not receiving other unemployment insurance.


