by Calculated Risk on 9/27/2020 06:53:00 PM
Sunday, September 27, 2020
September 27 COVID-19 Test Results
The US is now mostly reporting over 700,000 tests per day. Based on the experience of other countries, the percent positive needs to be well under 5% to really push down new infections, so the US still needs to increase the number of tests per day significantly (or take actions to push down the number of new infections).
There were 700,898 test results reported over the last 24 hours.
There were 35,289 positive tests.
Over 21,000 Americans have died from COVID so far in September. See the graph on US Daily Deaths here.

This data is from the COVID Tracking Project.
The percent positive over the last 24 hours was 5.0% (red line is 7 day average).
For the status of contact tracing by state, check out testandtrace.com.
And check out COVID Exit Strategy to see how each state is doing.

The dashed line is the June low.
Note that there were very few tests available in March and April, and many cases were missed (the percent positive was very high - see first graph). By June, the percent positive had dropped below 5%.
If people stay vigilant, the number of cases might drop to the June low some time in October (that would still be a large number of new cases, but progress).
Commercial Real Estate Scarring
by Calculated Risk on 9/27/2020 12:33:00 PM
Here is an article related to some of the commercial real estate (CRE) scarring from the pandemic recession.
From the Financial Times: Destruction of value in US real estate revealed by appraisal data. The article suggests some CRE valuations have declined 25% since early this year.
We will also see a decline in new CRE construction next year based on the recent architect billings, from the AIA: "Architectural billings in August still show little sign of improvement"
And hotel occupancy is down 32% year-over-year, and RevPAR (Revenue per available room) is down over 50% year-over-year.
The most significant damage will be to malls, hotels and some office properties, and also some losses for commercial mortgage-backed securities (CMBS) investors. The goods news is the CMBS market is much smaller than the residential MBS market, and loan-to-values (LTV) are typically much lower for commercial properties than residential. So this will not be a repeat of the housing bubble (or the S&L crisis of the 1980s and early '90s).
Saturday, September 26, 2020
September 26 COVID-19 Test Results
by Calculated Risk on 9/26/2020 06:08:00 PM
The US is now mostly reporting over 700,000 tests per day. Based on the experience of other countries, the percent positive needs to be well under 5% to really push down new infections, so the US still needs to increase the number of tests per day significantly (or take actions to push down the number of new infections).
There were 933,873 test results reported over the last 24 hours.
There were 47,733 positive tests.
Almost 21,000 Americans have died from COVID so far in September. See the graph on US Daily Deaths here.

This data is from the COVID Tracking Project.
The percent positive over the last 24 hours was 5.1% (red line is 7 day average).
For the status of contact tracing by state, check out testandtrace.com.
And check out COVID Exit Strategy to see how each state is doing.

The dashed line is the June low.
Note that there were very few tests available in March and April, and many cases were missed (the percent positive was very high - see first graph). By June, the percent positive had dropped below 5%.
If people stay vigilant, the number of cases might drop to the June low some time in October (that would still be a large number of new cases, but progress).
Schedule for Week of September 27, 2020
by Calculated Risk on 9/26/2020 08:07:00 AM
The key report this week is the September employment report on Friday.
Other key indicators include the third estimate of Q2 GDP, the September ISM manufacturing index, September auto sales, Personal Income and Outlays for August and Case-Shiller house prices for July.
10:30 AM: Dallas Fed Survey of Manufacturing Activity for September. This is the last of the regional surveys for September.
 9:00 AM ET: S&P/Case-Shiller House Price Index for July.
This graph shows the nominal seasonally adjusted National Index, Composite 10 and Composite 20 indexes through the most recent report (the Composite 20 was started in January 2000).
The consensus is for a 3.8% year-over-year increase in the Comp 20 index for July.
7:00 AM ET: The Mortgage Bankers Association (MBA) will release the results for the mortgage purchase applications index.
8:15 AM: The ADP Employment Report for September. This report is for private payrolls only (no government). The consensus is for 605,000 jobs added, up from 428,000 in August.
8:30 AM: Gross Domestic Product, 2nd quarter 2020 (Third estimate). The consensus is that real GDP decreased 31.7% annualized in Q2, unchanged from the second estimate of -31.7%.
9:45 AM: Chicago Purchasing Managers Index for September. The consensus is for a reading of 52.0, up from 51.2 in August.
10:00 AM: Pending Home Sales Index for August. The consensus is 3.2% increase in the index.
8:30 AM: The initial weekly unemployment claims report will be released. Initial claims were 870 thousand the previous week.
8:30 AM: Personal Income and Outlays for August. The consensus is for a 2.2% decrease in personal income, and for a 0.7% increase in personal spending. And for the Core PCE price index to increase 0.3%.
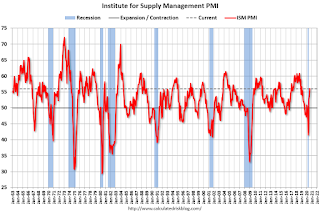 10:00 AM: ISM Manufacturing Index for September. The consensus is for a reading of 56.2, up from 56.0 in August.
Here is a long term graph of the ISM manufacturing index.
The PMI was at 56.0% in August, the employment index was at 46.3%, and the new orders index was at 67.6%.
10:00 AM: Construction Spending for August. The consensus is for a 0.7% increase.
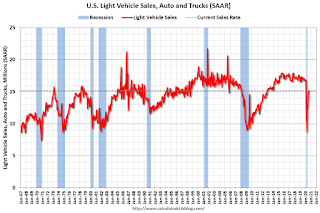 All day: Light vehicle sales for September.
The consensus is for sales of 16.2 million SAAR, up from 15.2 million SAAR in August (Seasonally Adjusted Annual Rate).
This graph shows light vehicle sales since the BEA started keeping data in 1967. The dashed line is the current sales rate.
 8:30 AM: Employment Report for September. The consensus is for 850 thousand jobs added, and for the unemployment rate to decrease to 8.2%.
There were 1.371 million jobs added in August, and the unemployment rate was at 8.4%.
This graph shows the job losses from the start of the employment recession, in percentage terms.
The current employment recession was by far the worst recession since WWII in percentage terms, and the worst in terms of the unemployment rate.
10:00 AM: University of Michigan's Consumer sentiment index (Final for September). The consensus is for a reading of 92.0.
Friday, September 25, 2020
Freddie Mac: Mortgage Serious Delinquency Rate increased in August, Highest Since January 2013
by Calculated Risk on 9/25/2020 08:35:00 PM
Freddie Mac reported that the Single-Family serious delinquency rate in August was 3.17%, up from 3.12% in July. Freddie's rate is up from 0.61% in August 2019.
This is the highest serious delinquency rate since January 2013.
Freddie's serious delinquency rate peaked in February 2010 at 4.20%.
These are mortgage loans that are "three monthly payments or more past due or in foreclosure".
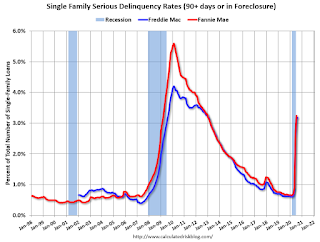
Mortgages in forbearance are being counted as delinquent in this monthly report, but they will not be reported to the credit bureaus.
This is very different from the increase in delinquencies following the housing bubble. Lending standards have been fairly solid over the last decade, and most of these homeowners have equity in their homes - and they will be able to restructure their loans once (if) they are employed.
Note: Fannie Mae will report for August soon.
September 25 COVID-19 Test Results
by Calculated Risk on 9/25/2020 06:48:00 PM
The US is now mostly reporting over 700,000 tests per day. Based on the experience of other countries, the percent positive needs to be well under 5% to really push down new infections, so the US still needs to increase the number of tests per day significantly (or take actions to push down the number of new infections).
There were 907,482 test results reported over the last 24 hours.
There were 50,963 positive tests.
Over 20,000 Americans have died from COVID so far in September. See the graph on US Daily Deaths here.
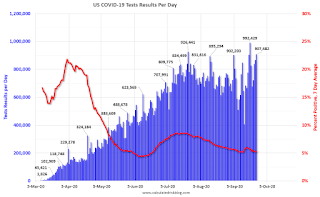
This data is from the COVID Tracking Project.
The percent positive over the last 24 hours was 5.6% (red line is 7 day average).
For the status of contact tracing by state, check out testandtrace.com.
And check out COVID Exit Strategy to see how each state is doing.

The dashed line is the June low.
Note that there were very few tests available in March and April, and many cases were missed (the percent positive was very high - see first graph). By June, the percent positive had dropped below 5%.
If people stay vigilant, the number of cases might drop to the June low some time in October (that would still be a large number of new cases, but progress).
September Vehicle Sales Forecast: 5% Year-over-year Decline
by Calculated Risk on 9/25/2020 04:43:00 PM
From Wards: U.S. Light Vehicle Sales & Inventory Forecast, September 2020 (pay content)

This graph shows actual sales from the BEA (Blue), and Wards forecast for September (Red).
Sales have bounced back from the April low, but are still down year-over-year.
The Wards forecast of 16.2 million SAAR, would be up 6.6% from August, and down 5.2% from September 2019.
This would put sales in 2020, through September, down about 18% compared to the same period in 2019.
Q3 GDP Forecasts
by Calculated Risk on 9/25/2020 11:38:00 AM
From Merrill Lynch:
We expect 2Q GDP to be unrevised at -31.7% qoq saar in the third and final release. We continue to track 27% qoq saar for 3Q GDP. [Sept 25 estimate]From Goldman Sachs:
emphasis added
The details of the durable goods report were broadly consistent with our expectations. We left our Q3 GDP tracking estimate unchanged at +35% (qoq ar). [Sept 25 estimate]From the NY Fed Nowcasting Report
The New York Fed Staff Nowcast stands at 14.1% for 2020:Q3 and 5.0% for 2020:Q4. [Sept 25 estimate]And from the Altanta Fed: GDPNow
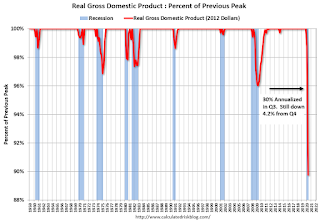
The GDPNow model estimate for real GDP growth (seasonally adjusted annual rate) in the third quarter of 2020 is 32.0 percent on September 25, unchanged from September 17 after rounding. [Sept 25 estimate]It is important to note that GDP is reported at a seasonally adjusted annual rate (SAAR). A 30% annualized increase in Q3 GDP, is about 6.8% QoQ, and would leave real GDP down about 4.2% from Q4 2019.
The following graph illustrates this decline.
 Click on graph for larger image.
This graph shows the percent decline in real GDP from the previous peak (currently the previous peak was in Q4 2019).
This graph is through Q2 2020, and real GDP is currently off 10.2% from the previous peak. For comparison, at the depth of the Great Recession, real GDP was down 4.0% from the previous peak.
The black arrow shows what a 30% annualized increase in real GDP would look like in Q3.
Even with a 30% annualized increase (about 6.8% QoQ), real GDP will be down about 4.2% from Q4 2019; a larger decline in real GDP than at the depth of the Great Recession.
Lawler: Serious Delinquency Rate on FHA-Insured SF Loans Up Again in August
by Calculated Risk on 9/25/2020 09:54:00 AM
From housing economist Tom Lawler: Serious Delinquency Rate on FHA-Insured SF Loans Up Again in August
While the FHA’s “official” monthly loan performance report for August is not yet available on its website, data from the FHA’s Early Warning System indicates that FHA’s Early Warning System indicate that the serious delinquency rate on FHA-insured single-family loans increased to above 11% in August, an all-time monthly high.
Delinquency rates in the EWS do not match those in the official report, but the two delinquency rates tend to move together over time.
| Delinquency Rate, FHA-Insured SF Loans Official Report | ||||
|---|---|---|---|---|
| Total | 30-day | 60-day | SDQ | |
| 2/29/2020 | 10.85% | 5.16% | 1.65% | 4.04% |
| 3/31/2020 | 11.17% | 5.59% | 1.61% | 3.97% |
| 4/30/2020 | 15.52% | 9.20% | 2.28% | 4.04% |
| 5/31/2020 | 17.27% | 6.37% | 5.99% | 4.91% |
| 6/30/2020 | 17.41% | 4.74% | 3.71% | 8.96% |
| 7/31/2020 | 17.24% | 4.15% | 2.51% | 10.58% |
| Early Warning System, Active Servicers | ||||
| 2/29/2020 | 10.63% | 5.16% | 1.66% | 3.81% |
| 3/31/2020 | 10.74% | 5.36% | 1.62% | 3.76% |
| 4/30/2020 | 15.32% | 9.17% | 2.27% | 3.88% |
| 5/31/2020 | 17.15% | 6.37% | 5.99% | 4.80% |
| 6/30/2020 | 17.17% | 4.65% | 3.70% | 8.82% |
| 7/31/2020 | 17.04% | 4.05% | 2.55% | 10.44% |
| 8/31/2020 | 17.43% | 4.07% | 2.20% | 11.17% |
The official Loan Performance Trends Report includes delinquency data for various subcategories, including (Fiscal) Year “Cohorts. Here are some SDQ data by Fiscal Year endorsement.
| FHA SF Serious Delinquency Rate by Fiscal Year1 Cohort | |||
|---|---|---|---|
| 7/31/2020 | 2/29/2020 | 7/31/2019 | |
| All | 10.58% | 4.04% | 3.78% |
| 2015 | 11.65% | 4.54% | 4.07% |
| 2016 | 11.31% | 4.04% | 3.49% |
| 2017 | 11.79% | 4.00% | 3.15% |
| 2018 | 13.14% | 4.32% | 2.49% |
| 2019 | 12.13% | 1.92% | 0.42% |
| 2020 | 5.09% | 0.08% | |
| 1October of the previous to September of the current year | |||
 Click on graph for larger image.
What is striking about these data is that the years with both the largest increases in SDQ’s and the highest SDQ levels were the 2018 and 2019 “cohorts.” These two years were relatively risky books of business, with lower average credit scores compared to the previous 10 years and substantially higher (and never before seen) average debt-to-income ratios than in the previous 10 years.
The surging FHA serious delinquency rate obviously reflects the huge increase in the number of FHA borrowers adversely impacted by the pandemic’s effect on the economy, and most of these seriously delinquent borrowers are in a FHA loan forbearance program. Given this program, combined with the current moratorium on foreclosures, the surging SDQ does not augur any imminent increase in foreclosures.
It does, however, highlight that a sizable number of homeowners (and, presumably, potential homeowners) have been adversely impacted financially by enough to be unable to make their mortgage payments.
This observation, of course, leads one to ask: why have SF family home sales surged by so much this summer?
Obviously, record low mortgage rates have been a catalyst, but it appears as if there has also been a sizeable, pandemic-related shift in the demand for existing householders who have not been materially impacted financially from the pandemic (1) away from urban areas and into suburban (or even more remote) areas, and (2) away from renting in multifamily units and into single-family detached units There has also apparently been a huge increase in demand for second homes, especially but not solely in beach, mountain, and country “resort” areas.
This “discrete” shift in relative demand, combined with limited supply as fewer than normal households already in single-family homes have been moving and listing their property for sale, has already started to put major upward pressure on prices of single-family detached homes, and in some areas of the country have created almost “bubble-like” conditions.
And this discrete shift in demand has played a massively larger role in the surge in SF home sales than “demographics.”
Black Knight: Number of Homeowners in COVID-19-Related Forbearance Plans Decreased
by Calculated Risk on 9/25/2020 08:00:00 AM
Note: Both Black Knight and the MBA (Mortgage Bankers Association) are putting out weekly estimates of mortgages in forbearance.
This data is as of September 22nd.
From Forbearances Down 24% from Peak
The pace of improvement in the number of mortgages in active forbearance increased this week, as the number of plans fell 95K over the past seven days (-2.6%).
This marks five consecutive weeks of improvement and puts us 24% off the peak in late May – a decline of 1.17M plans since that point.
Click on graph for larger image.
As of September 22, 3.6M homeowers remain in COVID-19-related forbearance plans, or 6.8% of all active mortgages, down from 7% last week. Together, they represent $751 billion in unpaid principal.
Servicers continue to proactively assess September-scheduled forbearance expirations for extensions and removals. As of the 22nd, 1.1M forbearance plans are still set to expire this month, down from 1.7M just last week.
...
Over the past month, active forbearance volumes are now down by 9%, with 357k fewer active COVID-19 forbearance plans than at the same time in August. Of the 3.6M loans still in active forbearance, some 78% have had their terms extended at some point since March.
The ongoing COVID-19 pandemic continues to represent significant uncertainty for the weeks ahead. Black Knight will continue to monitor the situation and report our findings on this blog.
emphasis added


