by Calculated Risk on 9/24/2020 06:54:00 PM
Thursday, September 24, 2020
September 24 COVID-19 Test Results
The US is now mostly reporting over 700,000 tests per day. Based on the experience of other countries, the percent positive needs to be well under 5% to really push down new infections, so the US still needs to increase the number of tests per day significantly (or take actions to push down the number of new infections).
There were 887,884 test results reported over the last 24 hours.
There were 44,315 positive tests.
Over 19,000 Americans have died from COVID so far in September. See the graph on US Daily Deaths here.

This data is from the COVID Tracking Project.
The percent positive over the last 24 hours was 5.0% (red line is 7 day average).
For the status of contact tracing by state, check out testandtrace.com.
And check out COVID Exit Strategy to see how each state is doing.

The dashed line is the June low.
Note that there were very few tests available in March and April, and many cases were missed (the percent positive was very high - see first graph). By June, the percent positive had dropped below 5%.
If people stay vigilant, the number of cases might drop to the June low some time in October (that would still be a large number of new cases, but progress).
Black Knight: National Mortgage Delinquency Rate Decreased in August, Serious Delinquencies Rise
by Calculated Risk on 9/24/2020 04:33:00 PM
Note: Loans in forbearance are counted as delinquent in this survey, but those loans are not reported as delinquent to the credit bureaus.
From Black Knight: Early-Stage Delinquencies Improve Further, While Seriously Past-Due Loans Rise; Rate of Improvement Slows
• The divergence between early-stage delinquencies and seriously past-due mortgages continues to widen as fewer delinquent loans cured to current status in AugustAccording to Black Knight's First Look report, the percent of loans delinquent decreased 0.5% in August compared to July, and increased 99% year-over-year.
• Overall, the national delinquency rate fell just 0.03 basis points from July after declining a combined 0.85 basis points over the prior two months, a noticeable slowing in the rate of improvement
• The share of borrowers with a single missed payment had already fallen below pre-pandemic levels; in August, the sum of all early-stage delinquencies (those 30 and 60 days past due) fell 9%, dropping below that benchmark as well
• However, the improvement in early-stage delinquencies was offset by a 5% increase in serious delinquencies – those 90 or more days past due – which have now risen in each of the past five months
• August’s rise in serious delinquencies was the mildest of those five months, suggesting that they may be nearing their peak
• While there are nearly 2 million more seriously delinquent homeowners than at pre-pandemic levels, foreclosure activity remains muted due to active forbearance plans and foreclosure moratoriums
emphasis added
The percent of loans in the foreclosure process decreased 1.4% in August and were down 27% over the last year.
Black Knight reported the U.S. mortgage delinquency rate (loans 30 or more days past due, but not in foreclosure) was 6.88% in August, down from 6.81% in July.
The percent of loans in the foreclosure process decreased slightly in August to 0.35% from 0.36% in July.
The number of delinquent properties, but not in foreclosure, is up 1,866,000 properties year-over-year, and the number of properties in the foreclosure process is down 66,000 properties year-over-year.
| Black Knight: Percent Loans Delinquent and in Foreclosure Process | ||||
|---|---|---|---|---|
| August 2020 | July 2020 | August 2019 | August 2018 | |
| Delinquent | 6.88% | 6.91% | 3.45% | 3.52% |
| In Foreclosure | 0.35% | 0.36% | 0.48% | 0.54% |
| Number of properties: | ||||
| Number of properties that are delinquent, but not in foreclosure: | 3,679,000 | 3,692,000 | 1,813,000 | 1,818,000 |
| Number of properties in foreclosure pre-sale inventory: | 187,000 | 190,000 | 253,000 | 280,000 |
| Total Properties | 3,867,000 | 3,881,000 | 2,066,000 | 2,099,000 |
Hotels: Occupancy Rate Declined 32% Year-over-year
by Calculated Risk on 9/24/2020 02:45:00 PM
From HotelNewsNow.com: STR: US hotel results for week ending 19 September
U.S. hotel occupancy was nearly flat from the previous week, according to the latest data from STR.The following graph shows the seasonal pattern for the hotel occupancy rate using the four week average.
13-19 September 2020 (percentage change from comparable week in 2019):
• Occupancy: 48.6% (-31.9%)
• Average daily rate (ADR): US$95.84 (-28.9%)
• Revenue per available room (RevPAR): US$46.54 (-51.6%)
...
Demand rose slightly (+0.3%), and the highest occupancy markets were once again those housing displaced residents from Hurricane Laura and western wildfires, with California South/Central showing the highest level in the metric (74.7%). The Louisiana South (72.8%) and Louisiana North (72.3%) markets were also among the top five highest occupancy levels for the week.
emphasis added
 Click on graph for larger image.
The red line is for 2020, dash light blue is 2019, blue is the median, and black is for 2009 (the worst year since the Great Depression for hotels - before 2020).
There was some boost by Hurricane Laura and the western fires, but it seems unlikely business travel will pickup significantly in the Fall.
Note: Y-axis doesn't start at zero to better show the seasonal change.
Kansas City Fed: "Tenth District Manufacturing Activity Increased at a Slower Pace" in September
by Calculated Risk on 9/24/2020 12:03:00 PM
From the Kansas City Fed: Tenth District Manufacturing Activity Increased at a Slower Pace
The Federal Reserve Bank of Kansas City released the September Manufacturing Survey today. According to Chad Wilkerson, vice president and economist at the Federal Reserve Bank of Kansas City, the survey revealed that Tenth District manufacturing activity increased at a slower pace in September and remained lower than a year ago, while expectations for future activity were positive.This suggests activity has bottomed, but activity is still below a year ago.
“Regional factory activity expanded again in September but was still below year-ago levels for the majority of firms,” said Wilkerson. “Firms’ expectations for future activity continued to be relatively optimistic, although they anticipated slightly lower wage and salary growth in the year ahead.”
The month-over-month composite index was 11 in September, slightly lower than 14 in August but higher than 3 in July ...The composite index is an average of the production, new orders, employment, supplier delivery time, and raw materials inventory indexes. Activity at non-durable and durable goods factories expanded at a similar pace. The increase in activity at food and beverage manufacturers was slower in September than in previous months, when activity bounced back more sharply. Most month-over-month indexes remained positive, indicating continued expansion. Production, shipments, new orders, and employment rose at a slower pace, while order backlog and supplier delivery time increased. The indexes for employee workweek and new orders for exports dipped slightly, and inventory indexes for materials and finished goods were negative.
emphasis added
A few Comments on August New Home Sales
by Calculated Risk on 9/24/2020 10:28:00 AM
New home sales for August were reported at 1,011,000 on a seasonally adjusted annual rate basis (SAAR). Sales for the previous three months were revised up significantly.
This was well above consensus expectations, and this was the highest sales rate since 2006. Clearly low mortgages rates, low existing home supply, and low sales in March and April (due to the pandemic) have led to a strong increase in sales. Favorable demographics (something I wrote about many times over the last decade) and a surging stock market have probably helped new home sales too.
Earlier: New Home Sales increased to 1,011,000 Annual Rate in August.
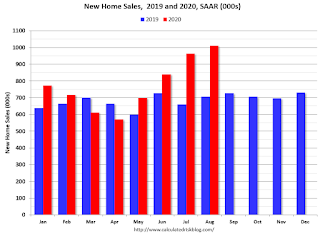
This graph shows new home sales for 2019 and 2020 by month (Seasonally Adjusted Annual Rate).
New home sales were up 43.2% year-over-year (YoY) in August. Year-to-date (YTD) sales are up 14.9%.
And on inventory: since new home sales are reported when the contract is signed - even if the home hasn't been started - new home sales are not limited by inventory. Inventory for new home sales is important in that it means there will be more housing starts if inventory is low (like right now) - and fewer starts if inventory is too high (not now).
Important: No one should get too excited about new home sales as a leading indicator for the economy. Many years ago, I wrote several articles about how new home sales and housing starts (especially single family starts) were some of the best leading indicators, however, I've also noted that there are times when this isn't true. NOW is one of those times.
Currently the course of the economy will be determined by the course of the virus, and New Home Sales tell us nothing about the future of the pandemic. Without the pandemic, I'd obviously be very positive about this report.
New Home Sales increased to 1,011,000 Annual Rate in August
by Calculated Risk on 9/24/2020 10:14:00 AM
The Census Bureau reports New Home Sales in August were at a seasonally adjusted annual rate (SAAR) of 1.011 million.
The previous three months were revised up significantly.
Sales of new single-family houses in August 2020 were at a seasonally adjusted annual rate of 1,011,000, according to estimates released jointly today by the U.S. Census Bureau and the Department of Housing and Urban Development. This is 4.8 percent above the revised July rate of 965,000 and is 43.2 percent above the August 2019 estimate of 706,000.
emphasis added
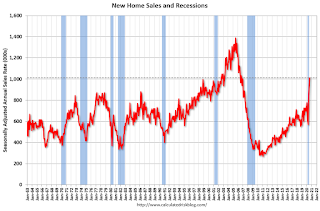 Click on graph for larger image.
The first graph shows New Home Sales vs. recessions since 1963. The dashed line is the current sales rate.
This is the highest sales rate since 2006.
The second graph shows New Home Months of Supply.
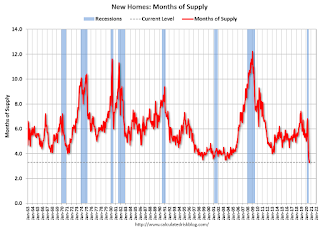 The months of supply decreased in August to 3.3 months from 3.6 months in July.
 This is the all time record low months of supply.
The all time record high was 12.1 months of supply in January 2009.
This is below the normal range (about 4 to 6 months supply is normal).
"The seasonally-adjusted estimate of new houses for sale at the end of August was 282,000. This represents a supply of 3.3 months at the current sales rate. "
 On inventory, according to the Census Bureau:
 "A house is considered for sale when a permit to build has been issued in permit-issuing places or work has begun on the footings or foundation in nonpermit areas and a sales contract has not been signed nor a deposit accepted."Starting in 1973 the Census Bureau broke this down into three categories: Not Started, Under Construction, and Completed.
The third graph shows the three categories of inventory starting in 1973.
The inventory of completed homes for sale is low, and the combined total of completed and under construction is lower than normal.
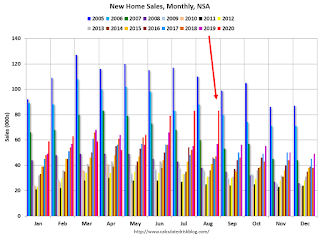 The last graph shows sales NSA (monthly sales, not seasonally adjusted annual rate).
In August 2020 (red column), 83 thousand new homes were sold (NSA). Last year, 57 thousand homes were sold in August.
The all time high for August was 110 thousand in 2005, and the all time low for August was 23 thousand in 2010.
This was well above expectations of 900 thousand sales SAAR, and sales in the three previous months were revised up significantly. I'll have more later today.
Weekly Initial Unemployment Claims increased to 870,000
by Calculated Risk on 9/24/2020 08:37:00 AM
The DOL reported:
In the week ending September 19, the advance figure for seasonally adjusted initial claims was 870,000, an increase of 4,000 from the previous week's revised level. The previous week's level was revised up by 6,000 from 860,000 to 866,000. The 4-week moving average was 878,250, a decrease of 35,250 from the previous week's revised average. The previous week's average was revised up by 1,500 from 912,000 to 913,500.This does not include the 630,080 initial claims for Pandemic Unemployment Assistance (PUA) that was down from 675,154 the previous week. (There are some questions on PUA numbers).
emphasis added
The following graph shows the 4-week moving average of weekly claims since 1971.
 Click on graph for larger image.
The dashed line on the graph is the current 4-week average. The four-week average of weekly unemployment claims decreased to 878,250.
The previous week was revised up.
The second graph shows seasonally adjust continued claims since 1967 (lags initial by one week).
 At the worst of the Great Recession, continued claims peaked at 6.635 million, but then steadily declined.
Continued claims decreased to 12,580,000 (SA) from 12,747,000 (SA) last week and will likely stay at a high level until the crisis abates.
Note: There are an additional 11,510,888 receiving Pandemic Unemployment Assistance (PUA) that decreased from 14,467,064 the previous week (there are questions about these numbers). This is a special program for business owners, self-employed, independent contractors or gig workers not receiving other unemployment insurance.
Wednesday, September 23, 2020
Thursday: New Home Sales, Unemployment Claims
by Calculated Risk on 9/23/2020 09:00:00 PM
Thursday:
• At 8:30 AM ET, The initial weekly unemployment claims report will be released. The consensus is for 840 thousand, down from 860 thousand the previous week.
• At 10:00 AM, New Home Sales for August from the Census Bureau. The consensus is for 900 thousand SAAR, essentially unchanged from 901 thousand in July.
• At 10:00 AM, Testimony, Fed Chair Jerome Powell, Coronavirus Aid, Relief, and Economic Security Act, Before the Committee on Banking, Housing, and Urban Affairs, U.S. Senate
• At 11:00 AM, the Kansas City Fed manufacturing survey for September.
September 23 COVID-19 Test Results
by Calculated Risk on 9/23/2020 07:24:00 PM
The US is now mostly reporting over 700,000 tests per day. Based on the experience of other countries, the percent positive needs to be well under 5% to really push down new infections, so the US still needs to increase the number of tests per day significantly (or take actions to push down the number of new infections).
There were 818,782 test results reported over the last 24 hours.
There were 38,024 positive tests.
Over 18,000 Americans have died from COVID so far in September. See the graph on US Daily Deaths here.
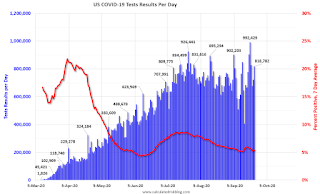
This data is from the COVID Tracking Project.
The percent positive over the last 24 hours was 4.6% (red line is 7 day average).
For the status of contact tracing by state, check out testandtrace.com.
And check out COVID Exit Strategy to see how each state is doing.

The dashed line is the June low.
Note that there were very few tests available in March and April, and many cases were missed (the percent positive was very high - see first graph). By June, the percent positive had dropped below 5%.
If people stay vigilant, the number of cases might drop to the June low some time in October (that would still be a large number of new cases, but progress).
NMHC: Rent Payment Tracker Shows Decline in Households Paying Rent in September
by Calculated Risk on 9/23/2020 12:26:00 PM
From the NMHC: NMHC Rent Payment Tracker Finds 90.1 Percent of Apartment Households Paid Rent as of September 20
he National Multifamily Housing Council (NMHC)’s Rent Payment Tracker found 90.1 percent of apartment households made a full or partial rent payment by September 20 in its survey of 11.4 million units of professionally managed apartment units across the country.
This is a 1.7-percentage point, or 192,936-household decrease from the share who paid rent through September 20, 2019 and compares to 90.0 percent that had paid by August 20, 2020. These data encompass a wide variety of market-rate rental properties across the United States, which can vary by size, type and average rental price.
“This morning’s results show the real-world impact of lawmakers failing in their responsibilities to their constituents,” said Doug Bibby, NMHC President. “Almost 200,000 households have been unable to pay their September rent. Congress and the Trump administration have a proven model in the CARES Act that supported apartment residents through the early months of the pandemic. Now is the time for them to show leadership by once again supporting the millions of Americans who call an apartment home by enacting meaningful rental assistance and mitigating, to some degree, the negative consequences of the nationwide eviction moratorium which jeopardizes the stability of the nation’s housing finance system.”
emphasis added
This graph from the NMHC Rent Payment Tracker shows the percent of household making full or partial rent payments by the 20th of the month.
CR Note: This is mostly for large, professionally managed properties. It appears fewer people are paying their rent this year compared to last year - down 1.7 percentage points from a year ago.
Declining, but not falling off a cliff.


