by Calculated Risk on 7/11/2020 05:33:00 PM
Saturday, July 11, 2020
July 11 COVID-19 Test Results; Highest Percent Positive Since Early May
The US is now conducting over 600,000 tests per day, and that might be enough to allow test-and-trace in some areas. Based on the experience of other countries, the percent positive needs to be well under 5% to really push down new infections, so the US still needs to increase the number of tests per day significantly.
There were 633,974 test results reported over the last 24 hours.
There were 63,007 positive tests.

This data is from the COVID Tracking Project.
The percent positive over the last 24 hours was 9.9% (red line).
For the status of contact tracing by state, check out testandtrace.com.
Hotels: Occupancy Rate Declined 30.2% Year-over-year
by Calculated Risk on 7/11/2020 02:12:00 PM
From HotelNewsNow.com: STR: US hotel results for week ending 4 July
U.S. hotel performance data for the week ending 4 July showed a slight decline in occupancy from the previous week, according to STR.The following graph shows the seasonal pattern for the hotel occupancy rate using the four week average.
28 June through 4 July 2020 (percentage change from comparable week in 2019):
• Occupancy: 45.6% (-30.2%)
• Average daily rate (ADR): US$101.36 (-20.9%)
• Revenue per available room (RevPAR): US$46.21 (-44.8%)
Occupancy had risen in week-to-week comparisons for 11 straight weeks since mid-April.
“Demand came in 67,000 rooms lower than the previous week, and beyond that, July 1 was a reopening day for a lot of hotels, further impacting the occupancy equation,” said Jan Freitag, STR’s senior VP of lodging insights. “A rise in COVID-19 cases has led to states pausing or even rolling back some of their reopenings. Beaches have been a big demand driver for hotels, but with many beaches closed ahead of the July 4 holiday, all but two markets in Florida showed lower occupancy than the previous week. Growing concern around this latest spike in the pandemic has further implications for leisure and business demand alike.” emphasis added
 Click on graph for larger image.
The red line is for 2020, dash light blue is 2019, blue is the median, and black is for 2009 (the worst year probably since the Great Depression for hotels).
Usually hotel occupancy starts to pick up seasonally in early June. So some of the recent pickup might be seasonal (summer travel). Note that summer occupancy usually peaks at the end of July or in early August.
According to STR, the improvement appears related mostly to leisure travel as opposed to business travel.
Note: Y-axis doesn't start at zero to better show the seasonal change.
Schedule for Week of July 12, 2020
by Calculated Risk on 7/11/2020 08:11:00 AM
The key reports this week are June CPI, housing starts and retail sales.
For manufacturing, the June Industrial Production report and the July New York and Philly Fed manufacturing surveys will be released.
No major economic releases scheduled.
6:00 AM ET: NFIB Small Business Optimism Index for June.
8:30 AM: The Consumer Price Index for June from the BLS. The consensus is for a 0.6% increase in CPI, and a 0.1% increase in core CPI.
7:00 AM ET: The Mortgage Bankers Association (MBA) will release the results for the mortgage purchase applications index.
8:30 AM: The New York Fed Empire State manufacturing survey for July. The consensus is for a reading of 7.9, up from -0.2.
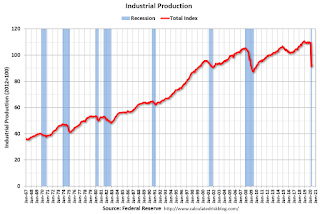 9:15 AM: The Fed will release Industrial Production and Capacity Utilization for June.
This graph shows industrial production since 1967.
The consensus is for a 4.6% increase in Industrial Production, and for Capacity Utilization to increase to 68.1%.
2:00 PM: the Federal Reserve Beige Book, an informal review by the Federal Reserve Banks of current economic conditions in their Districts.
8:30 AM: The initial weekly unemployment claims report will be released. The consensus is for a 1.200 million initial claims, down from 1.314 million the previous week.
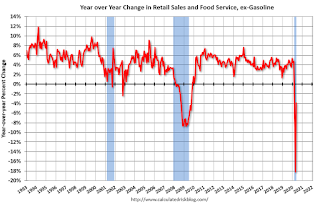 8:30 AM: Retail sales for June is scheduled to be released. The consensus is for 5.5% increase in retail sales.
This graph shows the year-over-year change in retail sales and food service (ex-gasoline) since 1993. Retail and Food service sales, ex-gasoline, decreased by 3.9% on a YoY basis in May.
8:30 AM: the Philly Fed manufacturing survey for July. The consensus is for a reading of 20.0, down from 27.5.
10:00 AM: The July NAHB homebuilder survey. The consensus is for a reading of 60, up from 58. Any number above 50 indicates that more builders view sales conditions as good than poor.
 8:30 AM ET: Housing Starts for June.
 This graph shows single and total housing starts since 1968.
The consensus is for 1.180 million SAAR, up from 0.974 million SAAR in May.
10:00 AM: University of Michigan's Consumer sentiment index (Preliminary for July).
10:00 AM: State Employment and Unemployment (Monthly) for June 2020
Friday, July 10, 2020
July 10 COVID-19 Test Results; Record Tests, Record Positive Tests
by Calculated Risk on 7/10/2020 05:27:00 PM
The US is now conducting over 600,000 tests per day, and that might be enough to allow test-and-trace in some areas. Based on the experience of other countries, the percent positive needs to be well under 5% to really push down new infections, so the US still needs to increase the number of tests per day significantly.
There were 825,635 test results reported over the last 24 hours.
There were 66,645 positive tests.

This data is from the COVID Tracking Project.
The percent positive over the last 24 hours was 8.0% (red line).
For the status of contact tracing by state, check out testandtrace.com.
Q2 GDP Forecasts: Probably Around 36% Annual Rate Decline
by Calculated Risk on 7/10/2020 11:17:00 AM
Important: GDP is reported at a seasonally adjusted annual rate (SAAR). So a 36% Q2 decline is around 10% decline from Q1 (SA).
Note: I'm just trying to make it clear the economy didn't decline by one-third in Q2. Previously I just divided by 4 (an approximation) to show the quarter to quarter decline. The actually formula is (1-.36) ^ .25 - 1 = -0.095 (a 9.5% decline from Q1)
From Merrill Lynch:
2Q GDP tracking remains at -36.0% qoq saar. [July 10 estimate]From Goldman Sachs:
emphasis added
We left our Q2 GDP forecast unchanged at -33% (qoq ar). We expect -29% in the initial vintage of the report, reflecting incomplete source data and non-response bias [July 9 estimate]From the NY Fed Nowcasting Report
The New York Fed Staff Nowcast stands at -15.3% for 2020:Q2 and 10.1% for 2020:Q3. [July 10 estimate]And from the Altanta Fed: GDPNow
The GDPNow model estimate for real GDP growth (seasonally adjusted annual rate) in the second quarter of 2020 is -35.5 percent on July 9, down from -35.2 percent on July 2. [July 9 estimate]
Black Knight: Number of Homeowners in COVID-19-Related Forbearance Plans Fall by 435K
by Calculated Risk on 7/10/2020 09:05:00 AM
Note: Both Black Knight and the MBA (Mortgage Bankers Association) are putting out weekly estimates of mortgages in forbearance.
From Black Knight: Forbearances See Largest Weekly Drop Yet
The latest data from the McDash Flash Forbearance Tracker shows that, following on last week’s decline, the number of active forbearance plans fell another 435,000 week-over-week – marking the largest drop yet. This brings the total number of active forbearances to its lowest point since April 28.
As of July 7, 4.14 million homeowners were in active forbearance, representing 7.8% of all active mortgages, down from 8.6% the week prior. Together, they represent just under $900 billion in unpaid principal.
The overall decline in active forbearance plans is likely driven at least in part by the fact that more than half of all active forbearance plans at the start of June were set to expire at the end of the month. While the majority have been extended, this week’s data suggests a significant share were not.
Of those in forbearance, 37% have now missed at least three payments, whereas nearly 60% have missed two.
Click on graph for larger image.
Again, recent spikes in COVID-19 around much of the country and the scheduled expiration of expanded unemployment benefits both represent significant uncertainty for the weeks ahead.
emphasis added
Thursday, July 09, 2020
July 9 COVID-19 Test Results
by Calculated Risk on 7/09/2020 06:00:00 PM
Note: There was an error in initial release. Now corrected and this post updated.
The US is now conducting over 600,000 tests per day, and that might be enough to allow test-and-trace in some areas. Based on the experience of other countries, the percent positive needs to be well under 5% to really push down new infections, so the US still needs to increase the number of tests per day significantly.
According to Dr. Jha of Harvard's Global Health Institute, the US might need more than 900,000 tests per day.
There were 637,300 test results reported over the last 24 hours.
There were 58,836 positive tests.

This data is from the COVID Tracking Project.
The percent positive over the last 24 hours was 9.2% (red line).
For the status of contact tracing by state, check out testandtrace.com.
DOT: Vehicle Miles Driven decreased 26% year-over-year in May
by Calculated Risk on 7/09/2020 01:58:00 PM
The Department of Transportation (DOT) reported:
Travel on all roads and streets changed by -25.5% (-72.9 billion vehicle miles) for May 2020 as compared with May 2019. Travel for the month is estimated to be 213.2 billion vehicle miles.
The seasonally adjusted vehicle miles traveled for May 2020 is 199.8 billion miles, a -26.1% (-70.6 billion vehicle miles) decline from May 2019. It also represents 24.1% increase (38.8 billion vehicle miles) compared with April 2020.
Cumulative Travel for 2020 changed by -17.3% (-227.2 billion vehicle miles). The cumulative estimate for the year is 1,087.0 billion vehicle miles of travel.
emphasis added
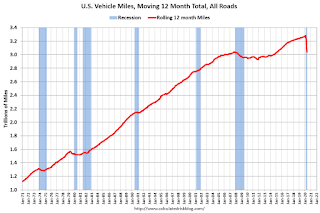 Click on graph for larger image.
This graph shows the rolling 12 month total vehicle miles driven to remove the seasonal factors.
Miles driven declined during the great recession, and the rolling 12 months stayed below the previous peak for a record 85 months.
Miles driven declined sharply in March, and really collapsed in April. Miles driven rebounded in May, but is still down 26% YoY.
 This graph shows the YoY change in vehicle miles driven.
Miles driven were down 26.1% year-over-year in May.
Reis on Q2 Office, Mall and Apartment Vacancy Rates
by Calculated Risk on 7/09/2020 12:18:00 PM
From Reis economist Barbara Byrne Denham:
The Apartment Vacancy Rate was unchanged in the second quarter but increased 0.2% from a year ago; Asking and Effective Rents declined 0.4% in the quarter after rising as much in the first quarter.
The Office Vacancy Rate rose 0.1% as occupancy declined by 977,000 square feet; the Average Office Asking Rent declined 0.1% while the Effective Rent declined 0.4% in the quarter.
The Retail Vacancy Rate was unchanged in the quarter at 10.2% despite a decline in occupancy of 1.125 million square feet; the Average Asking Rent declined 0.5% while the Average Effective Rent fell 0.6%. Mall statistics have not been finalized.
The commercial real estate statistics listed above represent an average of 79 metros, except for the retail statistics which cover 77 metros.
The metro results varied widely, although the changes were modest given the national pandemic’s shutdown measures which had a deep impact on job losses. The more moderate declines in commercial occupancy and rents were likely due to both the multi-year term structure of leases in office and retail, as well as to the Paycheck Protection Program and CARES Act which allowed most tenants to pay their rent.
…
Conclusion
The second quarter statistics clearly show that property owners have yet to feel the full impact of the pandemic. In fact, demand for apartments could hold steady in most metros ...
The lack of response in the retail sector was especially striking given that many retailers were already suffering from diverted e-commerce sales even before the coronavirus struck. While many retailers have re-opened in the last month, many may not survive a second wave of the virus that has crippled economies in much of the south and west.
Finally, the office market may have seen the slightest impact, but this was likely due to the 5-to-15-year term structure of leases that kept the market intact. Still, the forced work-from-home option driven by the pandemic has prompted many office planners to reconsider future office needs which will impact the office market for years.
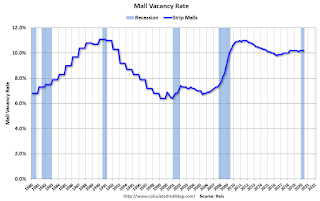 Click on graph for larger image.
This graph shows the strip mall vacancy rate starting in 1980 (prior to 2000 the data is annual).
For Neighborhood and Community malls (strip malls), the vacancy rate was 10.2% in Q2, unchanged from 10.2% in Q1, and unchanged from 10.2% in Q2 2019.
For strip malls, the vacancy rate peaked at 11.1% in Q3 2011, and the low was 9.8% in Q2 2016.
Recently the regional mall vacancy rates have increased significantly from an already elevated level, however Reis didn't release the regional mall vacancy data for Q2.
 This graph shows the office vacancy rate starting in 1980 (prior to 1999 the data is annual).
Reis reported the vacancy rate was at 17.1% in Q2, up from 17.0% in Q1, and up from 16.8% in Q2 2019. The office vacancy rate had been mostly moving sideways at an elevated level, but has increased over the last two years. And will likely increase further as leases expire.
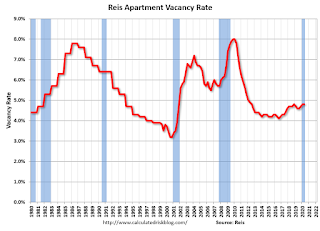 This graph shows the apartment vacancy rate starting in 1980. (Annual rate before 1999, quarterly starting in 1999). Note: Reis is just for large cities.
Reis reported the vacancy rate was at 4.8% in Q2, unchanged from Q1, and up from 4.6% in Q2 2019.
The apartment vacancy rate will probably stay fairly low if there is additional disaster relief. However, the vacancy rate could increase sharply if the eviction moratoriums end and there is minimal additional disaster relief.
All vacancy data courtesy of Reis
Comments on Weekly Unemployment Claims
by Calculated Risk on 7/09/2020 09:51:00 AM
A few comments:
On a monthly basis, most analysts focus on initial unemployment claims for the BLS reference week of the employment report. For July, the BLS reference week will be July 12th through the 18th, and initial claims for that week will be released on Thursday, July 23rd.
Note that a couple of states have not released Pandemic Unemployment Assistance (PUA) claims yet, so the number of PUA claims is too low. However, there may also be processing delays that are impacting the numbers.
Continued claims decreased last week to 18,062,000 (SA) from 18,760,000 (SA) the previous week. However, continued claims are down 6.8 million from the peak, suggesting a large number of people have returned to their jobs (as the employment report showed).
The following graph shows regular initial unemployment claims (blue) and PUA claims (red) since early February.

This was the 16th consecutive week with extraordinarily high initial claims.
It is possible that we are starting to see some layoffs associated with the end of some early Payroll Protection Plan (PPP) participants.
We should start seeing layoffs associated with the rising COVID cases and hospitalization in some states (like Arizona, California, Florida and Texas). With bar and restaurant closings in some areas, we will probably see more initial claims in those states this week, and that will show up in the report next week.
Note that these states don't have to lockdown to see a decline in economic activity. As Merrill Lynch economists noted: "Most of the slowdown occurred due to voluntary social distancing rather than lockdown policies."


