by Calculated Risk on 7/14/2020 12:08:00 PM
Tuesday, July 14, 2020
First Look at 2021 Cost-Of-Living Adjustments and Maximum Contribution Base
The BLS reported this morning:
The Consumer Price Index for Urban Wage Earners and Clerical Workers (CPI-W) increased 0.5 percent over the last 12 months to an index level of 251.054 (1982-84=100). For the month, the index rose 0.6 percent prior to seasonal adjustment.CPI-W is the index that is used to calculate the Cost-Of-Living Adjustments (COLA). The calculation dates have changed over time (see Cost-of-Living Adjustments), but the current calculation uses the average CPI-W for the three months in Q3 (July, August, September) and compares to the average for the highest previous average of Q3 months. Note: this is not the headline CPI-U, and is not seasonally adjusted (NSA).
• In 2019, the Q3 average of CPI-W was 250.200.
The 2019 Q3 average was the highest Q3 average, so we only have to compare Q3 this year to last year.
 Click on graph for larger image.
This graph shows CPI-W since January 2000. The red lines are the Q3 average of CPI-W for each year.
Note: The year labeled for the calculation, and the adjustment is effective for December of that year (received by beneficiaries in January of the following year).
CPI-W was up 0.5% year-over-year in June, and although this is very early - we need the data for July, August and September - my current guess is COLA will probably be under 1% this year, the smallest increase since 2016.
Contribution and Benefit Base
The contribution base will be adjusted using the National Average Wage Index. This is based on a one year lag. The National Average Wage Index is not available for 2019 yet, but wages probably increased again in 2019. If wages increased the same as in 2018, then the contribution base next year will increase to around $142,700 in 2020, from the current $137,700.
The law - as currently written - prohibits an increase in the contribution and benefit base if COLA is not greater than zero (this is possible this year). However if the there is even a small increase in CPI-W, the contribution base will be adjusted using the National Average Wage Index.
Remember - this is an early look. What matters is average CPI-W for all three months in Q3 (July, August and September).
Cleveland Fed: Key Measures Show Inflation Soft Year-over-year in June
by Calculated Risk on 7/14/2020 11:17:00 AM
The Cleveland Fed released the median CPI and the trimmed-mean CPI this morning:
According to the Federal Reserve Bank of Cleveland, the median Consumer Price Index rose 0.1% June. The 16% trimmed-mean Consumer Price Index rose 0.2% in June. "The median CPI and 16% trimmed-mean CPI are measures of core inflation calculated by the Federal Reserve Bank of Cleveland based on data released in the Bureau of Labor Statistics’ (BLS) monthly CPI report".
Note: The Cleveland Fed released the median CPI details for June here. Motor fuel increased at a 290% annualized rate in June!

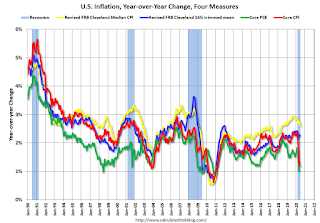
This graph shows the year-over-year change for these four key measures of inflation. On a year-over-year basis, the median CPI rose 2.6%, the trimmed-mean CPI rose 2.3%, and the CPI less food and energy rose 1.2%. Core PCE is for May and increased 1.0% year-over-year.
Inflation will not be a concern during the crisis.
BLS: CPI increased 0.6% in June, Core CPI increased 0.2%
by Calculated Risk on 7/14/2020 08:32:00 AM
The Consumer Price Index for All Urban Consumers (CPI-U) increased 0.6 percent in June on a seasonally adjusted basis after falling 0.1 percent in May, the U.S. Bureau of Labor Statistics reported today. Over the last 12 months, the all items index increased 0.6 percent before seasonal adjustment.Overall inflation was at expectations in June. I'll post a graph later today after the Cleveland Fed releases the median and trimmed-mean CPI.
The gasoline index rose sharply in June after recent declines and accounted for over half of the monthly increase in the seasonally adjusted all items index. The energy index increased 5.1 percent in June as the gasoline index rose 12.3 percent. The food index also rose in June, increasing 0.6 percent as the index for food at home continued to rise.
The index for all items less food and energy rose 0.2 percent in June, its first monthly increase since February. The index for motor vehicle insurance increased sharply in June after recent declines. The indexes for apparel, shelter, and medical care also increased in June, while the indexes for used cars and trucks, recreation, and communication all declined.
The all items index increased 0.6 percent for the 12 months ending June; this compares to a 0.1-percent increase for the 12 months ending May. The index for all items less food and energy increased 1.2 percent over the last 12 months. The food index increased 4.5 percent over the last 12 months, with the index for food at home rising 5.6 percent. Despite increasing in June, the energy index fell 12.6 percent over the last 12 months.
emphasis added
Monday, July 13, 2020
Tuesday: CPI
by Calculated Risk on 7/13/2020 07:34:00 PM
From Matthew Graham at Mortgage News Daily: Mortgage Rates Have Moved Up From Last Week's Lows
Mortgage rates definitely hit the lowest all-time lows of all-time last week, at least for conventional 30yr fixed scenarios without many risk-based adjustments. The most recently available Freddie Mac rate survey (which drives a majority of mortgage rate headlines) reported all-time lows as of last Thursday. Indeed, that was still true as of Thursday, but things have changed since then. ... Context is important here. We're not even talking about an eighth of a percentage point in interest on average (though some lenders/programs have moved by as much as .25%.) [Top Tier Scenarios 30YR FIXED - 2.93%]Tuesday:
emphasis added
• At 6:00 AM ET, NFIB Small Business Optimism Index for June.
• At 8:30 AM, The Consumer Price Index for June from the BLS. The consensus is for a 0.6% increase in CPI, and a 0.1% increase in core CPI.
July 13 COVID-19 Test Results
by Calculated Risk on 7/13/2020 05:49:00 PM
The US is now conducting over 600,000 tests per day, and that might be enough to allow test-and-trace in some areas. Based on the experience of other countries, the percent positive needs to be well under 5% to really push down new infections, so the US still needs to increase the number of tests per day significantly.
There were 720,700 test results reported over the last 24 hours.
There were 58,357 positive tests.

This data is from the COVID Tracking Project.
The percent positive over the last 24 hours was 8.0% (red line).
For the status of contact tracing by state, check out testandtrace.com.
MBA Survey: "Share of Mortgage Loans in Forbearance Decreases for Fourth Straight Week to 8.18%" of Portfolio Volume
by Calculated Risk on 7/13/2020 04:00:00 PM
Note: To put these numbers in perspective, the MBA notes "For the week of March 2, only 0.25% of all loans were in forbearance."
From the MBA: Share of Mortgage Loans in Forbearance Decreases for Fourth Straight Week to 8.18%
The Mortgage Bankers Association’s (MBA) latest Forbearance and Call Volume Survey revealed that the total number of loans now in forbearance decreased by 21 basis points from 8.39% of servicers’ portfolio volume in the prior week to 8.18% as of July 5, 2020. According to MBA’s estimate, 4.1 million homeowners are in forbearance plans.
...
“The share of loans in forbearance continues to decrease, as more workers are brought back from temporary layoffs. However, our survey reveals a notable shift in the location of many FHA and VA loans, which have been bought out of Ginnie Mae pools – predominantly by bank servicers – and moved onto bank balance sheets,” said Mike Fratantoni, MBA’s Senior Vice President and Chief Economist. “As a result, there was a sharp drop in the share of Ginnie Mae loans in forbearance, and an offsetting increase in the share of portfolio loans in forbearance. These buyouts enable servicers to stop advancing principal and interest payments, and to work with borrowers in the hope that they can begin paying again before they are re-securitized into Ginnie Mae pools.”
Added Fratantoni, “Forty-three percent of loans in forbearance are now in an extension following their initial forbearance term, while more than 10 percent of borrowers entered into a deferral plan to exit forbearance – down from 16 percent the week prior. For those exiting forbearance over the next several months, we expect to see many of the borrowers with GSE loans to utilize the deferral option.”
emphasis added
 Click on graph for larger image.
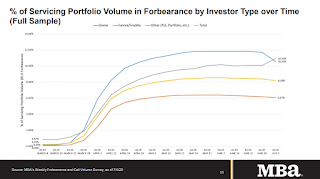
This graph shows the percent of portfolio in forbearance by investor type over time. Most of the increase was in late March and early April.
The MBA notes: "Weekly forbearance requests as a percent of servicing portfolio volume (#) increased to 0.13 percent from 0.12 percent the previous week."
"Cargo Declines at Port of Long Beach in June"
by Calculated Risk on 7/13/2020 11:05:00 AM
Note: I'll have more on LA area port traffic once the Port of Los Angeles releases June statistics.
From the Port of Long Beach: Cargo Declines at Port of Long Beach in June
The COVID-19 pandemic continued to drive down demand for goods in the second quarter of 2020, leading to an increase in canceled sailings and a decline in cargo containers shipped through the Port of Long Beach in June.
Dockworkers and terminal operators moved 602,180 twenty-foot equivalent units (TEUs) last month, an 11.1% decline compared to June 2019. Imports shrank 9.3% to 300,714 TEUs and exports dropped 12.2% to 117,538 TEUs. Empty containers shipped overseas to Asia were down 13.1% to 183,928 TEUs.
Economic uncertainty brought by decreased consumer spending and ongoing health concerns amid the COVID-19 epidemic contributed to a drop during the first half of 2020, with cargo shipments at 3,433,035 TEUs, 6.9% less than the same period last year.
“Canceled sailings continued to rise at a rapid rate in the second quarter as ocean carriers adjusted their voyages to a decline in demand for imports during the national COVID-19 outbreak,” said Mario Cordero, Executive Director of the Port of Long Beach. “The economic challenges may persist for some time, but the Port of Long Beach continues to invest in infrastructure projects that will meet the needs of our customers.”
The San Pedro Bay ports complex – Long Beach and L.A. combined – had 41 canceled sailings in the first half of 2019. This year it was 104 – 37 of which were destined for the Port of Long Beach.
emphasis added
Six High Frequency Indicators for a Recovery
by Calculated Risk on 7/13/2020 08:13:00 AM
These indicators are mostly for travel and entertainment - some of the sectors that will recover very slowly.
The TSA is providing daily travel numbers.
 Click on graph for larger image.
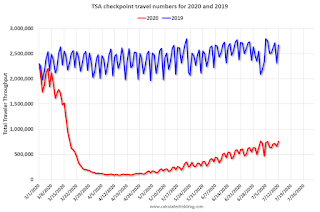
This data shows the daily total traveler throughput from the TSA for 2019 (Blue) and 2020 (Red).
On July 12th there were 754,545 travelers compared to 2,669,717 a year ago.
That is a decline of 72%. There has been a slow steady increase from the bottom, but air travel is still down significantly.
The second graph shows the 7 day average of the year-over-year change in diners as tabulated by OpenTable for the US and several selected cities.
 Thanks to OpenTable for providing this restaurant data:
This data is updated through July 11, 2020.
This data is "a sample of restaurants on the OpenTable network across all channels: online reservations, phone reservations, and walk-ins. For year-over-year comparisons by day, we compare to the same day of the week from the same week in the previous year."
Note that this data is for "only the restaurants that have chosen to reopen in a given market".
The 7 day average for New York is still off 81%.
Florida is only down 57% YoY. Note that dining seems to be declining in many areas (probably due to the recent surge in COVID cases).
 This data shows domestic box office for each week (red) and the maximum and minimum for the previous four years. Data is from BoxOfficeMojo through July 9th.
Note that the data is usually noisy week-to-week and depends on when blockbusters are released.
Movie ticket sales have picked up a slightly from the bottom, but are still under $1 million per week (compared to usually around $300 million per week), and ticket sales have essentially been at zero for sixteen weeks.
Most movie theaters are closed all across the country, and will probably reopen slowly (probably with limited seating at first).
The following graph shows the seasonal pattern for the hotel occupancy rate using the four week average.
 The red line is for 2020, dash light blue is 2019, blue is the median, and black is for 2009 (the worst year probably since the Great Depression for hotels).
2020 was off to a solid start, however, COVID-19 crushed hotel occupancy. Hotel occupancy was off 30.2% YoY last week.
Notes: Y-axis doesn't start at zero to better show the seasonal change.
Usually hotel occupancy starts to pick up seasonally in early June. So some of the recent pickup might be seasonal (summer travel). Note that summer occupancy usually peaks at the end of July or in early August.
 This graph, based on weekly data from the U.S. Energy Information Administration (EIA), shows the year-over-year change in gasoline consumption.
At one point, gasoline consumption was off almost 50% YoY.
As of July 3rd, gasoline consumption was only off about 10% YoY (about 90% of normal).
Note: I know several people that have driven to vacation spots - or to visit family - and they usually would have flown. So this might have boosted gasoline consumption.
The final graph is from Apple mobility. From Apple: "This data is generated by counting the number of requests made to Apple Maps for directions in select countries/regions, sub-regions, and cities." This is just a general guide - people that regularly commute probably don't ask for directions.
There is also some great data on mobility from the Dallas Fed Mobility and Engagement Index. However the index is set "relative to its weekday-specific average over January–February", and is not seasonally adjusted, so we can't tell if an increase in mobility is due to recovery or just the normal increase in the Spring and Summer.
 This data is through July 11th for the United States and several selected cities.
The graph is the running 7 day average to remove the impact of weekends.
IMPORTANT: All data is relative to January 13, 2020. This data is NOT Seasonally Adjusted. People walk and drive more when the weather is nice, so I'm just using the transit data.
According to the Apple data directions requests, public transit in the 7 day average for the US is still only about 50% of the January level. It is at 39% in New York, and 56% in Houston (down over the last couple of weeks).
Sunday, July 12, 2020
Sunday Night Futures
by Calculated Risk on 7/12/2020 06:39:00 PM
Weekend:
• Schedule for Week of July 12, 2020
Monday:
• No major economic releases scheduled.
From CNBC: Pre-Market Data and Bloomberg futures S&P 500 are up 20 and DOW futures are up 199 (fair value).
Oil prices were down over the last week with WTI futures at $40.25 per barrel and Brent at $42.93 barrel. A year ago, WTI was at $57, and Brent was at $64 - so WTI oil prices are down about 30% year-over-year.
Here is a graph from Gasbuddy.com for nationwide gasoline prices. Nationally prices are at $2.19 per gallon. A year ago prices were at $2.79 per gallon, so gasoline prices are down $0.60 per gallon year-over-year.
July 12 COVID-19 Test Results
by Calculated Risk on 7/12/2020 05:10:00 PM
The US is now conducting over 600,000 tests per day, and that might be enough to allow test-and-trace in some areas. Based on the experience of other countries, the percent positive needs to be well under 5% to really push down new infections, so the US still needs to increase the number of tests per day significantly.
There were 729,141 test results reported over the last 24 hours.
There were 61,338 positive tests.

This data is from the COVID Tracking Project.
The percent positive over the last 24 hours was 8.4% (red line).
For the status of contact tracing by state, check out testandtrace.com.


