by Calculated Risk on 7/03/2020 12:25:00 PM
Friday, July 03, 2020
Comments on Weekly Unemployment Claims
A few comments:
On a monthly basis, most analysts focus on initial unemployment claims for the BLS reference week of the employment report. For July, the BLS reference week will be July 12th through the 18th, and initial claims for that week will be released on Thursday, July 23rd.
Note that a few states have not released Pandemic Unemployment Assistance (PUA) claims yet. This includes Georgia, New Hampshire and a few other areas - so the number of PUA claims is too low. However, there may also be processing delays that are impacting the numbers.
Continued claims increased slightly last week to 19,290,000 (SA) from 19,231,000 (SA) the previous week. However, continued claims are down 5.6 million from the peak, suggesting a large number of people have returned to their jobs (as the employment report showed).
The following graph shows regular initial unemployment claims (blue) and PUA claims (red) since early February.

This was the 15th consecutive week with extraordinarily high initial claims.
It is possible that we are starting to see some layoffs associated with the end of some early Payroll Protection Plan (PPP) participants.
We should start seeing layoffs associated with the rising COVID cases and hospitalization in some states (like Arizona, Florida and Texas). With bar and restaurant closings in some areas, we will probably see more initial claims in those states in the coming week, and that will show up in the report the following week.
Note that these states don't have to lockdown to see a decline in economic activity. As Merrill Lynch economists noted last month: "Most of the slowdown occurred due to voluntary social distancing rather than lockdown policies."
Initial unemployment claims, and continued claims (and PUA claims) are important high frequency indicators to follow right now.
Black Knight: Number of Homeowners in COVID-19-Related Forbearance Plans Declined
by Calculated Risk on 7/03/2020 08:50:00 AM
Note: Both Black Knight and the MBA (Mortgage Bankers Association) are putting out weekly estimates of mortgages in forbearance.
From Black Knight: Forbearances Reverse Course, See Largest Weekly Decline Yet
Overall, the number of active forbearance plans is down 104K from last week for the lowest weekly total active forbearances we’ve seen since the first week of May. This latest drop brings us down 183K from the peak on May 22 and brings us back to the trend of improvement we’d seen throughout June.
According to daily mortgage payment tracking data, as of the end of June, roughly a quarter of homeowners in forbearance had remitted their June payment. That’s as compared to 46% in April and approximately 30% in May.
What remains to be seen is what impact the new spikes in COVID-19 around much of the country will have on forbearance requests moving forward. If they lead to another round of shutdowns – or extensions of those already in effect – and put upward pressure on unemployment numbers, we could see yet another reversal of this trend. The same holds true for the looming expiration of expanded unemployment benefits.
Click on graph for larger image.
As of June 30, 4.58 million homeowners are in forbearance plans, representing 8.6% of all active mortgages, down from 8.8% last week. Together, they represent just under $1 trillion in unpaid principal ($995B).
emphasis added
Thursday, July 02, 2020
July 2 COVID-19 Test Results
by Calculated Risk on 7/02/2020 05:58:00 PM
The US is now conducting over 600,000 tests per day, and that might be enough to allow test-and-trace in some areas. Based on the experience of other countries, the percent positive needs to be well under 5% to really push down new infections, so the US still needs to increase the number of tests per day significantly.
According to Dr. Jha of Harvard's Global Health Institute, the US might need more than 900,000 tests per day.
There were 634,822 test results reported over the last 24 hours.
There were 52,815 positive tests. This is the second consecutive day over 50,000.

This data is from the COVID Tracking Project.
The percent positive over the last 24 hours was 8.3% (red line).
For the status of contact tracing by state, check out testandtrace.com.
Hotels: Occupancy Rate Declined 38.7% Year-over-year
by Calculated Risk on 7/02/2020 02:32:00 PM
From HotelNewsNow.com: STR: US hotel results for week ending 27 June
U.S. hotel performance data for the week ending 27 June showed another small rise from previous weeks and less severe year-over-year declines, according to STR.The following graph shows the seasonal pattern for the hotel occupancy rate using the four week average.
21-27 June 2020 (percentage change from comparable week in 2019):
• Occupancy: 46.2% (-38.7%)
• Average daily rate (ADR): US$95.37 (-29.0%)
• Revenue per available room (RevPAR): US$44.03 (-56.5%)
emphasis added
 Click on graph for larger image.
The red line is for 2020, dash light blue is 2019, blue is the median, and black is for 2009 (the worst year probably since the Great Depression for hotels).
Usually hotel occupancy starts to pick up seasonally in early June. So some of the recent pickup might be seasonal (summer travel). Note that summer occupancy usually peaks at the end of July or in early August.
According to STR, the improvement appears related mostly to leisure travel as opposed to business travel.
Note: Y-axis doesn't start at zero to better show the seasonal change.
Trade Deficit increased to $54.6 Billion in May
by Calculated Risk on 7/02/2020 02:10:00 PM
From the Department of Commerce reported:
The U.S. Census Bureau and the U.S. Bureau of Economic Analysis announced today that the goods and services deficit was $54.6 billion in May, up $4.8 billion from $49.8 billion in April, revised.
May exports were $144.5 billion, $6.6 billion less than April exports. May imports were $199.1 billion, $1.8 billion less than April imports.
emphasis added
 Click on graph for larger image.
Both exports and imports decreased in May.
Exports are down 32% compared to May 2019; imports are down 25% compared to May 2019.
Both imports and exports have decreased sharply due to COVID-19.
The second graph shows the U.S. trade deficit, with and without petroleum.
 The blue line is the total deficit, and the black line is the petroleum deficit, and the red line is the trade deficit ex-petroleum products.
Note that the U.S. exported a slight net positive petroleum products in recent months.
Oil imports averaged $27.55 per barrel in May, down from $34.72 per barrel in April, and down from $62.60 in May 2019.
The trade deficit with China decreased to $27.0 billion in May, from $30.1 billion in May 2019.
BEA: June Vehicles Sales increased to 13.0 Million SAAR
by Calculated Risk on 7/02/2020 11:59:00 AM
The BEA released their estimate of May vehicle sales this morning. The BEA estimated light vehicle sales of 13.05 million SAAR in June 2020 (Seasonally Adjusted Annual Rate), up 5.7% from the revised May sales rate, and down 24.1% from June 2019.

This graph shows light vehicle sales since 2006 from the BEA (blue) and an estimate for June 2020 (red).
The impact of COVID-19 is significant, and it appears April was the worst month.
The second graph shows light vehicle sales since the BEA started keeping data in 1967.

Sales collapsed in the second half of March, and really declined in April.
However sales rebounded in May, and increased further in June.
Comments on June Employment Report
by Calculated Risk on 7/02/2020 11:09:00 AM
The labor market swings have been huge, and the June employment report was better than expected with 4.8 million jobs added.
Leisure and hospitality led the way with 2.088 million jobs added in June, following 1.403 million jobs added in May. Leisure and hospitality lost 8.318 million jobs in March and April, so about 42% of those jobs were added back in May and June.
However, these are the jobs most susceptible to a surge in COVID infections, and leisure and hospitality will likely be under pressure in July.
Earlier: June Employment Report: 4.8 Million Jobs Added, 11.1% Unemployment Rate
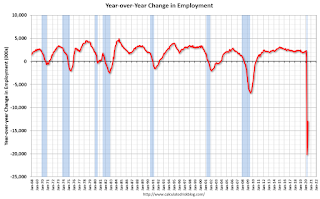
In June, the year-over-year employment change was minus 13 million jobs.
One of the keys to follow will be the number of workers on temporary layoff. This increased from 801 thousand in February, to 1.848 million in March, and to 18.063 million in April. This decreased in May to 15.343 million, and decreased further in June to 10.565 million.
Meanwhile permanent job losers increased in June to 2.883 million from 2.295 million in May.
Prime (25 to 54 Years Old) Participation

Since the overall participation rate has declined due to cyclical (recession) and demographic (aging population, younger people staying in school) reasons, here is the employment-population ratio for the key working age group: 25 to 54 years old.
The prime working age will be key in the eventual recovery.
The 25 to 54 participation rate increased in June to 81.5%, and the 25 to 54 employment population ratio increased to 73.5%.
Part Time for Economic Reasons

"The number of persons employed part time for economic reasons declined by 1.6 million to 9.1 million in June but is still more than double its February level. These individuals, who would have preferred full-time employment, were working part time because their hours had been reduced or they were unable to find full-time jobs. This group includes persons who usually work full time and persons who usually work part time."The number of persons working part time for economic reasons decreased in June to 9.062 million from 10.633 million in May.
These workers are included in the alternate measure of labor underutilization (U-6) that decreased to 18.0% in June. This is down from the record high in April 22.8% (and down from 21.2% in May) for this measure since 1994. The previous peak was 17.2% during the Great Recession.
Unemployed over 26 Weeks
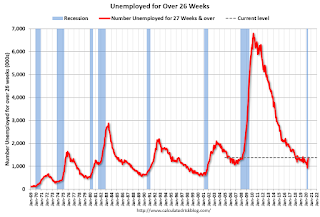
 This graph shows the number of workers unemployed for 27 weeks or more.
 According to the BLS, there are 1.391 million workers who have been unemployed for more than 26 weeks and still want a job. This will increase sharply in 3 or 4 months, and will be a key measure to follow during the recovery.
Summary:
The headline monthly jobs number was well above expectations and the previous two months were revised up 90,000 combined. The headline unemployment rate decreased to 11.1% .
Last month I noted that the "reopenings" would be a June story, and that is what this report suggests. In addition, companies using PPP had to rehire employees to convert the loans to a grants. Unfortunately, the surge in virus infections and related closures, will probably negatively impact the July report. In addition, we will probably start to see more PPP related layoffs.
As a reminder, the course of the economy will be determined by the course of the pandemic.
Weekly Initial Unemployment Claims decrease to 1,427,000
by Calculated Risk on 7/02/2020 08:55:00 AM
The DOL reported:
In the week ending June 27, the advance figure for seasonally adjusted initial claims was 1,427,000, a decrease of 55,000 from the previous week's revised level. The previous week's level was revised up by 2,000 from 1,480,000 to 1,482,000. The 4-week moving average was 1,503,750, a decrease of 117,500 from the previous week's revised average. The previous week's average was revised up by 500 from 1,620,750 to 1,621,250.The previous week was revised up.
emphasis added
This does not include the 839,563 initial claims for Pandemic Unemployment Assistance (PUA).
The following graph shows the 4-week moving average of weekly claims since 1971.
 Click on graph for larger image.
The dashed line on the graph is the current 4-week average. The four-week average of weekly unemployment claims decreased to 1,503,750.
This was close to the consensus forecast of 1.4 million initial claims and the previous week was revised up.
The second graph shows seasonally adjust continued claims since 1967 (lags initial by one week).
 At the worst of the Great Recession, continued claims peaked at 6.635 million, but then steadily declined.
Continued claims increased to 19,290,000 (SA) from 19,231,000 (SA) last week and will likely stay at a high level until the crisis abates.
Note: There are an additional 12,853,163 receiving Pandemic Unemployment Assistance (PUA). This is a special program for business owners, self-employed, independent contractors or gig workers not receiving other unemployment insurance.
June Employment Report: 4.8 Million Jobs Added, 11.1% Unemployment Rate
by Calculated Risk on 7/02/2020 08:41:00 AM
From the BLS:
Total nonfarm payroll employment rose by 4.8 million in June, and the unemployment rate declined to 11.1 percent, the U.S. Bureau of Labor Statistics reported today. These improvements in the labor market reflected the continued resumption of economic activity that had been curtailed in March and April due to the coronavirus (COVID-19) pandemic and efforts to contain it. In June, employment in leisure and hospitality rose sharply. Notable job gains also occurred in retail trade, education and health services, other services, manufacturing, and professional and business services.
...
The change in total nonfarm payroll employment for April was revised down by 100,000, from -20.7 million to -20.8 million, and the change for May was revised up by 190,000, from +2.5 million to +2.7 million. With these revisions, employment in April and May combined was 90,000 higher than previously reported.
emphasis added
 Click on graph for larger image.
The first graph shows the year-over-year change in total non-farm employment since 1968.
In June, the year-over-year change was -12.957 million jobs.
Total payrolls increased by 4.8 million in June.
Payrolls for April and May were revised up 90 thousand combined.
 The second graph shows the job losses from the start of the employment recession, in percentage terms.
The current employment recession is by far the worst recession since WWII in percentage terms, and the worst in terms of the unemployment rate.
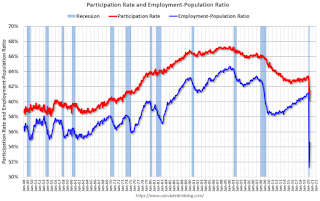
The third graph shows the employment population ratio and the participation rate.
 The Labor Force Participation Rate increased to 61.5% in June. This is the percentage of the working age population in the labor force.
 The Employment-Population ratio increased to 54.6% (black line).
I'll post the 25 to 54 age group employment-population ratio graph later.
 The fourth graph shows the unemployment rate.
 The unemployment rate decreased in June to 11.1%.
This was well above consensus expectations of 3,070,000 jobs added, and April and May were revised up by 90,000 combined.
I'll have much more later …
Wednesday, July 01, 2020
Thursday: Employment Report, Initial Unemployment Claims, Trade Deficit
by Calculated Risk on 7/01/2020 08:47:00 PM
Thursday:
• At 8:30 AM ET, Employment Report for June. The consensus is for 3,074,000 jobs added, and for the unemployment rate to decrease to 12.3%.
• Also at 8:30 AM, The initial weekly unemployment claims report will be released. The consensus is for a 1.400 million initial claims, down from 1.480 million the previous week.
• Also at 8:30 AM, Trade Balance report for May from the Census Bureau. The consensus is the trade deficit to be $52.4 billion. The U.S. trade deficit was at $49.4 Billion the previous month.


