by Calculated Risk on 7/01/2020 06:40:00 PM
Wednesday, July 01, 2020
July 1 COVID-19 Test Results, Highest Percent Positive Since Early May, Over 50,000 Positive
UPDATE: First post didn't include California numbers. Now updated.
The US is now conducting over 500,000 tests per day, and that might be enough to allow test-and-trace in some areas. Based on the experience of other countries, the percent positive needs to be well under 5% to really push down new infections, so the US still needs to increase the number of tests per day significantly.
According to Dr. Jha of Harvard's Global Health Institute, the US might need more than 900,000 tests per day.
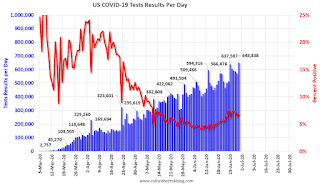
There were 621,114 test results reported over the last 24 hours.
There were 52,982 positive tests. This is the most daily positive tests.

This data is from the COVID Tracking Project.
The percent positive over the last 24 hours was 8.5% (red line).
For the status of contact tracing by state, check out testandtrace.com.
FOMC Minutes: Pandemic "Posed considerable downside risks to the economic outlook over the medium term"
by Calculated Risk on 7/01/2020 02:07:00 PM
From the Fed: Minutes of the Federal Open Market Committee June 9-10, 2020. A few excerpts:
Over the intermeeting period, risk sentiment improved, on net, as optimism over reopening the economy, potential coronavirus treatments, the unexpectedly positive May employment situation report, and other indicators that suggest that economic activity may be rebounding more than offset concerns arising from otherwise dire economic data releases, warnings from health experts that openings may have been premature, and renewed tensions between the United States and China. Equity prices rose, and corporate bond spreads narrowed notably. ...
...
Participants noted that the coronavirus outbreak was causing tremendous human and economic hardship across the United States and around the world. The virus and the measures taken to protect public health induced sharp declines in economic activity and a surge in job losses. Weaker demand and significantly lower oil prices were holding down consumer price inflation. Financial conditions had improved, in part reflecting policy measures to support the economy and the flow of credit to U.S. households and businesses.
...
In their discussion of monetary policy for this meeting, members agreed that the coronavirus outbreak was causing tremendous human and economic hardship across the United States and around the world. The virus and the measures taken to protect public health had induced sharp declines in economic activity and a surge in job losses. Consumer price inflation was being held down by weaker demand and significantly lower oil prices. Financial conditions had improved, in part reflecting policy measures to support the economy and the flow of credit to U.S. households, businesses, and communities. Members agreed that the Federal Reserve was committed to using its full range of tools to support the U.S. economy in this challenging time, thereby promoting its maximum-employment and price-stability goals.
Members further concurred that the ongoing public health crisis would weigh heavily on economic activity, employment, and inflation in the near term and posed considerable downside risks to the economic outlook over the medium term. In light of these developments, members decided to maintain the target range for the federal funds rate at 0 to 1/4 percent. Members noted that they expected to maintain this target range until they were confident that the economy had weathered recent events and was on track to achieve the Committee's maximum-employment and price-stability goals.
emphasis added
June Employment Preview
by Calculated Risk on 7/01/2020 01:13:00 PM
On Thursday at 8:30 AM ET, the BLS will release the employment report for June (Friday is a holiday). The consensus is for an increase of 3.1 million non-farm payroll jobs, and for the unemployment rate to decrease to 12.3%.
Last month, the BLS reported 2,509,000 jobs added in May and the unemployment rate decreased to 13.3%.
There was quite a bit of discussion last month on misclassification of workers, and it is likely the actual unemployment rate was much higher than 13.3% last month. The BLS put out a note on Monday discussing this issue: Update on the Misclassification that Affected the Unemployment Rate. The BLS is working with the Census Bureau (Census conducts the survey), to minimize misclassification going forward. This means the unemployment rate might be higher than expected in June.
Merrill Lynch economists wrote this morning: "We expect continued recovery in the June jobs report with nonfarm payroll growth of 2.8mn, picking up from +2.5mn in May. The unemployment rate is likely to fall to 12.5% with strong job gains but also a tick up in labor participation."
Note that the ADP report showed 2.369 million private sector jobs added in June; below expectations.
The usual indicators are somewhat useless again this month. For example, the ISM manufacturing employment index increased in June to 42.1% from 31.1% in May, but still well below 50. This would suggest around 60,000 manufacturing jobs lost in June - although ADP showed 88,000 manufacturing jobs added.
And the weekly claims report showed 1.48 million initial unemployment claims last week (about 2.2 million initial claims including Pandemic Unemployment Assistance). This is extremely high, but well down from the reference weeks in April and May.
IMPORTANT: The employment report will probably show a large increase in state and local government education hiring. This is because of a quirk in the seasonal adjustment, see: Will State and Local Governments Hire 1 Million Teachers in June and July? No, but ...
• Conclusion: It appears that quite a few jobs were added in June, and according to the ADP report, many of the jobs were in leisure and hospitality, as restaurants and bars reopened. Some of those jobs will probably be lost in July with the surge in COVID cases.
No matter what the June report shows, there will be millions and millions of people unemployed, and the course of the economy will be determined by the course of the virus.
Construction Spending Decreased in May
by Calculated Risk on 7/01/2020 11:05:00 AM
From the Census Bureau reported that overall construction spending decreased in May:
Construction spending during May 2020 was estimated at a seasonally adjusted annual rate of $1,356.4 billion, 2.1 percent below the revised April estimate of $1,386.1 billion. The May figure is 0.3 percent above the May 2019 estimate of $1,352.9 billion. During the first five months of this year, construction spending amounted to $543.2 billion, 5.7 percent above the $513.7 billion for the same period in 2019.Private spending decreased and public spending increased:
emphasis added
Spending on private construction was at a seasonally adjusted annual rate of $1,001.2 billion, 3.3 percent below the revised April estimate of $1,035.2 billion. ...
In May, the estimated seasonally adjusted annual rate of public construction spending was $355.2 billion, 1.2 percent above the revised April estimate of $350.9 billion.
 Click on graph for larger image.
This graph shows private residential and nonresidential construction spending, and public spending, since 1993. Note: nominal dollars, not inflation adjusted.
Residential spending is 21% below the previous peak.
Non-residential spending is 12% above the previous peak in January 2008 (nominal dollars).
Public construction spending is 9% above the previous peak in March 2009, and 35% above the austerity low in February 2014.
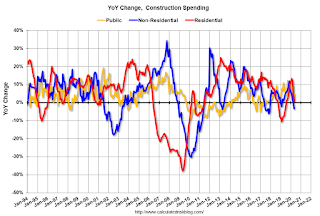
 The second graph shows the year-over-year change in construction spending.
On a year-over-year basis, private residential construction spending is up slightly. Non-residential spending is down 3.4% year-over-year. Public spending is up 4.7% year-over-year.
This was below consensus expectations of a 1% increase in spending, however construction spending for the previous year was revised up.
Construction was considered an essential service in most areas and did not decline sharply like many other sectors.
ISM Manufacturing index Increased to 52.6 in June
by Calculated Risk on 7/01/2020 10:05:00 AM
The ISM manufacturing index indicated expansion in June. The PMI was at 52.6% in June, up from 43.1% in May. The employment index was at 42.1%, up from 32.1% last month, and the new orders index was at 56.4%, up from 31.8%.
From the Institute for Supply Management: June 2020 Manufacturing ISM® Report On Business®
Economic activity in the manufacturing sector grew in June, with the overall economy notching a second month of growth after one month of contraction, say the nation’s supply executives in the latest Manufacturing ISM® Report On Business®.This was above expectations of 49.0%, but the employment index indicated further contraction.
The report was issued today by Timothy R. Fiore, CPSM, C.P.M., Chair of the Institute for Supply Management® (ISM®) Manufacturing Business Survey Committee: “The June PMI® registered 52.6 percent, up 9.5 percentage points from the May reading of 43.1 percent. This figure indicates expansion in the overall economy for the second straight month after April’s contraction, which ended a period of 131 consecutive months of growth. The New Orders Index registered 56.4 percent, an increase of 24.6 percentage points from the May reading of 31.8 percent. The Production Index registered 57.3 percent, up 24.1 percentage points compared to the May reading of 33.2 percent. The Backlog of Orders Index registered 45.3 percent, an increase of 7.1 percentage points compared to the May reading of 38.2 percent. The Employment Index registered 42.1 percent, an increase of 10 percentage points from the May reading of 32.1 percent. The Supplier Deliveries Index registered 56.9 percent, down 11.1 percentage points from the May figure of 68 percent.
emphasis added
This suggests manufacturing expanded slightly in June, after the steep collapse in the previous months.
ADP: Private Employment increased 2,369,000 in June
by Calculated Risk on 7/01/2020 08:19:00 AM
Private sector employment increased by 2,369,000 jobs from May to June according to the June ADP National Employment Report®. ... The report, which is derived from ADP’s actual payroll data, measures the change in total nonfarm private employment each month on a seasonally-adjusted basis.This was below the consensus forecast for 3,000,000 private sector jobs added in the ADP report.
“Small business hiring picked up in the month of June,” said Ahu Yildirmaz, vice president and co-head of the ADP Research Institute. “As the economy slowly continues to recover, we are seeing a significant rebound in industries that once experienced the greatest job losses. In fact, 70 percent of the jobs added this month were in the leisure and hospitality, trade and construction industries.”
The BLS report will be released Thursday (Friday is a holiday), and the consensus is for 3,074,000 non-farm payroll jobs added in June.
MBA: Mortgage Applications Decrease in Latest Weekly Survey
by Calculated Risk on 7/01/2020 07:00:00 AM
From the MBA: Mortgage Applications Decrease in Latest MBA Weekly Survey
Mortgage applications decreased 1.8 percent from one week earlier, according to data from the Mortgage Bankers Association’s (MBA) Weekly Mortgage Applications Survey for the week ending June 26, 2020.
... The Refinance Index decreased 2 percent from the previous week and was 74 percent higher than the same week one year ago. The seasonally adjusted Purchase Index decreased 1 percent from one week earlier. The unadjusted Purchase Index decreased 2 percent compared with the previous week and was 15 percent higher than the same week one year ago.
“Mortgage applications fell last week despite mortgage rates hitting another record low in MBA’s survey. Investors are contemplating the risks of the recent resurgence of COVID-19 cases to the labor market and economy, and Treasury rates and mortgage rates are moving lower as a result,” said Joel Kan, MBA’s Associative Vice President of Economic and Industry Forecasting. “After two months of strong growth, purchase applications declined for the second week in a row. The weakening in activity is potentially a signal that pent-up demand is starting to wane and that low housing supply is limiting prospective buyers’ options. The average purchase application loan size increased to a record high in our survey – more proof that tight inventory conditions are leading to faster price growth.”
Added Kan, “Refinance applications also decreased but remained 74 percent higher than a year ago. The 30-year fixed rate has been below the 3.5 percent mark since late March. It is possible that many borrowers have already refinanced or are waiting for rates to go even lower.”
...
The average contract interest rate for 30-year fixed-rate mortgages with conforming loan balances ($484,350 or less) decreased to 3.29 percent from 3.30 percent, with points increasing to 0.36 from 0.32 (including the origination fee) for 80 percent loan-to-value ratio (LTV) loans.
emphasis added
 Click on graph for larger image.
The first graph shows the refinance index since 1990.
The refinance index has been very volatile recently depending on rates and liquidity.
But the index is up signficantly from last year.
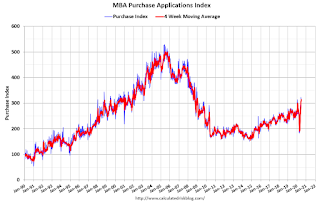
 The second graph shows the MBA mortgage purchase index
According to the MBA, purchase activity is up 15% year-over-year.
Note: Red is a four-week average (blue is weekly).
Tuesday, June 30, 2020
Wednesday: ADP Employment, ISM Mfg Index, Construction Spending, FOMC Minutes
by Calculated Risk on 6/30/2020 08:52:00 PM
Wednesday:
• At 7:00 AM ET, The Mortgage Bankers Association (MBA) will release the results for the mortgage purchase applications index.
• At 8:15 AM, The ADP Employment Report for June. This report is for private payrolls only (no government). The consensus is for 3,000,000 payroll jobs added in June, up from 2,760,000 lost in May.
• At 10:00 AM, ISM Manufacturing Index for June. The consensus is for the ISM to be at 49.0, up from 43.1 in May.
• At 10:00 AM, Construction Spending for May. The consensus is for a 1.0% increase in construction spending.
•All day, Light vehicle sales for June from the BEA. The consensus is for light vehicle sales to be 13.0 million SAAR in June, up from 12.2 million in May (Seasonally Adjusted Annual Rate).
• At 2:00 PM, FOMC Minutes, Meeting of June 9-10, 2020
June 30 COVID-19 Test Results
by Calculated Risk on 6/30/2020 05:59:00 PM
The US is now conducting over 500,000 tests per day, and that might be enough to allow test-and-trace in some areas. Based on the experience of other countries, the percent positive needs to be well under 5% to really push down new infections, so the US still needs to increase the number of tests per day significantly.
According to Dr. Jha of Harvard's Global Health Institute, the US might need more than 900,000 tests per day.
There were 648,838 test results reported over the last 24 hours. This is the most test results reported daily.
There were 44,358 positive tests.

This data is from the COVID Tracking Project.
The percent positive over the last 24 hours was 6.8% (red line).
For the status of contact tracing by state, check out testandtrace.com.
Fannie Mae: Mortgage Serious Delinquency Rate Increased in May
by Calculated Risk on 6/30/2020 04:09:00 PM
Fannie Mae reported that the Single-Family Serious Delinquency increased to 0.89% in May, from 0.70% in April. The serious delinquency rate is up from 0.70% in May 2019.
This is the highest serious delinquency rate since June 2018.
These are mortgage loans that are "three monthly payments or more past due or in foreclosure".
The Fannie Mae serious delinquency rate peaked in February 2010 at 5.59%.

By vintage, for loans made in 2004 or earlier (2% of portfolio), 3.09% are seriously delinquent (up from 2.64% in April). For loans made in 2005 through 2008 (3% of portfolio), 5.22% are seriously delinquent (up from 4.41%), For recent loans, originated in 2009 through 2018 (95% of portfolio), only 0.53% are seriously delinquent (up from 0.38%). So Fannie is still working through a few poor performing loans from the bubble years.
With COVID-19, this rate will increase significantly in June and July (it takes time since these are mortgages three months or more past due).
I believe mortgages in forbearance will be counted as delinquent in this monthly report, but they will not be reported to the credit bureaus.
This is very different from the increase in delinquencies following the housing bubble. Lending standards have been fairly solid over the last decade, and most of these homeowners have equity in their homes - and they will be able to restructure their loans once they are employed.
Note: Freddie Mac reported earlier.


