by Calculated Risk on 2/20/2020 08:32:00 AM
Thursday, February 20, 2020
Weekly Initial Unemployment Claims Increase to 210,000
The DOL reported:
In the week ending February 15, the advance figure for seasonally adjusted initial claims was 210,000, an increase of 4,000 from the previous week's revised level. The previous week's level was revised up by 1,000 from 205,000 to 206,000. The 4-week moving average was 209,000, a decrease of 3,250 from the previous week's revised average. The previous week's average was revised up by 250 from 212,000 to 212,250.The previous week was revised up.
emphasis added
The following graph shows the 4-week moving average of weekly claims since 1971.
 Click on graph for larger image.
The dashed line on the graph is the current 4-week average. The four-week average of weekly unemployment claims decreased to 209,000.
This was close to the consensus forecast.
Wednesday, February 19, 2020
Thursday: Unemployment Claims, Philly Fed Mfg Survey
by Calculated Risk on 2/19/2020 07:06:00 PM
Thursday:
• At 8:30 AM ET, The initial weekly unemployment claims report will be released. The consensus is for 210 thousand initial claims, up from 205 thousand the previous week.
• Also at 8:30 AM, The Philly Fed manufacturing survey for February. The consensus is for a reading of 12.0, down from 17.0.
CAR on California January Housing: Sales up 10.3% YoY, Inventory down 26.9%
by Calculated Risk on 2/19/2020 04:45:00 PM
The CAR reported: California home sales maintain last year’s momentum in January, C.A.R. reports
Closed escrow sales of existing, single-family detached homes in California totaled a seasonally adjusted annualized rate of 395,550 units in January, according to information collected by C.A.R. from more than 90 local REALTOR® associations and MLSs statewide. The statewide annualized sales figure represents what would be the total number of homes sold during 2020 if sales maintained the January pace throughout the year. It is adjusted to account for seasonal factors that typically influence home sales.
January’s sales total was down 0.7 percent from the 398,370 level in December and marked the second straight month that sales fell below the 400,000 benchmark. Still, sales were up a solid 10.3 percent from January 2019, largely due to weak sales of a revised 358,540 a year ago.
“The strong sales momentum that we saw in the second half of last year carried over into the new year, thanks to favorable homebuying conditions,” said 2020 C.A.R. President Jeanne Radsick, a second-generation REALTOR® from Bakersfield, Calif. “And while home sales were up double-digits from a year ago, it’s important to remember that current sales are being compared to a market that one year ago was at its lowest level in 10 years as economic uncertainties clouded the market outlook while the government shutdown delayed escrow closings.”
...
The available supply of homes for sale in the state inched up slightly after reaching an 80-month record low in December but continued to drop on a year-over-year basis for the seventh consecutive month. Housing inventory continued to fall by double digits, with active listings declining 26.9 percent in January after a 25.9 percent dip in December. The January drop was the largest since April 2013.
emphasis added
FOMC Minutes: Policy on Hold
by Calculated Risk on 2/19/2020 02:08:00 PM
From the Fed: Minutes of the Federal Open Market Committee, January 28-29, 2020. A few excerpts:
Participants generally saw the distribution of risks to the outlook for economic activity as somewhat more favorable than at the previous meeting, although a number of downside risks remained prominent. The easing of trade tensions resulting from the recent agreement with China and the passage of the USMCA as well as tentative signs of stabilization in global economic growth helped reduce downside risks and appeared to buoy business sentiment. The risk of a "hard" Brexit had appeared to recede further. In addition, statistical models designed to estimate the probability of recession using financial market data suggested that the likelihood of a recession occurring over the next year had fallen notably in recent months. Still, participants generally expected trade-related uncertainty to remain somewhat elevated, and they were mindful of the possibility that the tentative signs of stabilization in global growth could fade. Geopolitical risks, especially in connection with the Middle East, remained. The threat of the coronavirus, in addition to its human toll, had emerged as a new risk to the global growth outlook, which participants agreed warranted close watching.
...
In their consideration of monetary policy at this meeting, participants judged that it would be appropriate to maintain the target range for the federal funds rate at 1-1/2 to 1-3/4 percent to support sustained expansion of economic activity, strong labor market conditions, and inflation returning to the Committee's symmetric 2 percent objective. With regard to monetary policy beyond this meeting, participants viewed the current stance of policy as likely to remain appropriate for a time, provided that incoming information about the economy remained broadly consistent with this economic outlook. Of course, if developments emerged that led to a material reassessment of the outlook, an adjustment to the stance of monetary policy would be appropriate, in order to foster achievement of the Committee's dual-mandate objectives.
In commenting on the monetary policy outlook, participants concurred that maintaining the current stance of policy would give the Committee time for a fuller assessment of the ongoing effects on economic activity of last year's shift to a more accommodative policy stance and would also allow policymakers to accumulate further information bearing on the economic outlook. Participants discussed how maintaining the current policy stance for a time could be helpful in supporting U.S. economic activity and employment in the face of global developments that have been weighing on spending decisions.
emphasis added
AIA: "Architecture billings continue growth into 2020"
by Calculated Risk on 2/19/2020 12:31:00 PM
Note: This index is a leading indicator primarily for new Commercial Real Estate (CRE) investment.
From the AIA: Architecture billings continue growth into 2020
Starting the year on a strong note, architecture firm billings strengthened slightly in January, according to a new report today from The American Institute of Architects (AIA).
AIA’s Architecture Billings Index (ABI) score of 52.2 for January compared to 52.1 in December reflects an increase in design services provided by U.S. architecture firms (any score above 50 indicates an increase in billings). Indicators of work in the pipeline, including new project inquiries and new design contracts remained positive, posting scores of 57.9 and 56.0 respectively.
“Despite the continued presence of volatility in the economy, design activity has begun to accelerate in recent months,” said AIA Chief Economist, Kermit Baker, Hon. AIA, PhD. “Even with the ongoing challenges facing the nonresidential construction sector, this upturn points to at least modest growth over the coming year.”
...
• Regional averages: South (56.7); West (52.1); Midwest (51.3); Northeast (45.3)
• Sector index breakdown: mixed practice (51.6); commercial/industrial (51.5); multi-family residential (51.2); institutional (51.1)
emphasis added
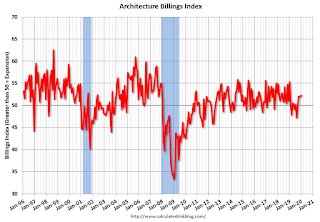
 Click on graph for larger image.
This graph shows the Architecture Billings Index since 1996. The index was at 52.2 in January, up from 52.1 in December. Anything above 50 indicates expansion in demand for architects' services.
Note: This includes commercial and industrial facilities like hotels and office buildings, multi-family residential, as well as schools, hospitals and other institutions.
According to the AIA, there is an "approximate nine to twelve month lag time between architecture billings and construction spending" on non-residential construction. This index has been positive for 8 of the previous 12 months, suggesting some increase in CRE investment in 2020.
Lawler: Early Read on Existing Home Sales in January
by Calculated Risk on 2/19/2020 11:00:00 AM
From housing economist Tom Lawler:
Based on publicly-available local realtor/MLS reports released across the country through today, I project that existing home sales as estimated by the National Association of Realtors ran at a seasonally adjusted annual rate of 5.42 million in January, down 2.2% from December’s preliminary pace (which looks too high) and up 9.9% from last January’s seasonally adjusted pace.
On the inventory front, local realtor/MLS data, as well as data from other inventory trackers, suggest that the inventory of existing homes for sale at the end of January was down by about 12.0% from a year earlier.
Finally, local realtor/MLS data suggest that the median US existing single-family home sales price last month was up by about 7.0% from last January.
Note that this month’s release will incorporate benchmark seasonal adjustment revisions, which makes it a little tricky to estimate January’s seasonal adjustment factor.
Last month the National Association of Realtors estimated that existing home sales ran at a seasonally adjusted annual rate of 5.54 million, well above consensus estimates and, surprisingly, well above my estimate based on local realtor/MLS reports released before the NAR report. In looking at realtor/MLS reports released later than those available when I do my “early read,” it does appear as if my earlier sample did not reflect overall national sales. However, it also appears as if the NAR’s estimate overstated sales in the Midwest and the Northeast. If I had had access to all realtor/MLS reports for December sales I would have projected that existing home sales as estimated by the NAR ran at a seasonally adjusted annual rate of 5.50 million.
CR Note: The National Association of Realtors (NAR) is scheduled to release January existing home sales on Friday, February 21, 2020 at 10:00 AM ET. The consensus is for 5.45 million SAAR.
Comments on January Housing Starts
by Calculated Risk on 2/19/2020 09:14:00 AM
Earlier: Housing Starts decreased to 1.567 Million Annual Rate in January
Total housing starts in January were well above expectations and revisions to prior months were positive.
The housing starts report showed starts were down 3.6% in January compared to December, and starts were up 21.4% year-over-year compared to January 2019.
These were blow out numbers! Starts in December were at the highest level for starts since December 2006 (end of the bubble). However, the weather was very nice again in January (just like in December), and the weather probably had a significant impact on the seasonally adjusted housing starts number. The winter months of December and January have the largest seasonal factors, so nice weather can really have an impact.
Single family starts were up 4.6% year-over-year, and multi-family starts were up 71.3% YoY.
This first graph shows the month to month comparison for total starts between 2019 (blue) and 2020 (red).

Starts were up 21.4% in January compared to January 2019.
For the year, starts were up 3.2% compared to 2018.
Last year, in 2019, starts picked up in the 2nd half of the year, so the comparisons are easy early in the year.
Below is an update to the graph comparing multi-family starts and completions. Since it usually takes over a year on average to complete a multi-family project, there is a lag between multi-family starts and completions. Completions are important because that is new supply added to the market, and starts are important because that is future new supply (units under construction is also important for employment).
These graphs use a 12 month rolling total for NSA starts and completions.

The rolling 12 month total for starts (blue line) increased steadily for several years following the great recession - but turned down, and has moved sideways recently. Completions (red line) had lagged behind - then completions caught up with starts- although starts are picking up a little again.

Note the relatively low level of single family starts and completions. The "wide bottom" was what I was forecasting following the recession, and now I expect some further increases in single family starts and completions.
Housing Starts decreased to 1.567 Million Annual Rate in January
by Calculated Risk on 2/19/2020 08:37:00 AM
From the Census Bureau: Permits, Starts and Completions
Housing Starts:
Privately‐owned housing starts in January were at a seasonally adjusted annual rate of 1,567,000. This is 3.6 percent below the revised December estimate of 1,626,000, but is 21.4 percent above the January 2019 rate of 1,291,000. Single‐family housing starts in January were at a rate of 1,010,000; this is 5.9 percent below the revised December figure of 1,073,000. The January rate for units in buildings with five units or more was 547,000.
Building Permits:
Privately‐owned housing units authorized by building permits in January were at a seasonally adjusted annual rate of 1,551,000. This is 9.2 percent above the revised December rate of 1,420,000 and is 17.9 percent above the January 2019 rate of 1,316,000. Single‐family authorizations in January were at a rate of 987,000; this is 6.4 percent above the revised December figure of 928,000. Authorizations of units in buildings with five units or more were at a rate of 522,000 in January.
emphasis added
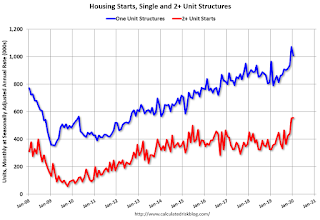
 Click on graph for larger image.
The first graph shows single and multi-family housing starts for the last several years.
Multi-family starts (red, 2+ units) were up in January compared to December. Multi-family starts were up 71.3% year-over-year in January.
Multi-family is volatile month-to-month, and had been mostly moving sideways the last several years.
Single-family starts (blue) decreased in January, and were up 4.6% year-over-year.
 The second graph shows total and single unit starts since 1968.
 The second graph shows the huge collapse following the housing bubble, and then eventual recovery (but still historically low).
Total housing starts in January were well above expectations and revisions were positive.
I'll have more later …
MBA: Mortgage Applications Decreased in Latest Weekly Survey
by Calculated Risk on 2/19/2020 07:00:00 AM
From the MBA: Mortgage Applications Decrease in Latest MBA Weekly Survey
Mortgage applications decreased 6.4 percent from one week earlier, according to data from the Mortgage Bankers Association’s (MBA) Weekly Mortgage Applications Survey for the week ending February 14, 2020.
... The Refinance Index decreased 8 percent from the previous week and was 165 percent higher than the same week one year ago. The seasonally adjusted Purchase Index decreased 3 percent from one week earlier. The unadjusted Purchase Index increased 2 percent compared with the previous week and was 10 percent higher than the same week one year ago.
...
“Treasury yields moved slightly higher last week, despite uncertainty surrounding the economic impact from the spread of the coronavirus. The 30-year fixed mortgage increased five basis points to 3.77 percent as a result, causing refinance applications – driven by a 11 percent drop in applications for conventional refinances – to fall,” said Joel Kan, MBA’s Associate Vice President of Economic and Industry Forecasting. “Even with an 8 percent decline, the refinance index was still at its third highest reading so far this year. Government refinance activity, which tends to lag movements in the conventional market, bucked the overall trend, as VA loan refinances jumped 23 percent.”
Added Kan, “Purchase applications fell 3 percent last week, as there continues to be some pullback after a strong January. Activity was still 10 percent higher than a year ago, but too few options – especially at the lower portion of the market – are slowing some would-be buyers.”
...
The average contract interest rate for 30-year fixed-rate mortgages with conforming loan balances ($510,400 or less) increased to 3.77 percent from 3.72 percent, with points remaining unchanged at 0.28 (including the origination fee) for 80 percent loan-to-value ratio (LTV) loans.
emphasis added
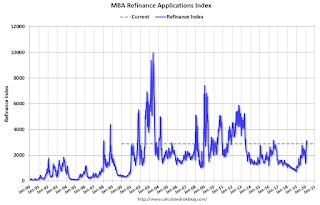
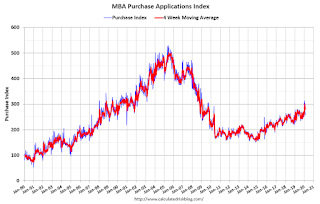
 Click on graph for larger image.
The first graph shows the refinance index since 1990.
With lower rates, we saw a sharp increase in refinance activity, but mortgage rates would have to decline further to see a 2012 size refinance boom.
 The second graph shows the MBA mortgage purchase index
According to the MBA, purchase activity is up 10% year-over-year.
Tuesday, February 18, 2020
Wednesday: Housing Starts, PPI, FOMC Minutes
by Calculated Risk on 2/18/2020 06:49:00 PM
Wednesday:
• At 7:00 AM ET, The Mortgage Bankers Association (MBA) will release the results for the mortgage purchase applications index.
• At 8:30 AM, Housing Starts for January. The consensus is for 1.415 million SAAR, down from 1.608 million SAAR.
• Also at 8:30 AM, The Producer Price Index for December from the BLS. The consensus is for a 0.1% increase in PPI, and a 0.1% increase in core PPI.
• During the day, The AIA's Architecture Billings Index for January (a leading indicator for commercial real estate).
• At 2:00 PM, FOMC Minutes, Meeting of January 28-29, 2020


