by Calculated Risk on 1/22/2020 12:59:00 PM
Wednesday, January 22, 2020
Black Knight's First Look: National Mortgage Delinquency Rate Decreased in December
From Black Knight: Black Knight’s First Look: Strong Close to 2019 Pushes Mortgage Delinquency Rate to Near Record Low
• Mortgage delinquencies fell by nearly 4% month-over-month to within 0.04% of the record low set in May 2019 and more than 12% below last year’s levelAccording to Black Knight's First Look report for December, the percent of loans delinquent decreased in December compared to November, and decreased 12.4% year-over-year.
• The national foreclosure rate fell again in December to reach a new 14-year low, and the lowest on record outside the final five months of 2005
• 2019 ended with just over two million borrowers past due on their mortgage (including active foreclosures) – down 236,000 from the same time last year and the lowest year-end volume since the turn of the century
• After falling by 19% in November, prepayment rates ticked upward in December, suggesting that the recent leveling off of interest rates has had a flattening effect on refinance activity
The percent of loans in the foreclosure process decreased 1.6% in December and were down 11.6% over the last year.
Black Knight reported the U.S. mortgage delinquency rate (loans 30 or more days past due, but not in foreclosure) was 3.40% in December, down from 3.53% in November.
The percent of loans in the foreclosure process decreased to 0.46% from 0.47% in November.
| Black Knight: Percent Loans Delinquent and in Foreclosure Process | ||||
|---|---|---|---|---|
| Dec 2019 | Nov 2019 | Dec 2018 | Dec 2017 | |
| Delinquent | 3.40% | 3.53% | 3.88% | 4.71% |
| In Foreclosure | 0.46% | 0.47% | 0.52% | 0.65% |
| Number of properties: | ||||
| Number of properties that are delinquent, but not in foreclosure: | 1,803,000 | 1,868,000 | 2,013,000 | 2,412,000 |
| Number of properties in foreclosure pre-sale inventory: | 245,000 | 248,000 | 271,000 | 331,000 |
| Total Properties Delinquent or in foreclosure | 2,047,000 | 2,116,000 | 2,283,000 | 2,743,000 |
Comments on December Existing Home Sales
by Calculated Risk on 1/22/2020 10:42:00 AM
Earlier: NAR: Existing-Home Sales Increased to 5.54 million in December
A few key points:
1) Existing home sales were up 10.8% year-over-year (YoY) in December. This was the sixth consecutive month with a YoY increase - following 16 consecutive months with a YoY decrease in sales.
2) Inventory is very low, and was down 8.5% year-over-year (YoY) in December. Inventory always decreases sharply in December as people take their homes off the market for the holidays. However, based on the data I've collected, this was the lowest level for inventory in at least three decades (the previous low was 1.43 million in December 1993).

3) Sales slumped at the end of 2018 and in January 2019 due to higher mortgage rates, the stock market selloff, and fears of an economic slowdown.
Then sales picked up in the second half of 2019 as interest rates declined.
Existing home sales in 2019 (5.344 million) finished the year essentially unchanged from 2018 (5.343 million).

Sales NSA in December (434,000, red column) were the highest for December since 2016.
Overall this was a solid report. The very low level of inventory will be something to watch in 2020.
NAR: Existing-Home Sales Increased to 5.54 million in December
by Calculated Risk on 1/22/2020 10:13:00 AM
From the NAR: Existing-Home Sales Climb 3.6% in December
Existing-home sales grew in December, bouncing back after a slight fall in November, according to the National Association of Realtors®. Although the Midwest saw sales decline, the other three major U.S. regions reported meaningful growth last month.
Total existing-home sales, completed transactions that include single-family homes, townhomes, condominiums and co-ops, increased 3.6% from November to a seasonally-adjusted annual rate of 5.54 million in December. Additionally, overall sales took a significant bounce, up 10.8% from a year ago (5.00 million in December 2019).
...
Total housing inventory at the end of December totaled 1.40 million units, down 14.6% from November and 8.5% from one year ago (1.53 million). Unsold inventory sits at a 3.0-month supply at the current sales pace, down from the 3.7-month figure recorded in both November and December 2018. Unsold inventory totals have dropped for seven consecutive months from year-ago levels, taking a toll on home sales.
emphasis added
 Click on graph for larger image.
This graph shows existing home sales, on a Seasonally Adjusted Annual Rate (SAAR) basis since 1993.
Sales in December (5.54 million SAAR) were up 3.6% from last month, and were 10.8% above the December 2018 sales rate.
The second graph shows nationwide inventory for existing homes.
 According to the NAR, inventory decreased to 1.40 million in December from 1.64 million in November. Headline inventory is not seasonally adjusted, and inventory usually decreases to the seasonal lows in December and January, and peaks in mid-to-late summer.
The last graph shows the year-over-year (YoY) change in reported existing home inventory and months-of-supply. Since inventory is not seasonally adjusted, it really helps to look at the YoY change. Note: Months-of-supply is based on the seasonally adjusted sales and not seasonally adjusted inventory.
 Inventory was down 8.5% year-over-year in December compared to December 2018.
 Months of supply decreased to 3.0 months in December.
This was higher than the consensus forecast. For existing home sales, a key number is inventory - and inventory is at record lows. I'll have more later …
Chicago Fed "Index Points to Slower Economic Growth in December"
by Calculated Risk on 1/22/2020 08:37:00 AM
From the Chicago Fed: Chicago Fed National Activity Index points to slower economic growth in December
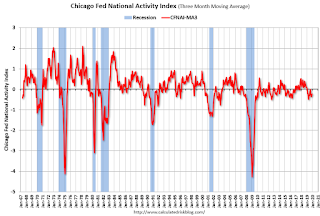
Led by declines in production-related indicators, the Chicago Fed National Activity Index (CFNAI) fell to –0.35 in December from +0.41 in November. Three of the four broad categories of indicators that make up the index decreased from November, and three of the four categories made negative contributions to the index in December. The index’s three-month moving average, CFNAI-MA3, moved up to –0.23 in December from –0.31 in November.This graph shows the Chicago Fed National Activity Index (three month moving average) since 1967.
emphasis added
 Click on graph for larger image.
This suggests economic activity was below the historical trend in December (using the three-month average).
According to the Chicago Fed:
The index is a weighted average of 85 indicators of growth in national economic activity drawn from four broad categories of data: 1) production and income; 2) employment, unemployment, and hours; 3) personal consumption and housing; and 4) sales, orders, and inventories.
...
A zero value for the monthly index has been associated with the national economy expanding at its historical trend (average) rate of growth; negative values with below-average growth (in standard deviation units); and positive values with above-average growth.
MBA: Mortgage Applications Decreased in Latest Weekly Survey
by Calculated Risk on 1/22/2020 07:00:00 AM
From the MBA: Mortgage Applications Decrease in Latest MBA Weekly Survey
Mortgage applications decreased 1.2 percent from one week earlier, according to data from the Mortgage Bankers Association’s (MBA) Weekly Mortgage Applications Survey for the week ending January 17, 2020.
... The Refinance Index decreased 2 percent from the previous week and was 116 percent higher than the same week one year ago. The seasonally adjusted Purchase Index decreased 2 percent from one week earlier. The unadjusted Purchase Index increased 4 percent compared with the previous week and was 8 percent higher than the same week one year ago.
...
“Mortgage applications dipped slightly last week after two weeks of healthy increases, but even with a slight decline, the total pace of applications remains at an elevated level. The purchase market has started 2020 on a strong note, running 8 percent higher than the same week a year ago,” said Joel Kan, MBA’s Associate Vice President of Economic and Industry Forecasting. “Refinance applications remained near the highest level since October 2019, as the 30-year fixed rate was unchanged at 3.87 percent, while the 15-year fixed rate decreased to its lowest level since November 2016. Even with more positive developments surrounding the U.S. and China trade negotiations and healthy retail sales data, investors seemed cautious and maintained their demand for safer U.S. Treasuries, which kept yields lower. Our expectation is that rates will stay along this same narrow range.”
...
The average contract interest rate for 30-year fixed-rate mortgages with conforming loan balances ($510,400 or less) remained unchanged at 3.87 percent, with points decreasing to 0.27 from 0.32 (including the origination fee) for 80 percent loan-to-value ratio (LTV) loans.
emphasis added
 Click on graph for larger image.
The first graph shows the refinance index since 1990.
With lower rates, we saw a sharp increase in refinance activity, but mortgage rates would have to decline further to see a huge refinance boom.
 The second graph shows the MBA mortgage purchase index
According to the MBA, purchase activity is up 8% year-over-year.
Tuesday, January 21, 2020
Wednesday: Existing Home Sales
by Calculated Risk on 1/21/2020 06:36:00 PM
Wednesday:
• At 7:00 AM ET, The Mortgage Bankers Association (MBA) will release the results for the mortgage purchase applications index.
• At 8:30 AM, Chicago Fed National Activity Index for December. This is a composite index of other data.
• At 9:00 AM, FHFA House Price Index for November 2019. This was originally a GSE only repeat sales, however there is also an expanded index.
• During the day, The AIA's Architecture Billings Index for December (a leading indicator for commercial real estate).
• At 10:00 AM, Existing Home Sales for December from the National Association of Realtors (NAR). The consensus is for 5.43 million SAAR, up from 5.35 million.
"Chemical Activity Barometer Rose in January"
by Calculated Risk on 1/21/2020 03:20:00 PM
Note: This appears to be a leading indicator for industrial production.
From the American Chemistry Council: Chemical Activity Barometer Rose in January
The Chemical Activity Barometer (CAB), a leading economic indicator created by the American Chemistry Council (ACC), jumped 0.6 percent in January on a three-month moving average (3MMA) basis following a 0.1 percent gain in December. On a year-over-year (Y/Y) basis, the barometer rose 1.4 percent.
...
"The CAB signals gains in U.S. commerce into the third quarter of 2020,” said Kevin Swift, chief economist at ACC.
...
Applying the CAB back to 1912, it has been shown to provide a lead of two to fourteen months, with an average lead of eight months at cycle peaks as determined by the National Bureau of Economic Research. The median lead was also eight months. At business cycle troughs, the CAB leads by one to seven months, with an average lead of four months. The median lead was three months. The CAB is rebased to the average lead (in months) of an average 100 in the base year (the year 2012 was used) of a reference time series. The latter is the Federal Reserve’s Industrial Production Index.
emphasis added
 Click on graph for larger image.
This graph shows the year-over-year change in the 3-month moving average for the Chemical Activity Barometer compared to Industrial Production. It does appear that CAB (red) generally leads Industrial Production (blue).
The year-over-year change in the CAB suggests that the YoY change in industrial production might have bottomed, and suggests some "gains in U.S. commerce into the third quarter of 2020".
Revisiting: Has Housing Market Activity Peaked?
by Calculated Risk on 1/21/2020 12:38:00 PM
I wrote this in July 2018 (see: Has Housing Market Activity Peaked? and Has the Housing Market Peaked? (Part 2)
First, I think it is likely that existing home sales will move more sideways going forward. However it is important to remember that new home sales are more important for jobs and the economy than existing home sales. Since existing sales are existing stock, the only direct contribution to GDP is the broker's commission. There is usually some additional spending with an existing home purchase - new furniture, etc. - but overall the economic impact is small compared to a new home sale.Since that post, existing home sales have mostly moved sideways, and both new home sales and single family starts have hit new cycle highs.
...
For the economy, what we should be focused on are single family starts and new home sales. As I noted in Investment and Recessions "New Home Sales appears to be an excellent leading indicator, and currently new home sales (and housing starts) are up solidly year-over-year, and this suggests there is no recession in sight."
If new home sales and single family starts have peaked that would be a significant warning sign. Although housing is under pressure from policy (negative impact from tax, immigration and trade policies), I do not think housing has peaked, and I think new home sales and single family starts will increase further over the next couple of years.
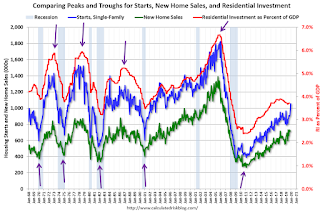
Here is the graph I like to use to track tops and bottoms for housing activity. This is a graph of Single family housing starts, New Home Sales, and Residential Investment (RI) as a percent of GDP.
 Click on graph for larger image.
The arrows point to some of the earlier peaks and troughs for these three measures.
The purpose of this graph is to show that these three indicators generally reach peaks and troughs together. Note that Residential Investment is quarterly and single-family starts and new home sales are monthly.
RI as a percent of GDP has been sluggish recently, mostly due to softness in multi-family residential. However, both single family starts and new home sales have set new cycle highs this year.
Also, look at the relatively low level of RI as a percent of GDP, new home sales and single family starts compared to previous peaks. To have a significant downturn from these levels would be surprising.
Retired Workers and the Overall Labor Force Participation Rate
by Calculated Risk on 1/21/2020 09:08:00 AM
In December I wrote Ten Economic Questions for 2020. I noted that I expect the overall participation rate to start declining again in 2020, pushing down the unemployment rate.
Note: Every month, with the employment report, I focus on the prime participation rate because of changing demographics - but this post is about the overall participation rate.
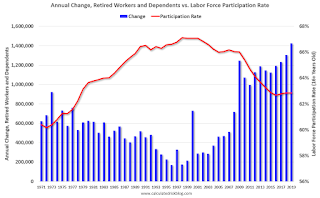
Here is a graph of the annual change in Retired workers and dependent receiving Old-Age Social Security benefits and the annual Labor Force Participation Rate since 1970. This doesn't mean these people are actually retiring (they may still be working), but this gives us an idea of how many people are retiring per year.

The number of people retiring per year was declining until the late '90s, and then started increasing.
The annual overall (16+ years old) participation rate peaked around 2000, and has generally been decreasing as more people retire.
Note: There are other factors involved in the decline in the overall participation rate - such as more people staying in school - but retiring workers is a key.
A few years ago, I predicted the overall participation rate would move mostly sideways or increase slightly as solid employment growth offset the large number of retirements. Now, given demographics, I expect to see a downward trend for the overall participation rate over the next decade, even with a healthy job market.
Monday, January 20, 2020
Monday Night Futures
by Calculated Risk on 1/20/2020 06:28:00 PM
Weekend:
• Schedule for Week of January 19, 2020
Tuesday:
• No major economic releases scheduled.
From CNBC: Pre-Market Data and Bloomberg futures: S&P 500 and DOW futures are down slightly (fair value).
Oil prices were up slightly over the last week with WTI futures at $58.82 per barrel and Brent at $65.20 barrel. A year ago, WTI was at $53, and Brent was at $62 - so oil prices are up 5% to 10% year-over-year.
Here is a graph from Gasbuddy.com for nationwide gasoline prices. Nationally prices are at $2.55 per gallon. A year ago prices were at $2.24 per gallon, so gasoline prices are up 31 cents per gallon year-over-year.


