by Calculated Risk on 8/14/2019 07:00:00 AM
Wednesday, August 14, 2019
MBA: Mortgage Applications Increased Sharply in Latest Weekly Survey
From the MBA: Mortgage Applications Increase in Latest MBA Weekly Survey
Mortgage applications increased 21.7 percent from one week earlier, according to data from the Mortgage Bankers Association’s (MBA) Weekly Mortgage Applications Survey for the week ending August 9, 2019.
... The Refinance Index increased 37 percent from the previous week to its highest level since July 2016, and was 196 percent higher than the same week one year ago. The seasonally adjusted Purchase Index increased 2 percent from one week earlier. The unadjusted Purchase Index increased 1 percent compared with the previous week and was 12 percent higher than the same week one year ago.
...
“The 2019 refinance wave continued, as homeowners last week responded to extraordinarily low mortgage rates. Fears of an escalating trade war, combined with economic and geopolitical concerns, once again pulled U.S. Treasury rates lower. The 30-year fixed mortgage rate decreased eight basis points to 3.93 percent – the lowest level since November 2016 – and has now dropped more than 80 basis points this year,” said Joel Kan, MBA’s Associate Vice President of Economic and Industry Forecasting. “In just the last two weeks, rates have decreased 15 basis points and the refinance index has increased more than 50 percent, reaching its highest level since July 2016. The government refinance index, driven by a 25 percent increase in VA refinance applications, is now at its highest level since May 2013.”
Added Kan, “Purchase applications also benefited from these lower rates, with activity increasing 1.9 percent last week and 12 percent from a year ago.”
...
The average contract interest rate for 30-year fixed-rate mortgages with conforming loan balances ($484,350 or less) decreased to its lowest level since November 2016, 3.93 percent, from 4.01 percent, with points decreasing to 0.35 from 0.37 (including the origination fee) for 80 percent loan-to-value ratio (LTV) loans.
emphasis added
 Click on graph for larger image.
The first graph shows the refinance index since 1990.
Mortgage rates have declined from close to 5% late last year to under 4%.
With lower rates, we saw a sharp increase in refinance activity.
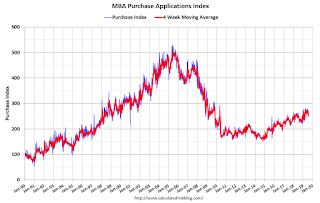 The second graph shows the MBA mortgage purchase index
According to the MBA, purchase activity is up 12% year-over-year.
Tuesday, August 13, 2019
Early Look at 2020 Cost-Of-Living Adjustments and Maximum Contribution Base
by Calculated Risk on 8/13/2019 03:59:00 PM
The BLS reported this morning:
The Consumer Price Index for Urban Wage Earners and Clerical Workers (CPI-W) increased 1.7 percent over the last 12 months to an index level of 250.236 (1982-84=100). For the month, the index rose 0.2 percent prior to seasonal adjustment.CPI-W is the index that is used to calculate the Cost-Of-Living Adjustments (COLA). The calculation dates have changed over time (see Cost-of-Living Adjustments), but the current calculation uses the average CPI-W for the three months in Q3 (July, August, September) and compares to the average for the highest previous average of Q3 months. Note: this is not the headline CPI-U, and is not seasonally adjusted (NSA).
• In 2018, the Q3 average of CPI-W was 246.352.
The 2018 Q3 average was the highest Q3 average, so we only have to compare Q3 this year to last year.
 Click on graph for larger image.
This graph shows CPI-W since January 2000. The red lines are the Q3 average of CPI-W for each year.
Note: The year labeled for the calculation, and the adjustment is effective for December of that year (received by beneficiaries in January of the following year).
CPI-W was up 1.7% year-over-year in July, and although this is early - we need the data for July, August and September - my current guess is COLA will probably be under 2.0% this year, the smallest increase since 2016.
Contribution and Benefit Base
The contribution base will be adjusted using the National Average Wage Index. This is based on a one year lag. The National Average Wage Index is not available for 2018 yet, but wages probably increased again in 2018. If wages increased the same as in 2017, then the contribution base next year will increase to around $137,600 in 2020, from the current $132,900.
Remember - this is an early look. What matters is average CPI-W for all three months in Q3 (July, August and September).
Cleveland Fed: Key Measures Show Inflation Above 2% YoY in July, Core PCE below 2%
by Calculated Risk on 8/13/2019 12:49:00 PM
The Cleveland Fed released the median CPI and the trimmed-mean CPI this morning:
According to the Federal Reserve Bank of Cleveland, the median Consumer Price Index rose 0.3% (3.4% annualized rate) in July. The 16% trimmed-mean Consumer Price Index also rose 0.3% (3.3% annualized rate) during the month. The median CPI and 16% trimmed-mean CPI are measures of core inflation calculated by the Federal Reserve Bank of Cleveland based on data released in the Bureau of Labor Statistics’ (BLS) monthly CPI report.Note: The Cleveland Fed released the median CPI details for July here. Motor fuel was up 34% annualized.
Earlier today, the BLS reported that the seasonally adjusted CPI for all urban consumers rose 0.3% (4.1% annualized rate) in July. The CPI less food and energy also rose 0.3% (3.6% annualized rate) on a seasonally adjusted basis.
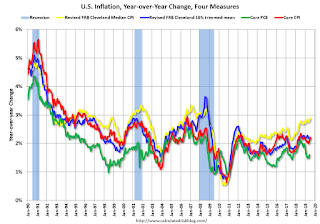 Click on graph for larger image.
This graph shows the year-over-year change for these four key measures of inflation. On a year-over-year basis, the median CPI rose 2.9%, the trimmed-mean CPI rose 2.2%, and the CPI less food and energy rose 2.2%. Core PCE is for June and increased 1.6% year-over-year.
On a monthly basis, median CPI was at 3.4% annualized, trimmed-mean CPI was at 3.3% annualized, and core CPI was at 3.6% annualized.
Overall, these measures are mostly above the Fed's 2% target (Core PCE is below 2%).
NY Fed Q2 Report: "Total Household Debt Climbs for 20th Straight Quarter as Mortgage Debt and Originations Rise"
by Calculated Risk on 8/13/2019 11:09:00 AM
From the NY Fed: Total Household Debt Climbs for 20th Straight Quarter as Mortgage Debt and Originations Rise
The Federal Reserve Bank of New York’s Center for Microeconomic Data today issued its Quarterly Report on Household Debt and Credit, which shows that total household debt increased by $192 billion (1.4%) to $13.86 trillion in the second quarter of 2019. It was the 20th consecutive quarter with an increase, and the total is now $1.2 trillion higher, in nominal terms, than the previous peak of $12.68 trillion in the third quarter of 2008.
Mortgage balances—the largest component of household debt—rose by $162 billion in the second quarter to $9.4 trillion, surpassing the high of $9.3 trillion in the third quarter of 2008. Mortgage originations, which include mortgage refinances, also increased by $130 billion to $474 billion, the highest volume seen since the third quarter of 2017.
…
“While nominal mortgage balances are now slightly above the previous peak seen in the third quarter of 2008, mortgage delinquencies and the average credit profile of mortgage borrowers have continued to improve,” said Wilbert van der Klaauw, senior vice president at the New York Fed. “The data suggest a more nuanced picture for other forms of household debt, with credit card delinquency rates continuing to rise.”
emphasis added
 Click on graph for larger image.
Here are two graphs from the report:
The first graph shows aggregate consumer debt increased in Q2. Household debt previously peaked in 2008, and bottomed in Q2 2013.
From the NY Fed:
Aggregate household debt balances increased by $192 billion in the second quarter of 2019, a 1.4% increase, and now stand at 13.86 trillion. Balances have been steadily rising for five years and in aggregate are now $1.2 trillion higher, in nominal terms, than the previous peak (2008Q3) peak of $12.68 trillion. Overall household debt is now 24.3% above the 2013Q2 trough.
Mortgage balances shown on consumer credit reports on June 30 stood at $9.4 trillion, a $162 billion increase from 2019Q1. Balances on home equity lines of credit (HELOC) continued the declining trend in place since 2009, with a decline of $7 billion, and now stand at $399 billion. Non-housing balances increased by $37 billion in the second quarter, with a $17 billion increase in auto loan balances and a $20 billion increase in credit card balances offsetting an $8 billion decline in student loan balances.
 The second graph shows the percent of debt in delinquency.
The overall delinquency rate decreased in Q2. From the NY Fed:
Aggregate delinquency rates improved in the second quarter of 2019. As of June 30, 4.4% of outstanding debt was in some stage of delinquency. Of the $604 billion of debt that is delinquent, $405 billion is seriously delinquent (at least 90 days late or “severely derogatory”, which includes some debts that have previously been charged off although the lenders are continuing collection attempts). The share of credit card balances transitioning into 90+ day delinquency has been rising since 2017, and continued to do so in Q2. Meanwhile the flow into 90+ day delinquency for auto loan balances has risen more than 70 bps since 2012 and experienced a slight seasonal decline this quarter. Student loan delinquency transition rates remain at high levels relative to other types of debt, and increased this quarter; 9.9% of student loan balances became seriously delinquent in the second quarter (at an annual rate).There is much more in the report.
MBA: "Mortgage Delinquencies Rise in the Second Quarter of 2019"
by Calculated Risk on 8/13/2019 10:38:00 AM
From the MBA: Mortgage Delinquencies Rise in the Second Quarter of 2019
The delinquency rate for mortgage loans on one-to-four-unit residential properties increased to a seasonally adjusted rate of 4.53 percent of all loans outstanding at the end of the second quarter of 2019, according to the Mortgage Bankers Association's (MBA) National Delinquency Survey. The foreclosure inventory rate, the percentage of loans in the foreclosure process, was 0.90 percent last quarter - the lowest since the fourth quarter of 1995.
The delinquency rate was up 11 basis points from the first quarter of 2019 and 17 basis points from one year ago. The percentage of loans on which foreclosure actions were started in the second quarter rose by two basis points to 0.25 percent.
"The unemployment rate remains quite low, but the national mortgage delinquency rate in the second quarter rose from both the first quarter and one year ago. The economy is slowing, and this poses the risk of further increases in delinquency rates," said Marina Walsh, MBA's Vice President of Industry Analysis. "Across loan types, the FHA delinquency rate posted the largest variance, increasing 29 basis points from last quarter and 52 basis points from a year ago."
Added Walsh, "Heavy rains and flooding, extreme heat, and tornadoes in certain states during the spring, may have also contributed to the increase in the delinquency rate, as some borrowers likely faced disruption or hardship."
...
Compared to last quarter, the seasonally adjusted mortgage delinquency rate increased for all loans outstanding. By stage, the 30-day delinquency rate increased four basis points to 2.62 percent, the 60-day delinquency rate remained unchanged at 0.81 percent, and the 90-day delinquency bucket increased seven basis points to 1.10 percent.
...
The delinquency rate includes loans that are at least one payment past due, but does not include loans in the process of foreclosure. The percentage of loans in the foreclosure process at the end of the second quarter was 0.90 percent, down two basis points from the first quarter of 2019 and 15 basis points lower than one year ago. This is the lowest foreclosure inventory rate since the fourth quarter of 1995.
...
The serious delinquency rate, the percentage of loans that are 90 days or more past due or in the process of foreclosure, was at 1.95 percent - a decrease of 1 basis point from last quarter and a decrease of 35 basis points from last year.
…
The five states with the largest increases in their overall delinquency rate were affected by weather-related issues. This may have resulted in an increase in delinquencies over the previous quarter of the following magnitude: West Virginia (86 basis points), Mississippi (81 basis points), Alabama (73 basis points), Indiana (73 basis points), and New Mexico (65 basis points).
emphasis added
 Click on graph for larger image.
This graph shows the percent of loans delinquent by days past due. There was an increase in delinquencies in Q2 - probably due to weather - but the overall level is low.
The percent of loans in the foreclosure process continues to decline, and is now at the lowest level since 1995.
Small Business Optimism Index Increased in July
by Calculated Risk on 8/13/2019 08:44:00 AM
CR Note: Most of this survey is noise, but there is some information, especially on the labor market and the "Single Most Important Problem".
From the National Federation of Independent Business (NFIB): July 2019 Report: Small Business Optimism Index
The Optimism Index rose 1.4 points to 104.7, an exceptional reading. Seven of the 10 components advanced, two fell, and one was unchanged.
..
Job creation slowed in July, falling to an average addition of 0.12 workers per firm on average. Finding qualified workers is becoming increasingly difficult with a 46-year record high of 26 percent reporting finding qualified workers as their number one problem.
emphasis added
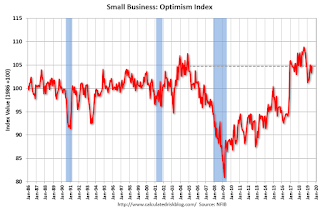 Click on graph for larger image.
This graph shows the small business optimism index since 1986.
The index increased to 104.7 in July.
Note: Usually small business owners complain about taxes and regulations (currently 2nd and 3rd on the "Single Most Important Problem" list). However, during the recession, "poor sales" was the top problem. Now the difficulty of finding qualified workers is the top problem.
BLS: CPI increased 0.3% in July, Core CPI increased 0.3%
by Calculated Risk on 8/13/2019 08:32:00 AM
The Consumer Price Index for All Urban Consumers (CPI-U) increased 0.3 percent in July on a seasonally adjusted basis after rising 0.1 percent in June, the U.S. Bureau of Labor Statistics reported today. Over the last 12 months, the all items index increased 1.8 percent before seasonal adjustment.Inflation was above expectations in July. I'll post a graph later today after the Cleveland Fed releases the median and trimmed-mean CPI.
...
The index for all items less food and energy rose 0.3 in July, the same increase as in June. The July rise was broad-based, with increases in the indexes for shelter, medical care, airline fares, household furnishings and operations, apparel, and personal care all contributing to the increase.
...
The all items index increased 1.8 percent for the 12 months ending July, a larger increase than the 1.6-percent rise for the period ending June. The index for all items less food and energy rose 2.2 percent over the last 12 months, slightly more than the 2.1-percent increase for the period ending June.
emphasis added
Monday, August 12, 2019
Tuesday: CPI, Q2 Quarterly Report on Household Debt and Credit
by Calculated Risk on 8/12/2019 07:07:00 PM
From Matthew Graham at Mortgage News Daily: Mortgage Rates Miraculously Flat Despite Massively Lower Treasury Yields
Mortgage rates were unchanged to slightly higher today ... despite a substantial drop in Treasury yields, mortgage rates are stuck in the mud. [Most Prevalent Rates 30YR FIXED - 3.625% - 3.75%]Tuesday:
emphasis added
• At 6:00 AM ET, NFIB Small Business Optimism Index for July.
• At 8:30 AM, The Consumer Price Index for July from the BLS. The consensus is for a 0.2% increase in CPI, and a 0.2% increase in core CPI.
• At 11:00 AM, NY Fed: Q2 Quarterly Report on Household Debt and Credit
Census Bureau to Hire "about 40,000" Temp Workers Now
by Calculated Risk on 8/12/2019 03:27:00 PM
CR Note: This will impact the August employment report. See: How to Report the Monthly Employment Number excluding Temporary Census Hiring
From the Census Bureau: U.S. Census Bureau Announces the Start of First Major Field Operation for 2020 Census
Today, the U.S. Census Bureau briefed the media on the launch of address canvassing, the first major field operation of the 2020 Census. Address canvassing improves and refines the Census Bureau’s address list of households nationwide, which is necessary to deliver invitations to respond to the census. The address list plays a vital role in ensuring a complete and accurate count of everyone living in the United States.
“The Census Bureau is dedicated to ensuring that we are on track, and ready to accomplish the mission of the 2020 Census,” said Census Bureau Director Steven Dillingham. “We have made many improvements and innovations over the past decade, including better technologies for canvassing neighborhoods and developing complete and updated address listings and maps.”
The Census Bureau created new software called the Block Assessment, Research and Classification Application (BARCA). It compares satellite images of the United States over time, allowing Census Bureau employees to spot new housing developments, changes in existing homes and other housing units that did not previously exist. Reviewers also use BARCA to compare the number of housing units in current imagery with the number of addresses on file for each block.
“We were able to verify 65% of addresses using satellite imagery — a massive accomplishment for us,” said Census Bureau Geography Division Chief Deirdre Bishop during the briefing. “In 2010 we had to hire 150,000 people to verify 100% of the addresses in the field, this decade we will only have to hire about 40,000 employees around the nation to verify the remaining 35% of addresses.”
emphasis added
LA area Port Traffic Down Year-over-year in July
by Calculated Risk on 8/12/2019 12:49:00 PM
Special note: The expansion to the Panama Canal was completed in 2016 (As I noted a few years ago), and some of the traffic that used the ports of Los Angeles and Long Beach is probably going through the canal. This might be impacting TEUs on the West Coast.
Container traffic gives us an idea about the volume of goods being exported and imported - and usually some hints about the trade report since LA area ports handle about 40% of the nation's container port traffic.
The following graphs are for inbound and outbound traffic at the ports of Los Angeles and Long Beach in TEUs (TEUs: 20-foot equivalent units or 20-foot-long cargo container).
To remove the strong seasonal component for inbound traffic, the first graph shows the rolling 12 month average.
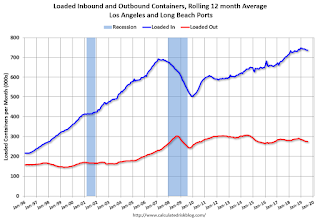
On a rolling 12 month basis, inbound traffic was up slightly in July compared to the rolling 12 months ending in June. Outbound traffic was down 0.4% compared to the rolling 12 months ending the previous month.
The 2nd graph is the monthly data (with a strong seasonal pattern for imports).
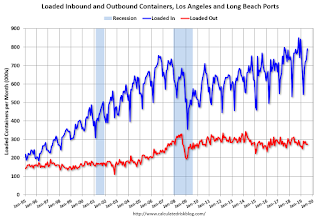
In general imports have been increasing, and exports have mostly moved sideways over the last 8 years.


