by Calculated Risk on 5/13/2019 08:19:00 PM
Monday, May 13, 2019
Tuesday: NY Fed Quarterly Report on Household Debt and Credit, Small Business Index
Tuesday:
• At 6:00 AM ET, NFIB Small Business Optimism Index for April.
• At 11:00 AM, NY Fed: Q1 Quarterly Report on Household Debt and Credit
"Lowest Mortgage Rates in More Than a Month"
by Calculated Risk on 5/13/2019 05:20:00 PM
From Matthew Graham at Mortgage News Daily: Lowest Mortgage Rates in More Than a Month
Mortgage rates moved moderately lower to start the new week as trade tensions remained in focus. In general, the worse the US/China trade relationship is looking at any given moment, the better it has been for the bond market (and the worse it's been for stocks).CR Note: The decline in mortgage rates - from around 5% late last year, to just over 4% - has given the housing market a lift.
…
Today's drop brings the average lender back to the lowest rates since April 2. [30YR FIXED - 4.125-4.25%]
Trends in Educational Attainment in the U.S. Labor Force
by Calculated Risk on 5/13/2019 12:51:00 PM
The first graph shows the unemployment rate by four levels of education (all groups are 25 years and older) through April 2019.
Unfortunately this data only goes back to 1992 and includes only two recessions (the stock / tech bust in 2001, and the housing bust/financial crisis). Clearly education matters with regards to the unemployment rate - and all four groups are generally trending down.

Note: This says nothing about the quality of jobs - as an example, a college graduate working at minimum wage would be considered "employed".
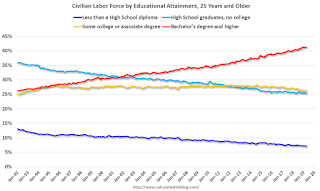
This brings up an interesting question: What is the composition of the labor force by educational attainment, and how has that been changing over time?
Note: Thanks to Tim Duy, Economics Professor at the University of Oregon, and Josh Lehner, at the Oregon Office of Economic Analysis.
Here is some data on the U.S. labor force by educational attainment since 1992.

This is the only category trending up. "Some college" has declined recently, and both "high school" and "less than high school" have been trending down for some time.
Based on current trends, probably more than half the labor force will have at least a bachelor's degree around 2030 or so.
Some thoughts: Since workers with bachelor's degrees typically have a lower unemployment rate, this is probably a factor in pushing down the overall unemployment rate over time.
Also, I'd guess more education means less labor turnover, and that education is a factor in fewer weekly claims (I haven't seen data on unemployment claims by education).
A more educated labor force is one of the reasons I remain optimistic about the future.
LA area Port Traffic Down Year-over-year in April
by Calculated Risk on 5/13/2019 10:08:00 AM
Special note: The expansion to the Panama Canal was completed in 2016 (As I noted a few years ago), and some of the traffic that used the ports of Los Angeles and Long Beach is probably going through the canal. This might be impacting TEUs on the West Coast.
On the impact of the trade war, from Port of Long Beach Executive Director Mario Cordero: “With peak season approaching, we’re expecting imports to continue to grow, but it’s clear exports are suffering under the weight of tariffs.” emphasis added
Container traffic gives us an idea about the volume of goods being exported and imported - and usually some hints about the trade report since LA area ports handle about 40% of the nation's container port traffic.
The following graphs are for inbound and outbound traffic at the ports of Los Angeles and Long Beach in TEUs (TEUs: 20-foot equivalent units or 20-foot-long cargo container).
To remove the strong seasonal component for inbound traffic, the first graph shows the rolling 12 month average.

On a rolling 12 month basis, inbound traffic was up 0.1% in April compared to the rolling 12 months ending in March. Outbound traffic was down 0.8% compared to the rolling 12 months ending the previous month.
The 2nd graph is the monthly data (with a strong seasonal pattern for imports).

In general imports have been increasing, and exports have mostly moved sideways over the last 8 years.
Sunday, May 12, 2019
Sunday Night Futures
by Calculated Risk on 5/12/2019 09:56:00 PM
Weekend:
• Schedule for Week of May 12, 2019
Monday:
• No major economic releases scheduled.
From CNBC: Pre-Market Data and Bloomberg futures: S&P 500 are down 22 and DOW futures are down 200 (fair value).
Oil prices were up over the last week with WTI futures at $61.58 per barrel and Brent at $70.73 per barrel. A year ago, WTI was at $71, and Brent was at $78 - so oil prices are down 10% to 15% year-over-year.
Here is a graph from Gasbuddy.com for nationwide gasoline prices. Nationally prices are at $2.85 per gallon. A year ago prices were at $2.86 per gallon, so gasoline prices are unchanged per gallon year-over-year.
Q2 GDP Forecasts: Around 2%
by Calculated Risk on 5/12/2019 09:55:00 AM
From Merrill Lynch:
We are tracking 3.0% for 1Q GDP. ... 2Q remains at 2.1%. [May 10 estimate]From the NY Fed Nowcasting Report
emphasis added
The New York Fed Staff Nowcast stands at 2.2% for 2019:Q2. [May 10 estimate].And from the Altanta Fed: GDPNow
The GDPNow model estimate for real GDP growth (seasonally adjusted annual rate) in the second quarter of 2019 is 1.6 percent on May 9, down from 1.7 percent on May 3. [May 9 estimate]CR Note: These early estimates suggest real GDP growth will be around 2% annualized in Q2.
Saturday, May 11, 2019
Schedule for Week of May 12, 2019
by Calculated Risk on 5/11/2019 08:11:00 AM
The key reports this week are April housing starts and retail sales.
For manufacturing, the April Industrial Production report and the May NY and Philly Fed manufacturing surveys will be released this week.
No major economic releases scheduled.
6:00 AM ET: NFIB Small Business Optimism Index for April.
11:00 AM: NY Fed: Q1 Quarterly Report on Household Debt and Credit
7:00 AM ET: The Mortgage Bankers Association (MBA) will release the results for the mortgage purchase applications index.
 8:30 AM: Retail sales for April is scheduled to be released. The consensus is for 0.3% increase in retail sales.
This graph shows the year-over-year change in retail sales and food service (ex-gasoline) since 1993. Retail and Food service sales, ex-gasoline, increased by 3.65% on a YoY basis in March.
8:30 AM: The New York Fed Empire State manufacturing survey for May. The consensus is for a reading of 9.9, down from 10.1.
 9:15 AM: The Fed will release Industrial Production and Capacity Utilization for April.
This graph shows industrial production since 1967.
The consensus is for a no change in Industrial Production, and for Capacity Utilization to be unchanged at 78.8%.
10:00 AM: The May NAHB homebuilder survey. Any number above 50 indicates that more builders view sales conditions as good than poor.
8:30 AM: The initial weekly unemployment claims report will be released. The consensus is for 219 thousand initial claims, down from 228 thousand last week.
 8:30 AM ET: Housing Starts for April.
 This graph shows single and total housing starts since 1968.
The consensus is for 1.200 million SAAR, up from 1.139 million SAAR in March.
8:30 AM: the Philly Fed manufacturing survey for May. The consensus is for a reading of 9.3, up from 8.5.
10:00 AM: University of Michigan's Consumer sentiment index (Preliminary for May).
10:00 AM: State Employment and Unemployment (Monthly) for April 2019
Friday, May 10, 2019
Mortgage Rates and Ten Year Yield
by Calculated Risk on 5/10/2019 02:43:00 PM
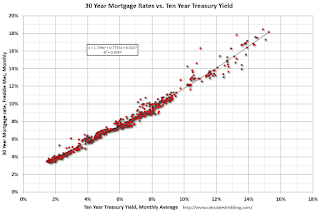
With the ten year yield at 2.45%, and based on an historical relationship, 30-year rates should currently be around 4.4%.
As of yesterday, Mortgage News Daily reported: Mortgage Rates Unchanged to Slightly Lower
Mortgage rates were just slightly lower on average today with some lenders flat and others distinctly lower. [30YR FIXED - 4.25%]The graph shows the relationship between the monthly 10 year Treasury Yield and 30 year mortgage rates from the Freddie Mac survey.
emphasis added
 Currently the 10 year Treasury yield is at 2.45%, and 30 year mortgage rates were at 4.10% according to the Freddie Mac survey this week.
To fall to 4% on the Freddie Mac survey, and based on the historical relationship, the Ten Year yield would have to fall to around 2.1%
To increase to 5% (on the Freddie Mac survey), based on the historical relationship, the Ten Year yield would have to increase to about 3.3%.
Cleveland Fed: Key Measures Show Inflation Close to 2% in April
by Calculated Risk on 5/10/2019 11:13:00 AM
The Cleveland Fed released the median CPI and the trimmed-mean CPI this morning:
According to the Federal Reserve Bank of Cleveland, the median Consumer Price Index rose 0.2% (2.4% annualized rate) in April. The 16% trimmed-mean Consumer Price Index also rose 0.2% (2.0% annualized rate) during the month. The median CPI and 16% trimmed-mean CPI are measures of core inflation calculated by the Federal Reserve Bank of Cleveland based on data released in the Bureau of Labor Statistics’ (BLS) monthly CPI report.Note: The Cleveland Fed released the median CPI details for April here. Motor fuel increased at a 93.3% annualized rate in April.
Earlier today, the BLS reported that the seasonally adjusted CPI for all urban consumers rose 0.3% (3.9% annualized rate) in April. The CPI less food and energy rose 0.1% (1.7% annualized rate) on a seasonally adjusted basis.
 Click on graph for larger image.
This graph shows the year-over-year change for these four key measures of inflation. On a year-over-year basis, the median CPI rose 2.8%, the trimmed-mean CPI rose 2.3%, and the CPI less food and energy rose 2.1%. Core PCE is for March and increased 1.6% year-over-year.
On a monthly basis, median CPI was at 2.4% annualized, trimmed-mean CPI was at 2.0% annualized, and core CPI was at 1.7% annualized.
Using these measures, inflation was about the same in April as in March on a year-over-year basis. Overall, these measures are at or above the Fed's 2% target (Core PCE is below 2%).
BLS: CPI increase 0.3% in April, Core CPI increased 0.1%
by Calculated Risk on 5/10/2019 08:37:00 AM
The Consumer Price Index for All Urban Consumers (CPI-U) increased 0.3 percent in April on a seasonally adjusted basis after rising 0.4 percent in March, the U.S. Bureau of Labor Statistics reported today. Over the last 12 months, the all items index increased 2.0 percent before seasonal adjustment.I'll post a graph later today after the Cleveland Fed releases the median and trimmed-mean CPI.
...
The index for all items less food and energy increased 0.1 percent for the third consecutive month.
...
The all items index increased 2.0 percent for the 12 months ending April, the largest 12-month increase since the period ending November 2018. The index for all items less food and energy rose 2.1 percent over the last 12 months, and the food index rose 1.8 percent.
emphasis added


