by Calculated Risk on 4/15/2019 07:03:00 PM
Monday, April 15, 2019
Tuesday: Industrial Production, Homebuilder Survey
From Matthew Graham at Mortgage News Daily: Mortgage Rates Highest in More Than 3 Weeks
Mortgage rates continued higher to start the week, following a relatively sharp increase on Friday. … This brings the average lender to the highest levels seen since before the Fed's rate-friendly announcement back on March 20th. [30YR FIXED - 4.25%]Tuesday:
emphasis added
• At 9:15 AM, The Fed will release Industrial Production and Capacity Utilization for March. The consensus is for a 0.3% increase in Industrial Production, and for Capacity Utilization to increase to 79.2%.
• At 10:00 AM, The April NAHB homebuilder survey. The consensus is for a reading of 63, up from 62. Any number above 50 indicates that more builders view sales conditions as good than poor.
Phoenix Real Estate in March: Sales down 11% YoY, Active Inventory up 9% YoY
by Calculated Risk on 4/15/2019 04:11:00 PM
This is a key housing market to follow since Phoenix saw a large bubble / bust followed by strong investor buying.
The Arizona Regional Multiple Listing Service (ARMLS) reports ("Stats Report"):
1) Overall sales declined to 8,344 in March, from 9,402 in March 2018. Sales were UP 30.2% from February 2019, but down 11.3% from March 2018.
2) Active inventory was at 18,182, up from 16,645 in March 2018. This is up 9.2% year-over-year. This is the fifth consecutive month with a YoY increase in active inventory.
The last five months - with a YoY increase - followed twenty-four consecutive months with a YoY decrease in inventory in Phoenix.
Months of supply decreased from 3.63 in February to 2.78 in March. This is still low.
Oil: Rig Counts increased Slightly
by Calculated Risk on 4/15/2019 01:43:00 PM
A few comments from Steven Kopits of Princeton Energy Advisors LLC on April 14, 2019:
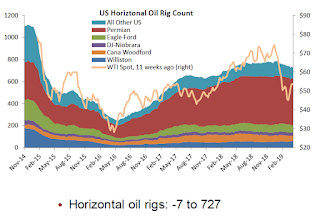
• Oil rigs rose 2, to 833
• Horizontal oil rigs gave back almost their entire gains of last week, -7 to 727
• The Permian gave back 3 of last week’s 8 gains in horizontal oil rig adds: -3 to 423
• Last week’s bottom for the mini-cycle is holding, but just barely
 Click on graph for larger image.
CR note: This graph shows the US horizontal rig count by basin.
Graph and comments Courtesy of Steven Kopits of Princeton Energy Advisors LLC.
Looking Back: What is a Depression?
by Calculated Risk on 4/15/2019 12:00:00 PM
Sometimes it is fun to look back. I remember watching CNBC in March 2009, and it seemed every talking head was bearish - and many were predicting a depression. Below is an excerpt from one of a series of my more positive posts in 2009 (after being very negative for several years). Not perfect, but clearly my outlook was changing.
Those of us looking for the economy to bottom were definitely in the minority!
In early March 2009, I wrote: What is a depression?
It seems like the "D" word is everywhere. And that raises a question: what is a depression? Although there is no formal definition, most economists agree it is a prolonged slump with a 10% or more decline in real GDP.Note:
...
I still think a depression is very unlikely. More likely the economy will bottom later this year or at least the rate of economic decline will slow sharply. I also still believe that the eventual recovery will be very sluggish, and it will take some time to return to normal growth.
...
It is possible - see Looking for the Sun - that new home sales and housing starts will bottom in 2009, but any recovery in housing will probably be sluggish.
That leaves Personal Consumption Expenditures (PCE) - and as households increase their savings rate to repair their balance sheets, it seems unlikely that PCE will increase significantly any time soon. So even if the economy bottoms in the 2nd half of 2009, any recovery will probably be very sluggish.
1) The recession ended in June 2009 according to NBER.
2) Housing starts bottomed in 2009, but new home sales didn't bottom until 2010-2011. Note: I predicted house prices would continue to decline, and finally called the bottom for house prices in Feb 2012.
3) The recovery was sluggish - for housing, PCE, and the overall economy.
NY Fed: Manufacturing "Business activity grew modestly in New York State"
by Calculated Risk on 4/15/2019 08:40:00 AM
From the NY Fed: Empire State Manufacturing Survey
Business activity grew modestly in New York State, according to firms responding to the April 2019 Empire State Manufacturing Survey. The headline general business conditions index rose six points to 10.1, indicating that growth picked up somewhat but remained fairly subdued. New orders rose slightly, and shipments continued to grow modestly. Delivery times and inventories both increased. Labor market indicators pointed to ongoing employment gains and a small increase in hours worked.This was slightly above the consensus forecast.
Optimism about the six-month outlook was much lower than last month. The index for future business conditions dropped seventeen points to 12.4—its lowest level in more than three years.
emphasis added
Sunday, April 14, 2019
Sunday Night Futures
by Calculated Risk on 4/14/2019 09:06:00 PM
Weekend:
• Schedule for Week of April 14, 2019
Monday:
• 8:30 AM, The New York Fed Empire State manufacturing survey for April. The consensus is for a reading of 6.8, up from 3.7.
From CNBC: Pre-Market Data and Bloomberg futures: S&P 500 and DOW futures are mostly unchanged (fair value).
Oil prices were up over the last week with WTI futures at $63.45 per barrel and Brent at $71.24 per barrel. A year ago, WTI was at $67, and Brent was at $73 - so oil prices are down slightly year-over-year.
Here is a graph from Gasbuddy.com for nationwide gasoline prices. Nationally prices are at $2.83 per gallon. A year ago prices were at $2.70 per gallon, so gasoline prices are up 13 cents per gallon year-over-year.
LA area Port Traffic Down Year-over-year in March
by Calculated Risk on 4/14/2019 11:28:00 AM
Special note: The expansion to the Panama Canal was completed in 2016 (As I noted two years ago), and some of the traffic that used the ports of Los Angeles and Long Beach is probably going through the canal. This might be impacting TEUs on the West Coast.
Container traffic gives us an idea about the volume of goods being exported and imported - and usually some hints about the trade report since LA area ports handle about 40% of the nation's container port traffic.
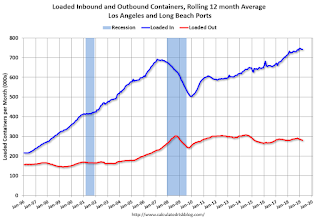
The following graphs are for inbound and outbound traffic at the ports of Los Angeles and Long Beach in TEUs (TEUs: 20-foot equivalent units or 20-foot-long cargo container).
To remove the strong seasonal component for inbound traffic, the first graph shows the rolling 12 month average.

On a rolling 12 month basis, inbound traffic was up 0.1% in March compared to the rolling 12 months ending in February. Outbound traffic was down 0.5% compared to the rolling 12 months ending the previous month.
The 2nd graph is the monthly data (with a strong seasonal pattern for imports).

In general imports have been increasing, and exports have mostly moved sideways over the last 8 years.
Saturday, April 13, 2019
Schedule for Week of April 14, 2019
by Calculated Risk on 4/13/2019 08:11:00 AM
The key reports this week are March housing starts and retail sales. Other key reports include March industrial production and the February trade deficit.
For manufacturing, the March Industrial Production report and the April NY and Philly Fed manufacturing surveys will be released this week.
8:30 AM: The New York Fed Empire State manufacturing survey for April. The consensus is for a reading of 6.8, up from 3.7.
 9:15 AM: The Fed will release Industrial Production and Capacity Utilization for March.
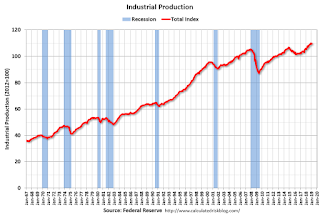
This graph shows industrial production since 1967.
The consensus is for a 0.3% increase in Industrial Production, and for Capacity Utilization to increase to 79.2%.
10:00 AM: The April NAHB homebuilder survey. The consensus is for a reading of 63, up from 62. Any number above 50 indicates that more builders view sales conditions as good than poor.
7:00 AM ET: The Mortgage Bankers Association (MBA) will release the results for the mortgage purchase applications index.
 8:30 AM: Trade Balance report for February from the Census Bureau.
 This graph shows the U.S. trade deficit, with and without petroleum, through the most recent report. The blue line is the total deficit, and the black line is the petroleum deficit, and the red line is the trade deficit ex-petroleum products.
The consensus is the trade deficit to be $53.7 billion. The U.S. trade deficit was at $51.1 billion in January.
During the day: The AIA's Architecture Billings Index for March (a leading indicator for commercial real estate).
2:00 PM: the Federal Reserve Beige Book, an informal review by the Federal Reserve Banks of current economic conditions in their Districts.
8:30 AM: The initial weekly unemployment claims report will be released. The consensus is for 206 thousand initial claims, up from 196 thousand the previous week.
 8:30 AM: Retail sales for March is scheduled to be released. The consensus is for 0.8% increase in retail sales.
This graph shows the year-over-year change in retail sales and food service (ex-gasoline) since 1993. Retail and Food service sales, ex-gasoline, increased by 3.2% on a YoY basis in February.
8:30 AM: the Philly Fed manufacturing survey for April. The consensus is for a reading of 10.2, down from 13.7.
 8:30 AM ET: Housing Starts for March.
 This graph shows single and total housing starts since 1968.
The consensus is for 1.230 million SAAR, up from 1.162 million SAAR in February.
10:00 AM: State Employment and Unemployment (Monthly) for March 2019
Friday, April 12, 2019
The Longest Expansions in U.S. History
by Calculated Risk on 4/12/2019 02:29:00 PM
According to NBER, the four longest expansions in U.S. history are:
1) From a trough in March 1991 to a peak in March 2001 (120 months).
2) From a trough in June 2009 to today, April 2019 (118 months and counting).
3) From a trough in February 1961 to a peak in December 1969 (106 months).
4) From a trough in November 1982 to a peak in July 1990 (92 months).
So the current U.S. expansion is currently the second longest on record, and it seems extremely likely that the current expansion will surpass the '90s expansion in a few months.
As I noted in late 2017 in Is a Recession Imminent? (one of the five questions I'm frequently asked)
Expansions don't die of old age! There is a very good chance this will become the longest expansion in history.A key reason the current expansion has been so long is that housing didn't contribute for the first few years of the expansion. Also the housing recovery was sluggish for a few more years after the bottom in 2011. This was because of the huge overhang of foreclosed properties coming on the market. Single family housing starts and new home sales both bottomed in 2011 - so this is just the eight year of housing expansion - and I expect further increases in starts and sales over the next year or longer.
Q1 GDP Forecasts: Around 2%
by Calculated Risk on 4/12/2019 11:43:00 AM
From Merrill Lynch:
We continue to track 1.9% for 1Q GDP growth. [April 12 estimate]From the NY Fed Nowcasting Report
emphasis added
The New York Fed Staff Nowcast stands at 1.4% for 2019:Q1 and 2.0% for 2019:Q2. [Apr 12 estimate].And from the Altanta Fed: GDPNow
The GDPNow model estimate for real GDP growth (seasonally adjusted annual rate) in the first quarter of 2019 is 2.3 percent on April 8, up from 2.1 percent on April 2. [Apr 8 estimate]CR Note: These estimates suggest real GDP growth will be around 2% annualized in Q1.


