by Calculated Risk on 2/19/2019 07:50:00 PM
Tuesday, February 19, 2019
Wednesday: FOMC Minutes
From Matthew Graham at Mortgage News Daily: Mortgage Rates Sticking Close to Long-Term Lows
Mortgage rates fell modestly today, making it the 7th straight business day where they've moved in the opposite direction from the previous day. [30YR FIXED 4.375 - 4.5%]Wednesday:
emphasis added
• At 7:00 AM ET, The Mortgage Bankers Association (MBA) will release the results for the mortgage purchase applications index.
• During the day, The AIA's Architecture Billings Index for January (a leading indicator for commercial real estate).
• At 2:00 PM, FOMC Minutes, Meeting of January 29-30, 2019
Sacramento Housing in January: Sales Down 21% YoY, Active Inventory up 25% YoY
by Calculated Risk on 2/19/2019 06:06:00 PM
From SacRealtor.org: January 2019 Statistics – Sacramento Housing Market – Single Family Homes
The month closed with 894 total sales, a 19% decrease from the 1,104 sales of December. Compared to the same month last year (1,129), the current figure is down 20.8%. This month marks the lowest amount of sales for a January in over 10 years. January 2008 saw only 739 sales.CR Note: Inventory is still low - months of inventory is at 2.3 months, probably closer to 4 months would be normal - however inventory is up significantly year-over-year in Sacramento (but not as large a YoY increase as in December).
...
The Active Listing Inventory decreased, falling 2.5% from 2,149 to 2,095 units. The Months of Inventory increased 21.1% from 1.9 to 2.3 Months. [Note: Compared to January 2018, inventory is up 24.9%] .
...
The Average DOM (days on market) increased again, rising from 38 to 40. The Median DOM also increased, rising from 25 to 27. “Days on market” represents the days between the initial listing of the home as “active” and the day it goes “pending.”
emphasis added
Lawler: Early Read on Existing Home Sales in January
by Calculated Risk on 2/19/2019 03:15:00 PM
From housing economist Tom Lawler: Early Read on Existing Home Sales in January
Based on publicly-available local realtor/MLS reports released across the country through today, I project that existing home sales as estimated by the National Association of Realtors ran at a seasonally adjusted annual rate of 4.92 million in January, down 1.0% from December’s preliminary pace and down 8.6% from last January’s seasonally adjusted pace.
On the inventory front, local realtor/MLS data, as well as data from other inventory trackers, suggest that the inventory of existing homes for sale at the end of January was up 6.6% from last January.
Finally, local realtor/MLS data suggest that the median US existing single-family home sales price last month was up by about 3.0% from last January.
Note: In the upcoming release the NAR will incorporate updated seasonal adjustment factors (as it does every year), which will alter monthly seasonally adjusted sales for the past few years.
CR Note: Existing home sales for January are scheduled to be released on Thursday, Feb 21st. The consensus is for sales of 5.05 million SAAR.
Las Vegas: Convention Attendance and Visitor Traffic Declined Slightly in 2018
by Calculated Risk on 2/19/2019 11:31:00 AM
During the recession, I wrote about the troubles in Las Vegas and included a chart of visitor and convention attendance: Lost Vegas.
Since then Las Vegas visitor traffic recovered to new record highs.
However, in 2018, visitor traffic declined 0.2% compared to 2017, but was still 7.5% above the pre-recession peak.
Convention attendance declined 2.2% in 2018 from the record high in 2017. Here is the data from the Las Vegas Convention and Visitors Authority.

The blue bars are annual visitor traffic (left scale), and the red line is convention attendance (right scale).
Historically, declines in Las Vegas visitor traffic have been associated with economic weakness, so the declines in 2017 and 2018 are a little concerning for the Vegas area.
NAHB: Builder Confidence Increases in February
by Calculated Risk on 2/19/2019 10:06:00 AM
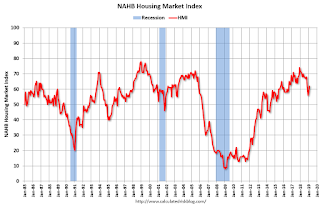
The National Association of Home Builders (NAHB) reported the housing market index (HMI) was at 62 in February, up from 58 in January. Any number above 50 indicates that more builders view sales conditions as good than poor.
From NAHB: Lower Interest Rates, Rising Consumer Confidence Boost Builder Sentiment
Builder confidence in the market for newly-built single-family homes rose four points to 62 in February, according to the latest National Association of Home Builders/Wells Fargo Housing Market Index (HMI) released today in Las Vegas during the 75th annual International Builders’ Show.
“Ongoing reduction in mortgage rates in recent weeks coupled with continued strength in the job market are helping to fuel builder sentiment,” said NAHB Chairman Randy Noel, a custom home builder from LaPlace, La. “In the aftermath of the fall slowdown, many builders are reporting positive expectations for the spring selling season.”
February marked the second consecutive month in which all the HMI indices posted gains. The index measuring current sales conditions rose three points to 67, the component gauging expectations in the next six months increased five points to 68 and the metric charting buyer traffic moved up four points to 48.
“Builder confidence levels moved up in tandem with growing consumer confidence and falling interest rates,” said NAHB Chief Economist Robert Dietz. “The five-point jump on the six-month sales expectation for the HMI is due to mortgage interest rates dropping from about 5 percent in November to 4.4 percent this week. However, affordability remains a critical issue. Rising costs stemming from excessive regulations, a dearth of buildable lots, a persistent labor shortage and tariffs on lumber and other key building materials continue to make it increasingly difficult to produce housing at affordable price points.”
…
Looking at the three-month moving averages for regional HMI scores, the South posted a one-point gain to 63 while the Northeast dropped two points to 43. The Midwest and West each remained unchanged at 52 and 67, respectively.
emphasis added
 Click on graph for larger image.
This graph show the NAHB index since Jan 1985.
This was above the consensus forecast.
Monday, February 18, 2019
Tuesday: NAHB homebuilder survey
by Calculated Risk on 2/18/2019 09:57:00 PM
Weekend:
• Schedule for Week of February 17, 2019
Tuesday:
• 10:00 AM, The February NAHB homebuilder survey. The consensus is for a reading of 59, up from 58. Any number above 50 indicates that more builders view sales conditions as good than poor.
From CNBC: Pre-Market Data and Bloomberg futures: S&P 500 and DOW futures are mostly unchanged (fair value).
Oil prices were up over the last week with WTI futures at $55.72 per barrel and Brent at $66.06 per barrel. A year ago, WTI was at $62, and Brent was at $65 - so WTI oil prices are down year-over-year, although Brent is essentially unchanged.
Here is a graph from Gasbuddy.com for nationwide gasoline prices. Nationally prices are at $2.33 per gallon. A year ago prices were at $2.52 per gallon, so gasoline prices are down 19 cents per gallon year-over-year.
The Housing Bubble, Mortgage Debt as Percent of GDP
by Calculated Risk on 2/18/2019 09:50:00 AM
Two years ago, on Presidents' Day, I excerpted from a post I wrote in February 2005 (yes, 14 years ago).
In that 2005 post, I included a graph of household mortgage debt as a percent of GDP. Several readers asked if I could update the graph.
First, from 2005:
The following chart shows household mortgage debt as a % of GDP. Although mortgage debt has been increasing for years, the last four years have seen a tremendous increase in debt. Last year alone mortgage debt increased close to $800 Billion - almost 7% of GDP. ...CR Note: And a serious problem is what happened!
Many homeowners have refinanced their homes, in essence using their homes as an ATM.
It wouldn't take a RE bust to impact the general economy. Just a slowdown in both volume (to impact employment) and in prices (to slow down borrowing) might push the general economy into recession. An actual bust, especially with all of the extensive sub-prime lending, might cause a serious problem.
 The second graph shows household mortgage debt as a percent of GDP through Q3 2018. Hopefully the graphs have improved!
The "bubble" is pretty obvious on this graph, and the sharp increase in mortgage debt was one of the warning signs.
Sunday, February 17, 2019
Oil: Rig Counts Rose Again
by Calculated Risk on 2/17/2019 11:10:00 PM
A few comments from Steven Kopits of Princeton Energy Advisors LLC on February 17, 2019:
• Oil rig counts rose again, +3 to 857. This is not what oil prices would have suggested.
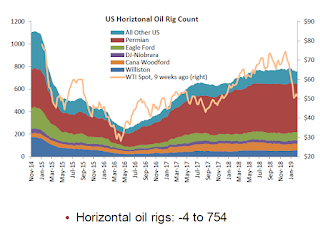
• Horizontal oil rig counts fell modestly, -4 to 754
• After last week’s loss of 3 horizontal oil rigs, the Permian lost an additional 5 this week
• Breakeven to add rigs fell to $54 WTI compared to $55.50 WTI on the screen as of the writing of this report. This is the first time breakeven has been below the posted oil price in months.
 Click on graph for larger image.
CR note: This graph shows the US horizontal rig count by basin.
Graph and comments Courtesy of Steven Kopits of Princeton Energy Advisors LLC.
Hotels: Occupancy Rate Increased Slightly Year-over-year
by Calculated Risk on 2/17/2019 11:24:00 AM
From HotelNewsNow.com: STR: US hotel results for week ending 9 February
The U.S. hotel industry reported positive year-over-year results in the three key performance metrics during the week of 3-9 February 2019, according to data from STR.The following graph shows the seasonal pattern for the hotel occupancy rate using the four week average.
In comparison with the week of 4-10 February 2018, the industry recorded the following:
• Occupancy: +0.2% to 59.9%
• Average daily rate (ADR): +1.5% to US$126.68
• Revenue per available room (RevPAR): +1.7% to US$75.84
emphasis added
 Click on graph for larger image.
The red line is for 2019, dash light blue is 2018, blue is the median, and black is for 2009 (the worst year probably since the Great Depression for hotels).
A decent start for 2019.
Seasonally, the occupancy rate will increase over the next couple of months.
Data Source: STR, Courtesy of HotelNewsNow.com
Saturday, February 16, 2019
Schedule for Week of February 17, 2019
by Calculated Risk on 2/16/2019 08:11:00 AM
The key report this week is January existing home sales.
For manufacturing, the February Philly Fed manufacturing survey will be released.
All US markets will be closed in observance of Washington's Birthday Holiday.
10:00 AM: The February NAHB homebuilder survey. The consensus is for a reading of 59, up from 58. Any number above 50 indicates that more builders view sales conditions as good than poor.
7:00 AM ET: The Mortgage Bankers Association (MBA) will release the results for the mortgage purchase applications index.
During the day: The AIA's Architecture Billings Index for January (a leading indicator for commercial real estate).
2:00 PM: FOMC Minutes, Meeting of January 29-30, 2019
8:30 AM: The initial weekly unemployment claims report will be released. The consensus is for 230 thousand initial claims, down from 239 thousand the previous week.
8:30 AM: Durable Goods Orders for January from the Census Bureau. The consensus is for a 1.7% increase in durable goods orders.
8:30 AM: the Philly Fed manufacturing survey for February. The consensus is for a reading of 14.5, down from 17.0.
 10:00 AM: Existing Home Sales for January from the National Association of Realtors (NAR). The consensus is for 5.00 million SAAR, up from 4.99 million.
The graph shows existing home sales from 1994 through the report last month.
No major economic releases scheduled.


