by Calculated Risk on 2/06/2019 07:00:00 AM
Wednesday, February 06, 2019
MBA: Mortgage Applications Decrease in Latest Weekly Survey
From the MBA: Mortgage Applications Decrease in Latest MBA Weekly Survey
Mortgage applications decreased 2.5 percent from one week earlier, according to data from the Mortgage Bankers Association’s (MBA) Weekly Mortgage Applications Survey for the week ending February 1, 2019. The previous week’s results included an adjustment for the Martin Luther King Jr. Day holiday.
... The Refinance Index increased 0.3 from the previous week. The seasonally adjusted Purchase Index decreased 5 percent from one week earlier. The unadjusted Purchase Index increased 13 percent compared with the previous week and was 2 percent lower than the same week one year ago.
...
“Mortgage rates for all loan types declined last week, with the 30-year fixed mortgage rate falling seven basis points to 4.69 percent – the lowest rate since April 2018,” said Joel Kan, Associate Vice President of Industry Surveys and Forecasts. “Despite more favorable borrowing costs, and after a three-week surge in activity, purchase applications have slowed over the past two weeks, and are now almost 2 percent lower than a year ago. However, moderating price gains and the strong job market, including evidence of faster wage growth, should help purchase growth going forward.”
Added Kan, “Refinance applications saw a very slight increase compared to the previous week, despite the broad decline in rates.”
...
The average contract interest rate for 30-year fixed-rate mortgages with conforming loan balances ($484,350 or less) decreased to 4.69 percent from 4.76 percent, with points decreasing to 0.45 from 0.47 (including the origination fee) for 80 percent loan-to-value ratio (LTV) loans.
emphasis added
 Click on graph for larger image.
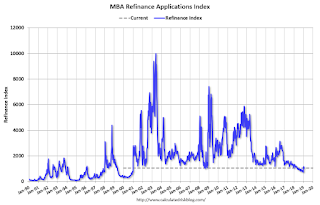
The first graph shows the refinance index since 1990.
Rates would have to fall further for a significant increase in refinance activity.
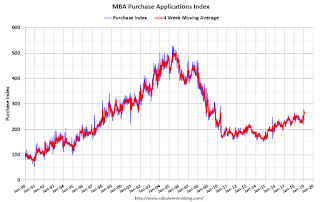 The second graph shows the MBA mortgage purchase index
According to the MBA, purchase activity is down 2% year-over-year.
Tuesday, February 05, 2019
Wednesday: Trade Deficit
by Calculated Risk on 2/05/2019 06:44:00 PM
Wednesday:
• At 7:00 AM ET: The Mortgage Bankers Association (MBA) will release the results for the mortgage purchase applications index.
• At 8:30 AM: Trade Balance report for November from the Census Bureau. The consensus is the trade deficit to be $53.9 billion. The U.S. trade deficit was at $55.5 billion in October.
• At 7:00 PM: Fed Chair Jerome Powell, Brief Opening Remarks, At the Conversation with the Chairman: A Teacher Town Hall Meeting, Washington, D.C.
BEA: January Vehicles Sales at 16.6 Million SAAR, 2018 Annual Sales slightly higher than 2017
by Calculated Risk on 2/05/2019 04:05:00 PM
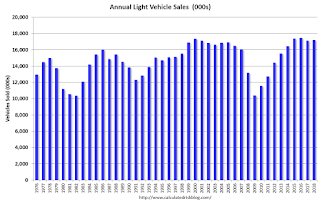
The BEA released their estimate of January vehicle sales. The BEA estimated sales of 16.60 million SAAR in January 2019 (Seasonally Adjusted Annual Rate), down 5.1% from the December sales rate, and down 3.0% from January 2018.
Total annual sales were 17.21 million in 2018, up slightly from 17.14 million in 2017.
So 2018 was the fourth best year on record after 2016, 2015, and 2000.
Click on graph for larger image.
This graph shows annual light vehicle sales since 1976. Source: BEA.
Sales for 2018 were the fourth best ever.
The second graph shows light vehicle sales since the BEA started keeping data in 1967.

This was a weak start to 2019, but a small decline in sales this year isn't a concern - I think sales will move mostly sideways at near record levels.
This means the economic boost from increasing auto sales is over (from the bottom in 2009, auto sales boosted growth every year through 2016).
Update: The Endless Parade of Recession Calls
by Calculated Risk on 2/05/2019 01:11:00 PM
It was over three years ago that I wrote: The Endless Parade of Recession Calls. In that post, I pointed out that I wasn't "even on recession watch". Here is a repeat of that post with a few updates in italics.
Note: I've made one recession call since starting this blog. One of my predictions for 2007 was a recession would start as a result of the housing bust (made it by one month - the recession started in December 2007). That prediction was out of the consensus for 2007 and, at the time, ECRI was saying a "recession is no longer a serious concern". Ouch.
For the last 6+ years [now 9+ years], there have been an endless parade of incorrect recession calls. The most reported was probably the multiple recession calls from ECRI in 2011 and 2012.
In May of [2015], ECRI finally acknowledged their incorrect call, and here is their admission : The Greater Moderation
In line with the old adage, “never say never,” [ECRI's] September 2011 U.S. recession forecast did turn out to be a false alarm.I disagreed with that call in 2011; I wasn't even on recession watch!
And here is another call [from December 2015] via CNBC: US economy recession odds '65 percent': Investor
Raoul Pal, the publisher of The Global Macro Investor, reiterated his bearishness ... "The economic situation is deteriorating fast." ... [The ISM report] "is showing that the U.S. economy is almost at stall speed now," Pal said. "It gives us a 65 percent chance of a recession in the U.S.Clearly that forecast was incorrect. And there were many more at the end of 2018.
More recently Looking at the economic data, the odds of a recession in 2016 [written in late 2015] are very low (extremely unlikely in my view). [My view now: a recession in 2019 is very unlikely]. Someday I'll make another recession call, but I'm not even on recession watch now.
[I'm still not on recession watch!]
ISM Non-Manufacturing Index decreased to 56.7% in January
by Calculated Risk on 2/05/2019 10:05:00 AM
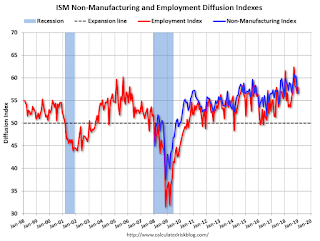
The January ISM Non-manufacturing index was at 56.7%, down from 58.0% in December. The employment index increased in January to 57.8%, from 56.6%. Note: Above 50 indicates expansion, below 50 contraction.
From the Institute for Supply Management: January 2019 Non-Manufacturing ISM Report On Business®
Economic activity in the non-manufacturing sector grew in January for the 108th consecutive month, say the nation’s purchasing and supply executives in the latest Non-Manufacturing ISM® Report On Business®.
The report was issued today by Anthony Nieves, CPSM, C.P.M., A.P.P., CFPM, Chair of the Institute for Supply Management® (ISM®) Non-Manufacturing Business Survey Committee: “The NMI® registered 56.7 percent, which is 1.3 percentage points lower than the December reading of 58 percent. This represents continued growth in the non-manufacturing sector, at a slower rate. The Non-Manufacturing Business Activity Index decreased to 59.7 percent, 1.5 percentage points lower than the December reading of 61.2 percent, reflecting growth for the 114th consecutive month, at a slower rate in January. The New Orders Index registered 57.7 percent, 5 percentage points lower than the reading of 62.7 percent in December. The Employment Index increased 1.2 percentage points in January to 57.8 percent from the December reading of 56.6 percent. The Prices Index increased 1.4 percentage points from the December reading of 58 percent to 59.4 percent, indicating that prices increased in January for the 20th consecutive month. According to the NMI®, 11 non-manufacturing industries reported growth. The non-manufacturing sector’s growth rate cooled off in January. Respondents are concerned about the impacts of the government shutdown but remain mostly optimistic about overall business conditions.”
emphasis added
 Click on graph for larger image.
This graph shows the ISM non-manufacturing index (started in January 2008) and the ISM non-manufacturing employment diffusion index.
This suggests slower expansion in January than in December.
CoreLogic: House Prices up 4.7% Year-over-year in December
by Calculated Risk on 2/05/2019 08:58:00 AM
Notes: This CoreLogic House Price Index report is for December. The recent Case-Shiller index release was for November. The CoreLogic HPI is a three month weighted average and is not seasonally adjusted (NSA).
From CoreLogic: CoreLogic Reports December Home Prices Increased by 4.7 Percent Year Over Year
CoreLogic® ... today released the CoreLogic Home Price Index (HPI™) and HPI Forecast™ for December 2018, which shows home prices rose both year over year and month over month. Home prices increased nationally by 4.7 percent year over year from December 2017. On a month-over-month basis, prices increased by 0.1 percent in December 2018. (November 2018 data was revised. Revisions with public records data are standard, and to ensure accuracy, CoreLogic incorporates the newly released public data to provide updated results each month.)
Looking ahead, the CoreLogic HPI Forecast indicates home prices will increase by 4.6 percent on a year-over-year basis from December 2018 to December 2019. Comparing the annual average HPI and HPI forecast for 2018 and 2019, average price growth is forecasted to slow from 5.8 percent to 3.4 percent. On a month-over-month basis, home prices are expected to decrease by 1 percent from December 2018 to January 2019. The CoreLogic HPI Forecast is a projection of home prices calculated using the CoreLogic HPI and other economic variables. Values are derived from state-level forecasts by weighting indices according to the number of owner-occupied households for each state.
“Higher mortgage rates slowed home sales and price growth during the second half of 2018,” said Dr. Frank Nothaft, chief economist for CoreLogic. “Annual price growth peaked in March and averaged 6.4 percent during the first six months of the year. In the second half of 2018, growth moderated to 5.2 percent. For 2019, we are forecasting an average annual price growth of 3.4 percent.”
emphasis added
 CR Note: The CoreLogic YoY increase had been in the 5% to 7% range for the last few years. This is the slowest twelve-month home-price growth rate since August 2012.
The year-over-year comparison has been positive for almost seven consecutive years since turning positive year-over-year in February 2012.
Monday, February 04, 2019
Tuesday: ISM non-Mfg Index
by Calculated Risk on 2/04/2019 05:59:00 PM
From Matthew Graham at Mortgage News Daily: Mortgage Rates Quickly Retreating After Hitting Long-Term Lows
Mortgage rates continued moving higher today as Fridays unfortunate series of events seems to have motivated a big bounce. What events are those? Namely, we're talking about several important economic reports including the big jobs report and the most closely-watched manufacturing report from ISM. These were joined by two other supporting actors (Consumer Sentiment and Factory Orders) to round out an entire morning of data that came in much stronger than expected.Tuesday:
...
The good news is that US Treasury yields have been suffering more than mortgages. Apart from the last 3 business days, rates are still in line with their lowest levels in months. [30YR FIXED - 4.5%]
emphasis added
• At 8:00 AM ET: CoreLogic House Price Index for December.
• At 10:00 AM: the ISM non-Manufacturing Index for January.
Public and Private Sector Payroll Jobs During Presidential Terms
by Calculated Risk on 2/04/2019 02:41:00 PM
By request, here is another update of tracking employment during Presidential terms. We frequently use Presidential terms as time markers - we could use Speaker of the House, Fed Chair, or any other marker.
NOTE: Several readers have asked if I could add a lag to these graphs (obviously a new President has zero impact on employment for the month they are elected). But that would open a debate on the proper length of the lag, so I'll just stick to the beginning of each term.
Important: There are many differences between these periods. Overall employment was smaller in the '80s, however the participation rate was increasing in the '80s (younger population and women joining the labor force), and the participation rate is generally declining now. But these graphs give an overview of employment changes.
The first graph shows the change in private sector payroll jobs from when each president took office until the end of their term(s). Presidents Carter and George H.W. Bush only served one term.
Mr. G.W. Bush (red) took office following the bursting of the stock market bubble, and left during the bursting of the housing bubble. Mr. Obama (dark blue) took office during the financial crisis and great recession. There was also a significant recession in the early '80s right after Mr. Reagan (dark red) took office.
There was a recession towards the end of President G.H.W. Bush (light purple) term, and Mr Clinton (light blue) served for eight years without a recession.

The first graph is for private employment only.
Mr. Trump is in Orange (24 months).
The employment recovery during Mr. G.W. Bush's (red) first term was sluggish, and private employment was down 821,000 jobs at the end of his first term. At the end of Mr. Bush's second term, private employment was collapsing, and there were net 382,000 private sector jobs lost during Mr. Bush's two terms.
Private sector employment increased by 20,979,000 under President Clinton (light blue), by 14,714,000 under President Reagan (dark red), 9,039,000 under President Carter (dashed green), 1,511,000 under President G.H.W. Bush (light purple), and 11,890,000 under President Obama (dark blue).
During the first 24 months of Mr. Trump's term, the economy has added 4,683,000 private sector jobs.

The public sector grew during Mr. Carter's term (up 1,304,000), during Mr. Reagan's terms (up 1,414,000), during Mr. G.H.W. Bush's term (up 1,127,000), during Mr. Clinton's terms (up 1,934,000), and during Mr. G.W. Bush's terms (up 1,744,000 jobs). However the public sector declined significantly while Mr. Obama was in office (down 269,000 jobs).
During the first 24 months of Mr. Trump's term, the economy has added 196,000 public sector jobs.
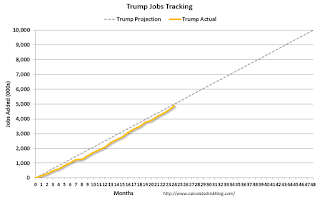
After 24 months of Mr. Trump's presidency, the economy has added 4,879,000 jobs, about 121,000 behind the projection.
Update: Framing Lumber Prices Down Year-over-year
by Calculated Risk on 2/04/2019 11:01:00 AM
Here is another monthly update on framing lumber prices. Lumber prices declined from the record highs in early 2018, and are now down about 25% year-over-year.
This graph shows two measures of lumber prices: 1) Framing Lumber from Random Lengths through January 18, 2019 (via NAHB), and 2) CME framing futures.

Right now Random Lengths prices are down 28% from a year ago, and CME futures are down 25% year-over-year.
There is a seasonal pattern for lumber prices, and usually prices will increase in the Spring, and peak around May, and then bottom around October or November - although there is quite a bit of seasonal variability.
Black Knight Mortgage Monitor for December
by Calculated Risk on 2/04/2019 08:00:00 AM
Black Knight released their Mortgage Monitor report for December today. According to Black Knight, 3.88% of mortgages were delinquent in December, down from 4.71% in December 2017. Black Knight also reported that 0.52% of mortgages were in the foreclosure process, down from 0.65% a year ago.
This gives a total of 4.40% delinquent or in foreclosure.
Press Release: BBlack Knight: Active Foreclosure Rate and Inventory End 2018 Below Pre-Recession Averages; Total Year Foreclosure Starts and Sales Hit More Than 18-Year Lows
Today, the Data & Analytics division of Black Knight, Inc. released its latest Mortgage Monitor Report, based upon its industry-leading loan-level mortgage performance database. With full-year mortgage performance data in, this month’s report looked at 2018 in review. As explained by Ben Graboske, president of Black Knight’s Data & Analytics division, more than a decade past the start of the financial crisis, most metrics reflect a recovery to their long-term, 2000-2005 pre-recession averages.
“Across the board, 2018 year-end numbers are good news from a mortgage performance perspective,” said Graboske. “All four major performance metrics – delinquencies, serious delinquencies, active foreclosures and total non-current inventory – ended the year below pre-recession averages for the first time since the financial crisis. Just 576,000 foreclosures were initiated throughout the entirety of 2018 – an 18-year low – and the vast majority of these were repeat actions. In fact, first-time foreclosures were down 18 percent from the year before, hitting the lowest point we’ve seen since Black Knight started reporting the metric in 2000. Even repeats – though making up more than 60 percent of all foreclosures – were down 6 percent from 2017.
“These year-end numbers are further proof of what we’ve been observing for some time now. The high credit quality and corresponding lower risk we’ve seen in the post-crisis origination market for the better part of a decade continues to pay dividends in terms of mortgage performance. In addition, the low interest rate environment we’ve enjoyed for so long had – until very recently – resulted in a refinance-heavy blend of originations for years. Refis, as a whole, tend to outperform their purchase mortgage counterparts, which has boosted mortgage performance as well. On top of that, we’ve had the benefit of strong employment and housing markets, which have helped the vast majority of homeowners meet their debt obligations, while those few who may have faced a possible default have gained enough equity to be able to sell rather than face foreclosure.”
emphasis added
 Click on graph for larger image.
Here is a graph from the Mortgage Monitor that shows the year end delinquency rate over time.
From Black Knight:
• While we’ve documented the potential impact of rising interest rates, and talk of a looming recession persists in the market, mortgage performance continues to strengthenThe second graph shows active foreclosure inventory over time.
• The national delinquency rate is down 18% from last year, though that figure is overstated due to hurricane-related effects over the past 18 months
• Still, even excluding hurricane-impacted areas, December's delinquency rate was down an impressive 11% from last year
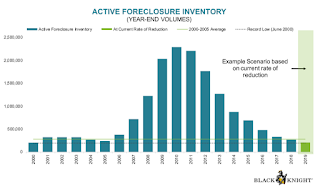
• Both the national foreclosure rate and the number of loans in active foreclosure have now fallen below long-term normsThere is much more in the mortgage monitor.
• In fact, the national foreclosure rate closed out 2018 below its pre-crisis average for the first time since 2005
• While the rate of improvement has slowed slightly in recent months, at the current rate of decline, both metrics would be near record lows by the end of 2019

