by Calculated Risk on 1/31/2019 02:50:00 PM
Thursday, January 31, 2019
January Employment Preview
On Friday at 8:30 AM ET, the BLS will release the employment report for January. The consensus is for an increase of 158,000 non-farm payroll jobs in January (with a range of estimates between 140,000 to 183,000), and for the unemployment rate to be unchanged at 3.9%.
Last month, the BLS reported 312,000 jobs added in December.
Note on the government shutdown: the Federal jobs will all be counted in the establishment report (headline jobs number), since the employees will be receiving back pay. However, the furloughed employees will be counted as unemployed (on temporary layoff), so the unemployment rate will probably increase.
Note on Revisions: With the January release, the BLS will introduce revisions to nonfarm payroll employment to reflect the annual benchmark adjustment. The preliminary annual benchmark revision showed an upward adjustment of 43,000 jobs, and the preliminary estimate is usually pretty close.
Here is a summary of recent data:
• The ADP employment report showed an increase of 213,000 private sector payroll jobs in December. This was well above consensus expectations of 167,000 private sector payroll jobs added. The ADP report hasn't been very useful in predicting the BLS report for any one month, but in general, this suggests employment growth above expectations.
• The ISM manufacturing and ISM non-manufacturing employment indexes have not yet been released..
• Initial weekly unemployment claims averaged 220,000 in January, up slightly from 219,000 in December. For the BLS reference week (includes the 12th of the month), initial claims were at 212,000, down from 217,000 during the reference week the previous month.
In general, the unemployment claims suggest a solid employment report.
• The final January University of Michigan consumer sentiment index decreased to 90.7 from the December reading of 98.3. Sentiment is frequently coincident with changes in the labor market, but there are other factors too like gasoline prices and politics. The decline in January is probably related to the government shutdown.
• Looking back at the three previous years:
In January 2017, the consensus was for 175,000 jobs, ADP reported 234,000 private sector jobs added, and the BLS reported 200,000 jobs added.
In January 2016, the consensus was for 175,000 jobs, ADP reported 246,000 private sector jobs added, and the BLS reported 227,000 jobs added.
In January 2015, the consensus was for 188,000 jobs, ADP reported 205,000 private sector jobs added, and the BLS reported 151,000 jobs added.
It appears the ADP report is usually too high for January.
• Conclusion: In general these reports suggest a solid employment report, although I expect the unemployment rate to increase due to the government shutdown. My guess is the report will be at or below the consensus, due to good weather in December (some payback in January), and possibly some private sector impact from the government shutdown.
A few Comments on November New Home Sales
by Calculated Risk on 1/31/2019 11:45:00 AM
First, this report was for November (it was almost ready to release when the government shutdown began in December). The December report will probably be released soon, but no release date has been announced yet. Based on other data, I'd expect sales to be weak in December, but talking to builders, I expect a rebound in January.
New home sales for November were reported at 657,000 on a seasonally adjusted annual rate basis (SAAR). This was well above the consensus forecast, and the three previous months were revised up.
Sales in November were down 7.2% year-over-year compared to November 2017.
On Inventory: Months of inventory is now at the top of the normal range, however the number of units completed and under construction is still somewhat low. Inventory will be something to watch very closely.
Earlier: New Home Sales increased to 657,000 Annual Rate in November.

This graph shows new home sales for 2017 and 2018 by month (Seasonally Adjusted Annual Rate).
Sales are only up 2.7% through November compared to the same period in 2017.
The comparison for November was difficult (sales in November 2017 were very strong). And the comparison in December will also be somewhat difficult. Overall sales might finish the year down from 2017, but it should be close.
This is below my forecast for 2018 for an increase of about 6% over 2017. As I noted early this year, there were downside risks to that forecast, primarily higher mortgage rates, but also higher costs (labor and material), the impact of the new tax law, and other possible policy errors.
And here is another update to the "distressing gap" graph that I first started posting a number of years ago to show the emerging gap caused by distressed sales. Now I'm looking for the gap to close over the next several years.

Following the housing bubble and bust, the "distressing gap" appeared mostly because of distressed sales. The gap has persisted even though distressed sales are down significantly, since new home builders focused on more expensive homes.
I still expect this gap to slowly close. However, this assumes that the builders will offer some smaller, less expensive homes. If not, then the gap will persist.
Note: Existing home sales are counted when transactions are closed, and new home sales are counted when contracts are signed. So the timing of sales is different.
New Home Sales increased to 657,000 Annual Rate in November
by Calculated Risk on 1/31/2019 10:14:00 AM
Note: This release is for November (this was delayed due to the government shutdown). The December report is not yet rescheduled, but will probably be released soon.
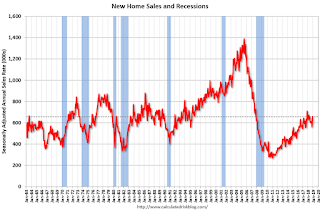
The Census Bureau reports New Home Sales in November were at a seasonally adjusted annual rate (SAAR) of 657 thousand.
The previous three months were revised up significantly.
"Sales of new single‐family houses in November 2018 were at a seasonally adjusted annual rate of 657,000, according to estimates released jointly today by the U.S. Census Bureau and the Department of Housing and Urban Development. This is 16.9 percent above the revised October rate of 562,000, but is 7.7 percent below the November 2017 estimate of 712,000."
emphasis added
 Click on graph for larger image.
The first graph shows New Home Sales vs. recessions since 1963. The dashed line is the current sales rate.
Even with the increase in sales over the last several years, new home sales are still somewhat low historically.
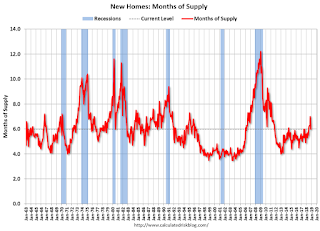
The second graph shows New Home Months of Supply.
 The months of supply decreased in November to 6.0 months from 7.0 months in October.
 The all time record was 12.1 months of supply in January 2009.
This is above the normal range (less than 6 months supply is normal).
"The seasonally‐adjusted estimate of new houses for sale at the end of November was 330,000. This represents a supply of 6.0 months at the current sales rate."
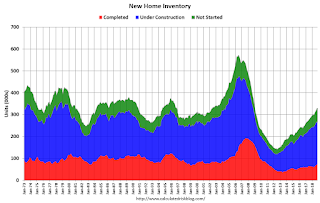
 On inventory, according to the Census Bureau:
 "A house is considered for sale when a permit to build has been issued in permit-issuing places or work has begun on the footings or foundation in nonpermit areas and a sales contract has not been signed nor a deposit accepted."Starting in 1973 the Census Bureau broke this down into three categories: Not Started, Under Construction, and Completed.
The third graph shows the three categories of inventory starting in 1973.
The inventory of completed homes for sale is still somewhat low, and the combined total of completed and under construction is a little low.
 The last graph shows sales NSA (monthly sales, not seasonally adjusted annual rate).
In November 2018 (red column), 48 thousand new homes were sold (NSA). Last year, 50 thousand homes were sold in November.
The all time high for November was 86 thousand in 2005, and the all time low for November was 20 thousand in 2010.
This was well above expectations of 560,000 sales SAAR, and the previous months were revised up. I'll have more later today.
Weekly Initial Unemployment Claims increased to 253,000
by Calculated Risk on 1/31/2019 08:34:00 AM
The DOL reported:
In the week ending January 26, the advance figure for seasonally adjusted initial claims was 253,000, an increase of 53,000 from the previous week's revised level. This is the highest level for initial claims since September 30, 2017 when it was 254,000. The previous week's level was revised up by 1,000 from 199,000 to 200,000. The 4-week moving average was 220,250, an increase of 5,000 from the previous week's revised average. The previous week's average was revised up by 250 from 215,000 to 215,250.The previous week was revised up.
emphasis added
The following graph shows the 4-week moving average of weekly claims since 1971.
 Click on graph for larger image.
The dashed line on the graph is the current 4-week average. The four-week average of weekly unemployment claims increased to 220,250.
This was much higher than the consensus forecast - and is probably related to the government shutdown.
Wednesday, January 30, 2019
Thursday: New Home Sales (Yes!), Unemployment Claims, Chicago PMI
by Calculated Risk on 1/30/2019 08:54:00 PM
The BEA and Census have set some dates for delayed economic releases. For example, New Home sales for November will be released Thursday (the December release is not scheduled yet). There is no release date yet for Q4 GDP or December Personal Income and Outlays.
Thursday:
• At 8:30 AM ET, The initial weekly unemployment claims report will be released. The consensus is for 217 thousand initial claims, up from 213 thousand the previous week.
• Also at 8:30 AM, POSTPONED Personal Income and Outlays for December. The consensus is for a 0.4% increase in personal income, and for a 0.3% increase in personal spending. And for the Core PCE price index to increase 0.2%.
• At 9:45 AM, Chicago Purchasing Managers Index for January. The consensus is for a reading of 62.5, down from 65.4 in December.
• At 10:00 AM, New Home Sales for November from the Census Bureau. The consensus was for 560 thousand SAAR, up from 544 thousand in October.
Freddie Mac: Mortgage Serious Delinquency Rate Decreased in December, Lowest since 2007
by Calculated Risk on 1/30/2019 03:42:00 PM
Freddie Mac reported that the Single-Family serious delinquency rate in December was 0.69%, down from 0.70% in November. Freddie's rate is down from 1.08% in December 2017.
Freddie's serious delinquency rate peaked in February 2010 at 4.20%.
This is the lowest serious delinquency rate for Freddie Mac since December 2007.
These are mortgage loans that are "three monthly payments or more past due or in foreclosure".

The increase in the delinquency rate late last year was due to the hurricanes (These are serious delinquencies, so it took three months late to be counted).
I expect the delinquency rate to decline to a cycle bottom in the 0.5% to 0.7% range - but this is close to a bottom.
Note: Fannie Mae will report for December soon.
FOMC Statement: No Change to Policy
by Calculated Risk on 1/30/2019 02:01:00 PM
Powell press conference video here.
FOMC Statement:
Information received since the Federal Open Market Committee met in December indicates that the labor market has continued to strengthen and that economic activity has been rising at a solid rate. Job gains have been strong, on average, in recent months, and the unemployment rate has remained low. Household spending has continued to grow strongly, while growth of business fixed investment has moderated from its rapid pace earlier last year. On a 12-month basis, both overall inflation and inflation for items other than food and energy remain near 2 percent. Although market-based measures of inflation compensation have moved lower in recent months, survey-based measures of longer-term inflation expectations are little changed.
Consistent with its statutory mandate, the Committee seeks to foster maximum employment and price stability. In support of these goals, the Committee decided to maintain the target range for the federal funds rate at 2-1/4 to 2-1/2 percent. The Committee continues to view sustained expansion of economic activity, strong labor market conditions, and inflation near the Committee's symmetric 2 percent objective as the most likely outcomes. In light of global economic and financial developments and muted inflation pressures, the Committee will be patient as it determines what future adjustments to the target range for the federal funds rate may be appropriate to support these outcomes.
In determining the timing and size of future adjustments to the target range for the federal funds rate, the Committee will assess realized and expected economic conditions relative to its maximum employment objective and its symmetric 2 percent inflation objective. This assessment will take into account a wide range of information, including measures of labor market conditions, indicators of inflation pressures and inflation expectations, and readings on financial and international developments.
Voting for the FOMC monetary policy action were: Jerome H. Powell, Chairman; John C. Williams, Vice Chairman; Michelle W. Bowman; Lael Brainard; James Bullard; Richard H. Clarida; Charles L. Evans; Esther L. George; Randal K. Quarles; and Eric S. Rosengren.
emphasis added
Zillow Case-Shiller Forecast: Smaller House Price Gains in December YoY
by Calculated Risk on 1/30/2019 11:59:00 AM
The Case-Shiller house price indexes for November were released yesterday. Zillow forecasts Case-Shiller a month early, and I like to check the Zillow forecasts since they have been pretty close.
From Aaron Terrazas at Zillow: November Case-Shiller Results and December Forecast: San Francisco Falls Out of Top Three Home-Price Gainers
The U.S. National S&P CoreLogic Case-Shiller Home Price Index — which tracks home prices — rose 5.2 percent in November from a year earlier, below Zillow’s forecast last month.The Zillow forecast is for the year-over-year change for the Case-Shiller National index to be slightly less in December than in November.
The S&P CoreLogic Case-Shiller 20-city index climbed 4.7 percent annually in November, while the 10-city index rose 4.3 percent.
Zillow forecasts a steady 5.1 percent annual gain for December (results due Feb. 26).

NAR: Pending Home Sales Index Decreased 2.2% in December
by Calculated Risk on 1/30/2019 10:05:00 AM
From the NAR: Pending Home Sales Dip 2.2 Percent in December
Pending home sales declined as a whole in December, but for the second straight month the Western region experienced a slight increase, according to the National Association of Realtors®.This was well below expectations for this index. Note: Contract signings usually lead sales by about 45 to 60 days, so this would usually be for closed sales in January and February.
he Pending Home Sales Index, a forward-looking indicator based on contract signings, decreased 2.2 percent to 99.0 in December, down from 101.2 in November. Additionally, year-over-year contract signings fell 9.8 percent, making this the twelfth straight month of annual decreases.
...
The PHSI in the Northeast rose 2.0 percent to 93.2 in December, and is now 2.5 percent below a year ago. In the Midwest, the index fell 0.6 percent to 97.5 in December, 7.2 percent lower than December 2017.
Pending home sales in the South fell 5 percent to an index of 109.7 in December, which is 13.5 percent lower than a year ago. The index in the West increased 1.7 percent in December to 88.4 and fell 10.8 percent below a year ago.
emphasis added
ADP: Private Employment increased 213,000 in January
by Calculated Risk on 1/30/2019 08:47:00 AM
Private sector employment increased by 213,000 jobs from December to January according to the January according to the December ADP National Employment Report®. ... The report, which is derived from ADP’s actual payroll data, measures the change in total nonfarm private employment each month on a seasonally-adjusted basis.This was well above the consensus forecast for 167,000 private sector jobs added in the ADP report.
...
“The labor market has continued its pattern of strong growth with little sign of a slowdown in sight,“ said Ahu Yildirmaz, vice president and co-head of the ADP Research Institute. “We saw significant growth in nearly all industries, with manufacturing adding the most jobs in more than four years. Midsized businesses continue to lead job creation, however the share of jobs was spread a bit more evenly across all company sizes this month.”
Mark Zandi, chief economist of Moody’s Analytics, said, “The job market weathered the government shutdown well. Despite the severe disruptions, businesses continued to add aggressively to their payrolls. As long as businesses hire strongly the economic expansion will continue on.”
The BLS report for January will be released Friday, and the consensus is for 158,000 non-farm payroll jobs added in January.


