by Calculated Risk on 9/18/2018 08:46:00 AM
Tuesday, September 18, 2018
California: "Housing market falters for fourth straight month", Inventory up 17.2% YoY
The CAR reported: California’s housing market falters for fourth straight month as high home prices take toll on demand, C.A.R. reports
California’s housing market dropped below the 400,000-level sales benchmark for the first time in more than two years as high home prices and eroding affordability combined to cut into housing demand, the CALIFORNIA ASSOCIATION OF REALTORS® (C.A.R.) said today.Here is some data from the NAR and CAR (ht Tom Lawler)
Closed escrow sales of existing, single-family detached homes in California totaled a seasonally adjusted annualized rate of 399,600 units in August, according to information collected by C.A.R. from more than 90 local REALTOR® associations and MLSs statewide. The statewide annualized sales figure represents what would be the total number of homes sold during 2018 if sales maintained the August pace throughout the year. It is adjusted to account for seasonal factors that typically influence home sales.
August’s sales figure was down 1.8 percent from the revised 406,920 level in July and down 6.6 percent compared with home sales in August 2017 of 427,630.
“Home sales activity remained on a downward trend for the fourth straight month as uncertainty about the housing market continues to mount,” said C.A.R. President Steve White. “Buyers are being cautious and reluctant to make a commitment as they are concerned that home prices may have peaked and instead are waiting until there’s more clarity in the market.”
…
“While home prices continued to rise modestly in August, the deceleration in price growth and the surge in housing supply suggest that a market shift is underway,” said C.A.R. Senior Vice President and Chief Economist Leslie Appleton-Young. “We are seeing active listings increasing and more price reductions in the market, and as such, the question remains, ‘How long will it take for the market to close the price expectation gap between buyers and sellers?’”
...
Statewide active listings rose for the fifth consecutive month after 33 straight months of declines, increasing 17.2 percent from the previous year. August’s listings increase was the biggest in nearly four years.
emphasis added
| YOY % Change, Existing SF Homes for Sale | ||
|---|---|---|
| NAR (National) | CAR (California) | |
| Sep-17 | -8.4% | -11.2% |
| Oct-17 | -10.4% | -11.5% |
| Nov-17 | -9.7% | -11.5% |
| Dec-17 | -11.5% | -12.0% |
| Jan-18 | -9.5% | -6.6% |
| Feb-18 | -8.6% | -1.3% |
| Mar-18 | -7.2% | -1.0% |
| Apr-18 | -6.3% | 1.9% |
| May-18 | -5.1 | 8.3% |
| Jun-18 | -0.5% | 8.1% |
| Jul-18 | 0.0% | 11.9% |
| Aug-18 | --- | 17.2% |
Monday, September 17, 2018
Lawler: Spotlight Seattle: Inventory Shortage Abating Rapidly
by Calculated Risk on 9/17/2018 06:36:00 PM
Tuesday:
At 10:00 AM ET, The September NAHB homebuilder survey. The consensus is for a reading of 67, unchanged from 67 in August. Any number above 50 indicates that more builders view sales conditions as good than poor.
From housing economist Tom Lawler: Spotlight Seattle: Inventory Shortage Abating Rapidly
Here are some August residential sales and listings statistics for the City of Seattle as compiled by the Northwest MLS.
| Residential Listings and Sales, City of Seattle, August 2018 | |||
|---|---|---|---|
| August-18 | August-17 | % Change | |
| Active Listings | 1,464 | 715 | 104.8% |
| Closed Sales | 875 | 1083 | -19.2% |
| Pending Sales | 875 | 1136 | -23.0% |
Lawler: Early Read on Existing Home Sales in August
by Calculated Risk on 9/17/2018 04:11:00 PM
From housing economist Tom Lawler:
Based on publicly-available local realtor/MLS reports from across the country released through today, I project that existing home sales as estimated by the National Association of Realtors ran at a seasonally adjusted annual rate of 5.36 million, up 0.4% from July’s preliminary pace (which I believe was too low), and down 1.1% from last August’s seasonally adjusted pace.
On the inventory front, local realtor/MLS data, as well as data from other inventory trackers, suggest that the inventory of existing homes for sale in August was up a bit last August, mainly driven by big gains in previous “hot’ markets where inventory levels were very low a year ago. I project that the NAR’s estimate of the number of existing homes for sale as the end of August will be 1.92 million, unchanged from July’s preliminary estimate and up 2.7% from last August.
Finally, local realtor/MLS data suggest that the median US existing single-family home sales price last month was up about 5.5% from last August. Note, however, that of late the NAR’s median existing home sales prices have shown lower YOY gains than local realtor/MLS data would have suggested, for reasons that are not clear.
CR Note: The NAR is scheduled to released August existing home sales on Thursday. The consensus is also for sales of 5.36 million SAAR, up from 5.34 million in July.
Hotels: Occupancy Rate Declines Year-over-year
by Calculated Risk on 9/17/2018 12:49:00 PM
From HotelNewsNow.com: STR: US hotel results for week ending 8 September
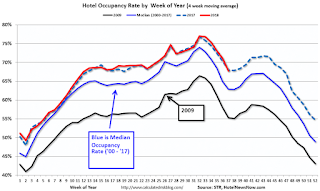
The U.S. hotel industry reported mostly negative year-over-year results in the three key performance metrics during the week of 2-8 September 2018, according to data from STR.The following graph shows the seasonal pattern for the hotel occupancy rate using the four week average.
In comparison with the week of 3-9 September 2017, the industry recorded the following:
• Occupancy: -3.5% to 61.7%
• Average daily rate (ADR): +1.0% to US$121.95
• Revenue per available room (RevPAR): -2.4% to US$75.25
STR analysts note that performance percentage changes in several major markets were significantly affected by the comparison with the post-Hurricane Harvey and pre-Hurricane Irma time period in 2017.
…
Houston, Texas, reported the steepest decreases in each of the three key performance metrics: occupancy (-42.2% to 50.0%), ADR (-19.6% to US$90.73) and RevPAR (-53.6% to US$45.36). Houston’s hotel performance was lifted in the weeks and months that followed Hurricane Harvey in 2017 as properties filled with displaced residents, relief workers, insurance adjustors, media members, etc.
emphasis added
 Click on graph for larger image.
The red line is for 2018, dash light blue is 2017, blue is the median, and black is for 2009 (the worst year probably since the Great Depression for hotels).
The occupancy rate, to date, is just ahead of the record year in 2017.
Note: 2017 finished strong due to the impact of the hurricanes. There will be some boost to hotel occupancy in the Carolina region following hurricane Florence, but I expect the overall occupancy to be lower in 2018 than in 2017.
Data Source: STR, Courtesy of HotelNewsNow.com
LA area Port Traffic in August
by Calculated Risk on 9/17/2018 10:00:00 AM
Container traffic gives us an idea about the volume of goods being exported and imported - and usually some hints about the trade report since LA area ports handle about 40% of the nation's container port traffic.
The following graphs are for inbound and outbound traffic at the ports of Los Angeles and Long Beach in TEUs (TEUs: 20-foot equivalent units or 20-foot-long cargo container).
To remove the strong seasonal component for inbound traffic, the first graph shows the rolling 12 month average.

On a rolling 12 month basis, inbound traffic was down 0.3% compared in August to the rolling 12 months ending in July. Outbound traffic was up 0.2% compared to the rolling 12 months ending in July.
The 2nd graph is the monthly data (with a strong seasonal pattern for imports).

In general imports have been increasing, and exports have mostly moved sideways over the last 6 or 7 years.
It is still too early to tell about the impact of the tariffs.
Fom the NY Fed: Manufacturing "Business activity continued to grow at a solid clip in New York State"
by Calculated Risk on 9/17/2018 08:33:00 AM
From the NY Fed: Empire State Manufacturing Survey
Business activity continued to grow at a solid clip in New York State, according to firms responding to the September 2018 Empire State Manufacturing Survey. The headline general business conditions index showed ongoing strength, but moved down seven points to 19.0, pointing to a slower pace of growth than last month. New orders and shipments grew moderately. Delivery times continued to lengthen, and inventories moved higher. Labor market indicators pointed to an increase in employment levels and longer workweeks. Price indexes were little changed and remained elevated, suggesting ongoing significant increases in both input prices and selling prices. Looking ahead, firms remained fairly optimistic about the six-month outlook.This was below the consensus forecast, but still a solid reading.
…
The index for number of employees held steady at 13.3 and the average workweek index was 11.5, indicating a modest increase in both employment levels and hours worked.
emphasis added
Sunday, September 16, 2018
Sunday Night Futures
by Calculated Risk on 9/16/2018 07:54:00 PM
Weekend:
• Schedule for Week of September 16, 2018
Monday:
• At 8:30 AM ET, The New York Fed Empire State manufacturing survey for September. The consensus is for a reading of 23.0, down from 25.6.
From CNBC: Pre-Market Data and Bloomberg futures: S&P 500 are down 5 and DOW futures are down 45 (fair value).
Oil prices were up over the last week with WTI futures at $68.79 per barrel and Brent at $77.96 per barrel. A year ago, WTI was at $50, and Brent was at $56 - so oil prices are up about 40% year-over-year.
Here is a graph from Gasbuddy.com for nationwide gasoline prices. Nationally prices are at $2.85 per gallon. A year ago prices were at $2.60 per gallon (jumped last year due to hurricane Harvey) - so gasoline prices are up 25 cents per gallon year-over-year.
Oil Rigs: "Treading water"
by Calculated Risk on 9/16/2018 08:12:00 AM
A few comments from Steven Kopits of Princeton Energy Advisors LLC on September 14, 2018:
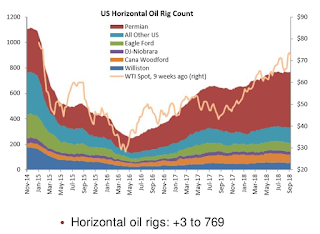
• Oil rigs gained, +7 to 867
• Horizontal oil rigs were up, +3 to 769
...
• Horizontal oil rigs counts are essentially unchanged in 13 weeks
• The Permian has been flat for six weeks, and is only 4 horizontal oil rigs higher than three months ago.
• The breakeven oil price to add horizontal oil rigs came in at $72 WTI this week. This is a good bit higher than the current WTI price around $69.
 Click on graph for larger image.
CR note: This graph shows the US horizontal rig count by basin.
Graph and comments Courtesy of Steven Kopits of Princeton Energy Advisors LLC.
Saturday, September 15, 2018
Schedule for Week of September 16, 2018
by Calculated Risk on 9/15/2018 08:11:00 AM
The key economic reports this week are August Housing Starts and Existing Home Sales.
For manufacturing, the September New York and Philly Fed surveys, will be released this week.
8:30 AM ET: The New York Fed Empire State manufacturing survey for September. The consensus is for a reading of 23.0, down from 25.6.
10:00 AM: The September NAHB homebuilder survey. The consensus is for a reading of 67, unchanged from 67 in August. Any number above 50 indicates that more builders view sales conditions as good than poor.
7:00 AM ET: The Mortgage Bankers Association (MBA) will release the results for the mortgage purchase applications index.
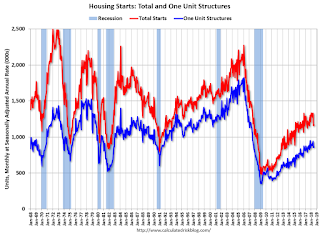
 8:30 AM: Housing Starts for August.
 This graph shows single and total housing starts since 1968.
The consensus is for 1.240 million SAAR, up from 1.168 million SAAR.
During the day: The AIA's Architecture Billings Index for August (a leading indicator for commercial real estate).
8:30 AM: The initial weekly unemployment claims report will be released. The consensus is for 210 thousand initial claims, up from 204 thousand the previous week.
8:30 AM: the Philly Fed manufacturing survey for September. The consensus is for a reading of 19.2, up from 11.9.
 10:00 AM: Existing Home Sales for August from the National Association of Realtors (NAR). The consensus is for 5.36 million SAAR, up from 5.34 million in July.
The graph shows existing home sales from 1994 through the report last month.
12:00 PM: Q2 Flow of Funds Accounts of the United States from the Federal Reserve.
10:00 AM: State Employment and Unemployment (Monthly) for August 2018
Friday, September 14, 2018
Lawler: Single Family Rental Market Share Shrunk Significantly in 2017
by Calculated Risk on 9/14/2018 07:34:00 PM
From housing economist Tom Lawler: Single Family Rental Market Share Shrunk Significantly in 2017
ACS estimates suggest that the renter-occupied share of total occupied single-family detached homes fell to 16.13% in 2017 from 16.76% in 2016. This renter share was the lowest since 2011.
The ACS estimate of the number of renter-occupied single-family detached homes in 2017 was 12,172,265, down 294,869 from 2016.


