by Calculated Risk on 8/23/2018 11:38:00 AM
Thursday, August 23, 2018
A few Comments on July New Home Sales
New home sales for July were reported at 627,000 on a seasonally adjusted annual rate basis (SAAR). This was below the consensus forecast, and the three previous months, combined, were revised down.
Sales in July were up 12.8% year-over-year compared to July 2017. This was strong YoY growth, however this was an easy comparison since new home sales were soft in mid-year 2017.
Earlier: New Home Sales decrease to 627,000 Annual Rate in July.

This graph shows new home sales for 2017 and 2018 by month (Seasonally Adjusted Annual Rate).
Note that new home sales have been up year-over-year every month this year (so far).
Sales are up 7.2% through July compared to the same period in 2017. Decent growth so far, and the next month will also be an easy comparison to 2017.
This is on track to be close to my forecast for 2018 of 650 thousand new home sales for the year; an increase of about 6% over 2017. There are downside risks to that forecast, such as higher mortgage rates, higher costs (labor and material), and possible policy errors. And new home sales had a strong last few months in 2017, so the comparisons will be more difficult.
And here is another update to the "distressing gap" graph that I first started posting a number of years ago to show the emerging gap caused by distressed sales. Now I'm looking for the gap to close over the next several years.

Following the housing bubble and bust, the "distressing gap" appeared mostly because of distressed sales. The gap has persisted even though distressed sales are down significantly, since new home builders focused on more expensive homes.
I expect existing home sales to move more sideways, and I expect this gap to slowly close, mostly from an increase in new home sales.
However, this assumes that the builders will offer some smaller, less expensive homes. If not, then the gap will persist.

This ratio was fairly stable from 1994 through 2006, and then the flood of distressed sales kept the number of existing home sales elevated and depressed new home sales. (Note: This ratio was fairly stable back to the early '70s, but I only have annual data for the earlier years).
In general the ratio has been trending down since the housing bust, and this ratio will probably continue to trend down over the next few years.
Note: Existing home sales are counted when transactions are closed, and new home sales are counted when contracts are signed. So the timing of sales is different.
Kansas City Fed: Regional Manufacturing Activity "Expanded at a Slightly Slower Pace" in August
by Calculated Risk on 8/23/2018 11:00:00 AM
From the Kansas City Fed: Tenth District Manufacturing Activity Expanded at a Slightly Slower Pace
The Federal Reserve Bank of Kansas City released the August Manufacturing Survey today. According to Chad Wilkerson, vice president and economist at the Federal Reserve Bank of Kansas City, the survey revealed that Tenth District manufacturing activity expanded at a slightly slower pace, while expectations remained solid.The regional surveys for August have mostly indicated somewhat slower growth as compared to July.
“Our composite index came down a bit again in August,” said Wilkerson. “But the pace of growth in regional factories is still at the solid levels that prevailed in late 2017 and early 2018.”
...
The month-over-month composite index was 14 in August, down from readings of 23 in July and 28 in June. The composite index is an average of the production, new orders, employment, supplier delivery time, and raw materials inventory indexes. Growth in factory activity remained relatively stable at nondurable goods plants, while durable goods activity slowed slightly, particularly for machinery, computers and electronics. Most month-over-month indexes moderated in August, but were still generally solid. The production, new orders, employment, and new orders for exports indexes all decreased modestly. In contrast, the shipments index rose from 12 to 18 after falling considerably last month. The finished goods inventory index dipped slightly, while the raw material inventory index was unchanged.
emphasis added
New Home Sales decrease to 627,000 Annual Rate in July
by Calculated Risk on 8/23/2018 10:10:00 AM
The Census Bureau reports New Home Sales in July were at a seasonally adjusted annual rate (SAAR) of 627 thousand.
The previous three months were revised down, combined (June was revised up, but April and May were revised down).
"Sales of new single-family houses in July 2018 were at a seasonally adjusted annual rate of 627,000, according to estimates released jointly today by the U.S. Census Bureau and the Department of Housing and Urban Development. This is 1.7 percent below the revised June rate of 638,000, but is 12.8 percent above the July 2017 estimate of 556,000. "
emphasis added
 Click on graph for larger image.
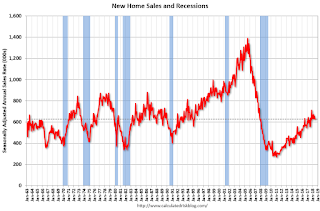
The first graph shows New Home Sales vs. recessions since 1963. The dashed line is the current sales rate.
Even with the increase in sales over the last several years, new home sales are still somewhat low historically.
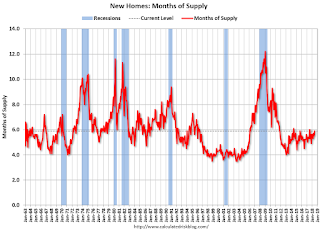
The second graph shows New Home Months of Supply.
 The months of supply increased in July to 5.9 months from 5.7 months in June.
 The all time record was 12.1 months of supply in January 2009.
This is in the normal range (less than 6 months supply is normal).
"The seasonally-adjusted estimate of new houses for sale at the end of July was 309,000. This represents a supply of 5.9 months at the current sales rate."
 On inventory, according to the Census Bureau:
 "A house is considered for sale when a permit to build has been issued in permit-issuing places or work has begun on the footings or foundation in nonpermit areas and a sales contract has not been signed nor a deposit accepted."Starting in 1973 the Census Bureau broke this down into three categories: Not Started, Under Construction, and Completed.
The third graph shows the three categories of inventory starting in 1973.
The inventory of completed homes for sale is still somewhat low, and the combined total of completed and under construction is also somewhat low.
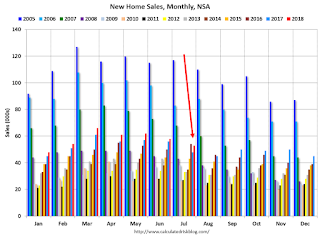
 The last graph shows sales NSA (monthly sales, not seasonally adjusted annual rate).
In July 2018 (red column), 53 thousand new homes were sold (NSA). Last year, 48 thousand homes were sold in July.
The all time high for July was 117 thousand in 2005, and the all time low for July was 26 thousand in 2010.
This was below expectations of 648,000 sales SAAR, and the previous months were revised down, combined. I'll have more later today.
Weekly Initial Unemployment Claims decreased to 210,000
by Calculated Risk on 8/23/2018 08:32:00 AM
The DOL reported:
In the week ending August 18, the advance figure for seasonally adjusted initial claims was 210,000, a decrease of 2,000 from the previous week's unrevised level of 212,000. The 4-week moving average was 213,750, a decrease of 1,750 from the previous week's unrevised average of 215,500.The previous week was unrevised.
emphasis added
The following graph shows the 4-week moving average of weekly claims since 1971.
 Click on graph for larger image.
The dashed line on the graph is the current 4-week average. The four-week average of weekly unemployment claims decreased to 213,750.
This was lower than the consensus forecast. The low level of claims suggest few layoffs.
Wednesday, August 22, 2018
Thursday: New Home Sales, Unemployment Claims
by Calculated Risk on 8/22/2018 08:01:00 PM
Thursday:
• At 8:30 AM ET, The initial weekly unemployment claims report will be released. The consensus is for 215 thousand initial claims, up from 212 thousand the previous week.
• At 9:00 AM, FHFA House Price Index for June 2018. This was originally a GSE only repeat sales, however there is also an expanded index.
• At 10:00 AM, New Home Sales for July from the Census Bureau. The consensus is for 648 thousand SAAR, up from 631 thousand in June.
• At 11:00 AM, the Kansas City Fed manufacturing survey for August.
AIA: "July architecture firm billings remain positive despite growth slowing"
by Calculated Risk on 8/22/2018 03:21:00 PM
Note: This index is a leading indicator primarily for new Commercial Real Estate (CRE) investment.
From the AIA: July architecture firm billings remain positive despite growth slowing
Architecture firm billings growth slowed again in July but remained positive overall for the tenth consecutive month, according to a new report today from The American Institute of Architects (AIA).
AIA’s Architecture Billings Index (ABI) score for July was 50.7 compared to 51.3 in June. Any score over 50 represents billings growth. While July’s ABI shows that aggregate demand for architecture firm services continues to increase, much of that growth came from one region—the South.
“Billings at architecture firms in the South remained robust in July, offsetting declining billings in other regions of the country,” said AIA Chief Economist Kermit Baker, Hon. AIA, PhD. “Despite the dip in the overall ABI number in July, firms are still reporting a healthy increase in new projects.”
...
• Regional averages: West (49.6), Midwest (49.3), South (55.2), Northeast (48.0)
• Sector index breakdown: multi-family residential (54.6), institutional (51.1), commercial/industrial (50.1), mixed practice (48.2)
emphasis added
 Click on graph for larger image.
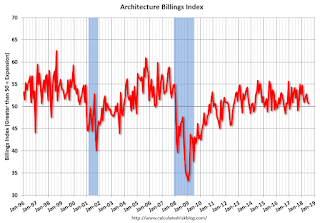
This graph shows the Architecture Billings Index since 1996. The index was at 50.7 in July, down from 51.3 in June. Anything above 50 indicates expansion in demand for architects' services.
Note: This includes commercial and industrial facilities like hotels and office buildings, multi-family residential, as well as schools, hospitals and other institutions.
According to the AIA, there is an "approximate nine to twelve month lag time between architecture billings and construction spending" on non-residential construction. This index was positive in 11 of the last 12 months, suggesting a further increase in CRE investment in 2018 and into 2019.
FOMC Minutes: "Trade disputes a potentially consequential downside risk", Yield Curve Discussion
by Calculated Risk on 8/22/2018 02:06:00 PM
Still on pace for 4 rate hikes in 2018. Some excerpts:
From the Fed: Minutes of the Federal Open Market Committee, July 31-August 1, 2018:
Some participants noted that stronger underlying momentum in the economy was an upside risk; most expressed the view that an escalation in international trade disputes was a potentially consequential downside risk for real activity. Some participants suggested that, in the event of a major escalation in trade disputes, the complex nature of trade issues, including the entire range of their effects on output and inflation, presented a challenge in determining the appropriate monetary policy response. emphasis addedAnd on the yield curve:
Participants also discussed the possible implications of a flattening in the term structure of market interest rates. Several participants cited statistical evidence for the United States that inversions of the yield curve have often preceded recessions. They suggested that policymakers should pay close attention to the slope of the yield curve in assessing the economic and policy outlook. Other participants emphasized that inferring economic causality from statistical correlations was not appropriate. A number of global factors were seen as contributing to downward pressure on term premiums, including central bank asset purchase programs and the strong worldwide demand for safe assets. In such an environment, an inversion of the yield curve might not have the significance that the historical record would suggest; the signal to be taken from the yield curve needed to be considered in the context of other economic and financial indicators.
A Few Comments on July Existing Home Sales
by Calculated Risk on 8/22/2018 11:59:00 AM
Earlier: NAR: Existing-Home Sales Decline in July
A few key points:
1) This is a reasonable level for existing home sales, and doesn't suggest any significant weakness in housing or the economy. The key for the housing - and the overall economy - is new home sales, single family housing starts and overall residential investment.
2) Inventory is still very low, but was unchanged year-over-year (YoY) in July. Inventory for June was initially reported as up slightly year-over-year, but inventory was revised down. Following 37 consecutive months with a year-over-year decline in inventory, inventory was unchanged (a first since June 2015).
3) As usual, housing economist Tom Lawler's forecast was closer to the NAR report than the consensus. See: Lawler: Early Read on Existing Home Sales in July. The consensus was for sales of 5.43 million SAAR, Lawler estimated the NAR would report 5.40 million SAAR in July, and the NAR actually reported 5.34 million.
The following graph shows existing home sales Not Seasonally Adjusted (NSA).

Sales NSA in July (522,000, red column) were above sales in July 2017 (513,000, NSA).
Sales NSA through July (first seven months) are down about 1.6% from the same period in 2017.
This is a small YoY decline in sales to-date - but it is possible there has been an impact from higher interest rates and / or the changes to the tax law (eliminating property taxes write-off, etc).
Employment: Preliminary annual benchmark revision shows upward adjustment of 43,000 jobs
by Calculated Risk on 8/22/2018 10:45:00 AM
The BLS released the preliminary annual benchmark revision showing 43,000 additional payroll jobs as of March 2018. The final revision will be published when the January 2019 employment report is released in February 2019. Usually the preliminary estimate is pretty close to the final benchmark estimate.
The annual revision is benchmarked to state tax records. From the BLS:
In accordance with usual practice, the Bureau of Labor Statistics (BLS) is announcing the preliminary estimate of the upcoming annual benchmark revision to the establishment survey employment series. The final benchmark revision will be issued in February 2019 with the publication of the January 2019 Employment Situation news release.Using the preliminary benchmark estimate, this means that payroll employment in March 2018 was 43,000 higher than originally estimated. In February 2019, the payroll numbers will be revised up to reflect the final estimate. The number is then "wedged back" to the previous revision (March 2017).
Each year, the Current Employment Statistics (CES) survey employment estimates are benchmarked to comprehensive counts of employment for the month of March. These counts are derived from state unemployment insurance (UI) tax records that nearly all employers are required to file. For National CES employment series, the annual benchmark revisions over the last 10 years have averaged plus or minus two-tenths of one percent of total nonfarm employment. The preliminary estimate of the benchmark revision indicates an upward adjustment to March 2018 total nonfarm employment of 43,000 (< 0.05 percent).
emphasis added
Construction was revised up by 42,000 jobs, and manufacturing revised down by 9,000 jobs.
This preliminary estimate showed 17,000 fewer private sector jobs, and 60,000 more government jobs (as of March 2018).
NAR: Existing-Home Sales Decline in July
by Calculated Risk on 8/22/2018 10:11:00 AM
From the NAR: Existing-Home Sales Slip 0.7 Percent in July
Existing-home sales subsided for the fourth straight month in July to their slowest pace in over two years, according to the National Association of Realtors®. The West was the only major region with an increase in sales last month.
Total existing-home saless, which are completed transactions that include single-family homes, townhomes, condominiums and co-ops, decreased 0.7 percent to a seasonally adjusted annual rate of 5.34 million in July from 5.38 million in June. With last month’s decline, sales are now 1.5 percent below a year ago and have fallen on an annual basis for five straight months.
...
Total housing inventory at the end of July decreased 0.5 percent to 1.92 million existing homes available for sale (unchanged from a year ago). Unsold inventory is at a 4.3-month supply at the current sales pace (also unchanged from a year ago).
emphasis added
 Click on graph for larger image.
This graph shows existing home sales, on a Seasonally Adjusted Annual Rate (SAAR) basis since 1993.
Sales in July (5.34 million SAAR) were 0.7% lower than last month, and were 1.5% below the July 2017 rate.
The second graph shows nationwide inventory for existing homes.
 According to the NAR, inventory decreased to 1.92 million in July from 1.93 million in June. Headline inventory is not seasonally adjusted, and inventory usually decreases to the seasonal lows in December and January, and peaks in mid-to-late summer.
The last graph shows the year-over-year (YoY) change in reported existing home inventory and months-of-supply. Since inventory is not seasonally adjusted, it really helps to look at the YoY change. Note: Months-of-supply is based on the seasonally adjusted sales and not seasonally adjusted inventory.
 Inventory was unchanged year-over-year in July compared to July 2017.
 Months of supply was at 4.3 months in July.
Sales were below the consensus view. For existing home sales, a key number is inventory - and inventory is still low, but appears to be bottoming. I'll have more later ...


