by Calculated Risk on 8/19/2018 08:01:00 AM
Sunday, August 19, 2018
Lawler: A Few “Hot” Markets Home Inventories are Up Sharply
CR note: Some data below from housing economist Tom Lawler:
| Active Listings and Closed Sales, Single-Family Homes | ||||||
|---|---|---|---|---|---|---|
| Active Listings | Closed Sales | |||||
| 7/12018 | 7/1/2017 | % Chg | 7/1/2018 | 7/1/2017 | % Chg | |
| King County, WA (includes Seattle) | 4,163 | 2,898 | 43.7% | 2,477 | 2727 | -9.2% |
| Nashville, TN | 8,323 | 6,177 | 34.7% | 3,232 | 3,248 | -0.5% |
| Portland, OR | 6,549 | 5,785 | 13.2% | 2,736 | 2,793 | -2.0% |
Saturday, August 18, 2018
Schedule for Week of August 19, 2018
by Calculated Risk on 8/18/2018 08:11:00 AM
The key economic reports this week are July New and Existing Home Sales.
Fed Chair Jerome Powell will speak on Friday at the Federal Reserve Bank of Kansas City Economic Policy Symposium, at Jackson Hole, Wyo.
No major economic releases scheduled.
No major economic releases scheduled.
7:00 AM ET: The Mortgage Bankers Association (MBA) will release the results for the mortgage purchase applications index.
During the day: The AIA's Architecture Billings Index for July (a leading indicator for commercial real estate).
 10:00 AM: Existing Home Sales for July from the National Association of Realtors (NAR). The consensus is for 5.43 million SAAR, up from 5.38 million in June.
The graph shows existing home sales from 1994 through the report last month.
Housing economist Tom Lawler estimates the NAR will reports sales of 5.40 million SAAR for July and that inventory will be down 1.0% year-over-year.
10:00 AM: The BLS will release the 2018 CES Preliminary Benchmark Revision.
2:00 PM: The Fed will release the FOMC Minutes for the Meeting of July 31-August 1, 2018
8:30 AM: The initial weekly unemployment claims report will be released. The consensus is for 215 thousand initial claims, up from 212 thousand the previous week.
9:00 AM: FHFA House Price Index for June 2018. This was originally a GSE only repeat sales, however there is also an expanded index.
 10:00 AM: New Home Sales for July from the Census Bureau.
 This graph shows New Home Sales since 1963. The dashed line is the sales rate for last month.
The consensus is for 648 thousand SAAR, up from 631 thousand in June.
11:00 AM: the Kansas City Fed manufacturing survey for August.
8:30 AM: Durable Goods Orders for July from the Census Bureau. The consensus is for a 0.2% decrease in durable goods orders.
10:00 AM: Speech by Fed Chair Jerome Powell, "Monetary Policy in a Changing Economy", At the Federal Reserve Bank of Kansas City Economic Policy Symposium, Jackson Hole, Wyo.
Friday, August 17, 2018
Oil Rigs: "A breather after last week's big gains"
by Calculated Risk on 8/17/2018 07:01:00 PM
A few comments from Steven Kopits of Princeton Energy Advisors LLC on August 17, 2018:
• Oil rigs took a breather, consolidating last week’s gains
• Total rigs were flat at 869
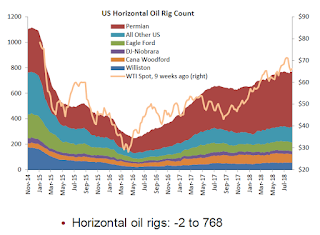
• Horizontal oil rigs declined, -2 to 768
...
• Horizontal oil rig counts stand at the level of ten weeks ago in both the Permian and other plays
• This month’s DPR shows US shale oil production was up 150 kbpd in July to 7.2 mbpd.
• Year on year growth in the Permian came in a 0.92 mbpd – almost one million barrels per day of annual growth from just one play!
 Click on graph for larger image.
CR note: This graph shows the US horizontal rig count by basin.
Graph and comments Courtesy of Steven Kopits of Princeton Energy Advisors LLC.
Lawler: Early Read on Existing Home Sales in July
by Calculated Risk on 8/17/2018 02:40:00 PM
From housing economist Tom Lawler: Early Read on Existing Home Sales in July
Based on publicly-available local realtor/MLS reports from across the country released through today, I project that existing home sales as estimated by the National Association of Realtors ran at a seasonally adjusted annual rate of 5.40 million in July, up 0.4% from June’s preliminary pace and down 0.4% from last July’s seasonally adjusted pace. Unadjusted sales should show a modest year-over-year gain, with the SA/NSA gap reflecting this July’s higher business day count relative to last July.
Projecting the NAR’s inventory estimate for July using local realtor/MLS data is tricky, as local data for June did not suggest that national inventories were up YOY, as the NAR estimate suggested (the NAR’s estimate for June showed a 0.5% YOY increase). Local realtor/MLS data, as well as other tracking services, suggest that the inventory of existing homes for sale in July were down very slightly from last July, and my “best guess” is that the NAR’s inventory estimate for July will be 1.90 million, down 2.6% from June’s preliminary estimate and down 1.0% from last July’s estimate.
Finally, local realtor/MLS data suggest that the median US existing single-family home sales price last month was up about 5.7% from last July. Note, however, that of late the NAR’s median existing home sales prices have shown lower YOY gains than local realtor/MLS data would have suggested, for reasons that are not clear.
CR Note: Existing home sales for July are scheduled to be released by the NAR on Wednesday, Aug 22nd.
Q3 GDP Forecasts
by Calculated Risk on 8/17/2018 11:19:00 AM
From Goldman Sachs:
We lowered our Q3 GDP tracking estimate by one tenth to +3.2% [Aug 16 estimate].From Merrill Lynch:
emphasis added
We nudged down 3Q GDP tracking by a tenth to 3.3%. [Aug 15 estimate].And from the Altanta Fed: GDPNow
The GDPNow model estimate for real GDP growth (seasonally adjusted annual rate) in the third quarter of 2018 is 4.3 percent on August 16, unchanged from August 15 after rounding. [Aug 16 estimate]From the NY Fed Nowcasting Report
The New York Fed Staff Nowcast for 2018:Q3 stands at 2.4%. [Aug 17 estimate]CR Note: Since it is early, the range of estimates are wide. These estimates suggest real annualized GDP in the 2.4% to 4.3% range in Q3.
BLS: Unemployment Rates Lower in 11 states in July, Oregon at New Low
by Calculated Risk on 8/17/2018 10:09:00 AM
From the BLS: Regional and State Employment and Unemployment Summary
Unemployment rates were lower in July in 11 states, higher in 2 states, and stable in 37 states and the District of Columbia, the U.S. Bureau of Labor Statistics reported today. Ten states had jobless rate decreases from a year earlier and 40 states and the District had little or no change. The national unemployment rate edged down by 0.1 percentage point from June to 3.9 percent and was 0.4 point lower than in July 2017.
...
Hawaii had the lowest unemployment rate in July, 2.1 percent. The rate in Oregon (3.9 percent) set a new series low. (All state series begin in 1976.) Alaska had the highest jobless rate, 6.9 percent. In total, 15 states had unemployment rates lower than the U.S. figure of 3.9 percent, 10 states and the District of Columbia had higher rates, and 25 states had rates that were not appreciably different from that of the nation.
emphasis added
 Click on graph for larger image.
This graph shows the number of states (and D.C.) with unemployment rates at or above certain levels since January 1976.
At the worst of the great recession, there were 11 states with an unemployment rate at or above 11% (red).
Currently only one state, Alaska, has an unemployment rate at or above 6% (dark blue).
Thursday, August 16, 2018
Houston: Existing Home Sales up 9.1% YoY, Inventory down 3.5% YoY
by Calculated Risk on 8/16/2018 07:22:00 PM
From the HAR: Houston Real Estate Stays Hot in July
Houston home sales showed no let-up in July, but the pace was not enough to rival the record-setting volume and pricing set in June. Inventory remained constrained at a 4.2-months supply, and the lease market saw waning consumer interest.CR Note: Houston activity has likely been boosted by the sharp increase in oil prices over the last year.
According to the latest monthly report from the Houston Association of REALTORS® (HAR), 8,108 single-family homes sold in July compared to 7,433 a year earlier, accounting for a 9.1-percent increase. On a year-to-date basis, home sales are running 3.4 percent ahead of 2017’s record volume.
California: "Housing market retreats", Inventory up 11.9% YoY
by Calculated Risk on 8/16/2018 03:22:00 PM
The CAR reported today: California’s housing market retreats for third straight month as affordability crunch dampens demand
California’s housing market backpedaled in July on an annual basis for the third consecutive month as higher interest rates and rising home prices eroded housing affordability and dampened demand, the CALIFORNIA ASSOCIATION OF REALTORS® (C.A.R.) said today.Here is some data from the NAR and CAR (ht Tom Lawler)
Closed escrow sales of existing, single-family detached homes in California totaled a seasonally adjusted annualized rate of 406,920 units in July, according to information collected by C.A.R. from more than 90 local REALTOR® associations and MLSs statewide. The statewide annualized sales figure represents what would be the total number of homes sold during 2018 if sales maintained the July pace throughout the year. It is adjusted to account for seasonal factors that typically influence home sales.
July’s sales figure was down 0.9 percent from the revised 410,800 level in June and down 3.4 percent compared with home sales in July 2017 of 421,460.
“In the midst of the peak home-buying season, high home prices and rising interest rates combined to crimp housing affordability, which in turn is subduing home sales,” said C.A.R. President Steve White. “Some of the reluctance by buyers appears to be driven by fears that the market may be peaking. Additionally, the lack of a federal tax incentive for homeownership could be at play given that much of the weakness is in the lower-priced, first-time buyer segment of the market.”
…
“While home sales continued to decline in recent months, the softening of the market is more indicative of a market shift rather than a major market correction,” said C.A.R. Senior Vice President and Chief Economist Leslie Appleton-Young. “Despite the slowdown, there were some silver linings in the market in July. For example, homes priced between $500,000 and $1 million posted modest gains of about 5 percent in July thanks to growing inventory. Additionally, every price segment above $1 million continued to enjoy double-digit sales gains.”
...
Statewide active listings improved for the fourth consecutive month after 33 straight months of declines, increasing 11.9 percent from the previous year. July’s listings increase was the biggest in more than three years, and the number of active listings was the greatest supply of homes on the market in nearly two years.
emphasis added
| YOY % Change, Existing SF Homes for Sale | ||
|---|---|---|
| NAR (National) | CAR (California) | |
| Sep-17 | -8.4% | -11.2% |
| Oct-17 | -10.4% | -11.5% |
| Nov-17 | -9.7% | -11.5% |
| Dec-17 | -11.5% | -12.0% |
| Jan-18 | -9.5% | -6.6% |
| Feb-18 | -8.6% | -1.3% |
| Mar-18 | -7.2% | -1.0% |
| Apr-18 | -6.3% | 1.9% |
| May-18 | -5.1 | 8.3% |
| Jun-18 | 0.5% | 8.1% |
| Jul-18 | --- | 11.9% |
Earlier: Philly Fed Manufacturing Survey "Growth in activity slowed" in August
by Calculated Risk on 8/16/2018 01:43:00 PM
From the Philly Fed: August 2018 Manufacturing Business Outlook Survey
Growth in regional manufacturing activity slowed in August, according to results from this month’s Manufacturing Business Outlook Survey. All the broad indicators remained positive but fell from their readings in July.Here is a graph comparing the regional Fed surveys and the ISM manufacturing index:
...
The diffusion index for current general activity decreased 14 points this month to 11.9, its lowest reading in 21 months. Nearly 32 percent of the manufacturers reported increases in overall activity this month, while 20 percent reported decreases. The new orders index fell 22 points to 9.9. More than 34 percent of the firms reported an increase in new orders, while 24 percent reported a decrease.
The firms continued to report overall higher employment, but increases were less widespread this month. Just 18 percent of the responding firms reported increases in employment this month, down from 24 percent last month. Only 4 percent of the firms reported decreases in employment. The current employment index fell 3 points to 14.3. The current average workweek index declined 3 points.
emphasis added
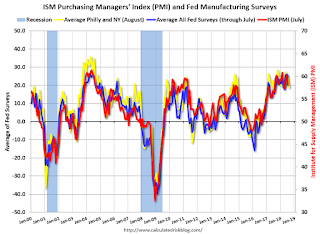
 Click on graph for larger image.
The New York and Philly Fed surveys are averaged together (yellow, through August), and five Fed surveys are averaged (blue, through July) including New York, Philly, Richmond, Dallas and Kansas City. The Institute for Supply Management (ISM) PMI (red) is through July (right axis).
This suggests the ISM manufacturing index might decline in August, but still show solid expansion.
Comments on July Housing Starts
by Calculated Risk on 8/16/2018 11:01:00 AM
Earlier: Housing Starts at 1.168 Million Annual Rate in July
Housing starts in July were disappointing once again, and starts for May and June were revised down. However this was just the second month of disappointing starts, and most of the decline was in multi-family starts that are volatile month-to-month.
The housing starts report released this morning showed starts were up 0.9% in July compared to June (only up because June was revised down), and starts were down 1.4% year-over-year compared to July 2017.
Multi-family starts were down 9.6% year-over-year, and single family starts were up 2.7% year-over-year.
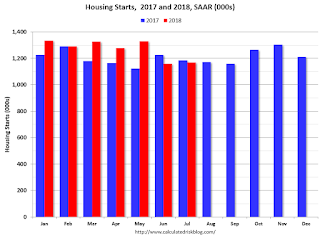
This first graph shows the month to month comparison for total starts between 2017 (blue) and 2018 (red).

Starts were down 1.4% in July compared to July 2017.
Through seven months, starts are up 6.2% year-to-date compared to the same period in 2017. Even with the weakness over the last two months, that is still a decent increase.
Single family starts were up 2.7% year-over-year, and up 0.9% compared to July 2018.
Multi-family starts were down 9.6% year-over-year, and up 3.1% compared to June 2018 (multi-family is volatile month-to-month).
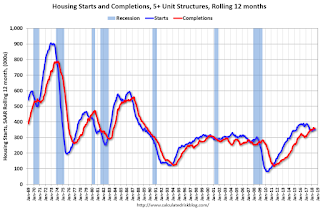
Below is an update to the graph comparing multi-family starts and completions. Since it usually takes over a year on average to complete a multi-family project, there is a lag between multi-family starts and completions. Completions are important because that is new supply added to the market, and starts are important because that is future new supply (units under construction is also important for employment).
These graphs use a 12 month rolling total for NSA starts and completions.

The rolling 12 month total for starts (blue line) increased steadily for several years following the great recession - but has turned down recently. Completions (red line) had lagged behind - however completions have passed starts (more deliveries).
It is likely that both starts and completions, on rolling 12 months basis, will now move mostly sideways.
As I've been noting for a few years, the significantly growth in multi-family starts is behind us - multi-family starts peaked in June 2015 (at 510 thousand SAAR).

Note the relatively low level of single family starts and completions. The "wide bottom" was what I was forecasting following the recession, and now I expect a couple more years, or more, of increasing single family starts and completions.
Note: Last month, in response to numerous articles discussing the "slowing housing market" and some suggesting "housing has peaked", I wrote: Has Housing Market Activity Peaked? and Has the Housing Market Peaked? (Part 2). My view currently remains the same, but if the weakness in housing starts and new home sales persist, I'll revisit my outlook. My guess is the weakness will not continue, and new home sales and single family starts will increase further.


