 RSS Feed
 by Calculated Risk on 7/17/2018 12:53:00 PM
Tuesday, July 17, 2018
Greenspan 13 Years Ago: "Froth in housing markets"
With Fed Chair Powell testifying today, I took a look back at then Fed Chair Alan Greenspan's testimony in July 2005: Testimony of Chairman Alan Greenspan
The apparent froth in housing markets appears to have interacted with evolving practices in mortgage markets. The increase in the prevalence of interest-only loans and the introduction of more-exotic forms of adjustable-rate mortgages are developments of particular concern. To be sure, these financing vehicles have their appropriate uses. But some households may be employing these instruments to purchase homes that would otherwise be unaffordable, and consequently their use could be adding to pressures in the housing market. Moreover, these contracts may leave some mortgagors vulnerable to adverse events. It is important that lenders fully appreciate the risk that some households may have trouble meeting monthly payments as interest rates and the macroeconomic climate change.CR Note: The signs were there. And Greenspan came close to understanding what was happening, but just couldn't bring himself to call it a "bubble".
The U.S. economy has weathered such episodes before without experiencing significant declines in the national average level of home prices. Nevertheless, we certainly cannot rule out declines in home prices, especially in some local markets. If declines were to occur, they likely would be accompanied by some economic stress, though the macroeconomic implications need not be substantial. Nationwide banking and widespread securitization of mortgages make financial intermediation less likely to be impaired than it was in some previous episodes of regional house-price correction. Moreover, a decline in the national housing price level would need to be substantial to trigger a significant rise in foreclosures, because the vast majority of homeowners have built up substantial equity in their homes despite large mortgage-market-financed withdrawals of home equity in recent years.
NAHB: Builder Confidence Unchanged at 68 in July
by Calculated Risk on 7/17/2018 10:06:00 AM
The National Association of Home Builders (NAHB) reported the housing market index (HMI) was at 68 in July, unchanged from 68 in June. Any number above 50 indicates that more builders view sales conditions as good than poor.
From NAHB: Builder Confidence Stays at Healthy Level in July
Builder confidence in the market for newly-built single-family homes remained unchanged at a solid 68 reading in July on the National Association of Home Builders/Wells Fargo Housing Market Index (HMI).
“Consumer demand for single-family homes is holding strong this summer, buoyed by steady job growth, income gains and low unemployment in many parts of the country,” said NAHB Chairman Randy Noel, a custom home builder from LaPlace, La.
“Builders are encouraged by growing housing demand, but they continue to be burdened by rising construction material costs,” said NAHB Chief Economist Robert Dietz. “Builders need to manage these cost increases as they strive to provide competitively priced homes, especially as more first-time home buyers enter the housing market.”
...
The HMI index measuring current sales conditions remained unchanged at 74. Meanwhile, the component gauging expectations in the next six months dropped two points to 73 and the metric charting buyer traffic rose two points to 52.
Looking at the three-month moving averages for regional HMI scores, the Northeast rose one point to 57 while the Midwest remained unchanged at 65. The West and South each fell one point to 75 and 70, respectively.
emphasis added
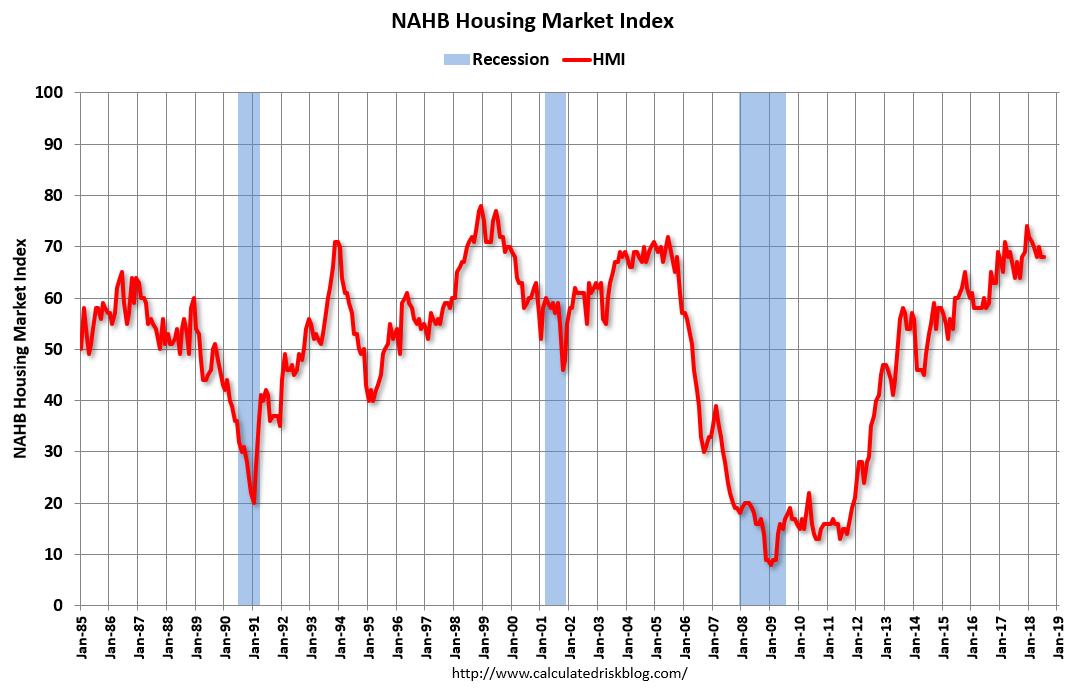 Click on graph for larger image.
This graph show the NAHB index since Jan 1985.
This was slightly below the consensus forecast, but still a solid reading.
Industrial Production Increased 0.6% in June
by Calculated Risk on 7/17/2018 09:23:00 AM
From the Fed: Industrial Production and Capacity Utilization
Industrial production rose 0.6 percent in June after declining 0.5 percent in May. For the second quarter as a whole, industrial production advanced at an annual rate of 6.0 percent, its third consecutive quarterly increase. Manufacturing output moved up 0.8 percent in June. The production of motor vehicles and parts rebounded last month after truck assemblies fell sharply in May because of a disruption at a parts supplier. Factory output, aside from motor vehicles and parts, increased 0.3 percent in June. The index for mining rose 1.2 percent and surpassed the level of its previous historical peak (December 2014); the output of utilities moved down 1.5 percent. At 107.7 percent of its 2012 average, total industrial production was 3.8 percent higher in June than it was a year earlier. Capacity utilization for the industrial sector increased 0.3 percentage point in June to 78.0 percent, a rate that is 1.8 percentage points below its long-run (1972–2017) average.
emphasis added
 Click on graph for larger image.
This graph shows Capacity Utilization. This series is up 11.3 percentage points from the record low set in June 2009 (the series starts in 1967).
Capacity utilization at 78.0% is 1.8% below the average from 1972 to 2017 and below the pre-recession level of 80.8% in December 2007.
Note: y-axis doesn't start at zero to better show the change.
 The second graph shows industrial production since 1967.
Industrial production increased in June to 107.3. This is 24% above the recession low, and 2% above the pre-recession peak.
Monday, July 16, 2018
Tuesday: Fed Chair Powell Testimony, Industrial Production, Homebuilder Confidence
by Calculated Risk on 7/16/2018 05:52:00 PM
From Matthew Graham at Mortgage News Daily: Mortgage Rates Edge Higher
Mortgage rates fell to their lowest levels since late May as of last Friday. Today, then, would be the 2nd best day since late May. Rates edged slightly higher to begin the new week as bond markets (which underlie rates) came under modest pressure for several relatively inconsequential reasons. [30YR FIXED - 4.625% - 4.75%]Tuesday:
emphasis added
• At 9:15 AM ET, The Fed will release Industrial Production and Capacity Utilization for June. The consensus is for a 0.6% increase in Industrial Production, and for Capacity Utilization to increase to 78.3%.
• At 10:00 AM, The July NAHB homebuilder survey. The consensus is for a reading of 69, up from 68 in June. Any number above 50 indicates that more builders view sales conditions as good than poor.
• At 10:00 AM, Testimony, Fed Chair Jerome Powell, Semiannual Monetary Policy Report to the Congress, Before the Committee on Banking, Housing, and Urban Affairs, U.S. Senate
Q2 GDP Forecasts Increased Following Retail Report
by Calculated Risk on 7/16/2018 01:30:00 PM
From Merrill Lynch:
Core control retail sales were flat, weaker than expected but the May number was revised higher to 0.8% mom from 0.5% mom. The upward revision to May more than offset the weakness in June, pushing up 2Q GDP tracking up to 4.0% from 3.8%. [July 16 estimate].And from the Altanta Fed: GDPNow
emphasis added
The GDPNow model estimate for real GDP growth (seasonally adjusted annual rate) in the second quarter of 2018 is 4.5 percent on July 16, up from 3.9 percent on July 11. The nowcast of second-quarter real consumer spending growth increased from 2.7 percent to 3.1 percent after this morning's retail sales report from the U.S. Census Bureau. [July 16 estimate]CR note: This looks like it might be the first quarter with 4.0%+ real annualized GDP growth since Q3 2014 when GDP increased 5.2% (after increasing 4.6% in Q2 2014).
Earlier from the NY Fed: Manufacturing "Business activity continued to grow at a fairly brisk pace in New York State"
by Calculated Risk on 7/16/2018 10:48:00 AM
From the NY Fed: Empire State Manufacturing Survey
Business activity continued to grow at a fairly brisk pace in New York State, according to firms responding to the July 2018 Empire State Manufacturing Survey. The headline general business conditions index edged down by over two points to 22.6—still a high level, suggesting a continuation of robust growth. The new orders index dipped three points to 18.2, while the shipments index fell nine points to 14.6, pointing to a modest pullback in growth of orders and shipments.This was slightly above the consensus forecast and a solid reading.
…
The index for number of employees, which had climbed to its highest level of the year in June, edged back two points to 17.2, pointing to ongoing moderate growth in employment. The average workweek index fell six points to 5.6, suggesting more modest increases in hours worked than in recent months.
emphasis added
Retail Sales increased 0.5% in June
by Calculated Risk on 7/16/2018 08:40:00 AM
On a monthly basis, retail sales increased 0.5 percent from May to June (seasonally adjusted), and sales were up 5.9 percent from June 2017.
From the Census Bureau report:
Advance estimates of U.S. retail and food services sales for June 2018, adjusted for seasonal variation and holiday and trading-day differences, but not for price changes, were $506.8 billion, an increase of 0.5 percent from the previous month, and 6.6 percent (±0.5 percent) above June 2017. Total sales for the April 2018 through June 2018 period were up 5.9 percent from the same period a year ago. The April 2018 to May 2018 percent change was revised from up 0.8 percent to up 1.3 percent.
 Click on graph for larger image.
This graph shows retail sales since 1992. This is monthly retail sales and food service, seasonally adjusted (total and ex-gasoline).
Retail sales ex-gasoline were up 0.47% in June.
The second graph shows the year-over-year change in retail sales and food service (ex-gasoline) since 1993.
 Retail and Food service sales, ex-gasoline, increased by 5.2% on a YoY basis.
The increase in June was slightly below expectations, however sales in April and May, combined, were revised up.
Sunday, July 15, 2018
Monday: Retail Sales, NY Fed Mfg Survey
by Calculated Risk on 7/15/2018 09:13:00 PM
Weekend:
• Schedule for Week of July 15, 2018
Monday:
• At 8:30 AM ET, Retail sales for June will be released. The consensus is for a 0.6% increase in retail sales.
• Also at 8:30 AM, The New York Fed Empire State manufacturing survey for July. The consensus is for a reading of 21.0, down from 25.0.
From CNBC: Pre-Market Data and Bloomberg futures: S&P 500 are up 5, and DOW futures are up 65 (fair value).
Oil prices were down over the last week with WTI futures at $70.73 per barrel and Brent at $75.04 per barrel. A year ago, WTI was at $47, and Brent was at $48 - so oil prices are up 50% year-over-year.
Here is a graph from Gasbuddy.com for nationwide gasoline prices. Nationally prices are at $2.88 per gallon. A year ago prices were at $2.24 per gallon - so gasoline prices are up 64 cents per gallon year-over-year.
The Longest Economic and Housing Expansions in U.S. History
by Calculated Risk on 7/15/2018 08:19:00 AM
According to NBER, the four longest expansions in U.S. history are:
1) From a trough in March 1991 to a peak in March 2001 (120 months).
2) From a trough in June 2009 to today, July 2018 (109 months and counting).
3) From a trough in February 1961 to a peak in December 1969 (106 months).
4) From a trough in November 1982 to a peak in July 1990 (92 months).
So the current expansion is the second longest, and it seems very likely that the current expansion will surpass the '90s expansion in the Summer of 2019.
As I noted last year in Is a Recession Imminent? (one of the five questions I'm frequently asked)
Expansions don't die of old age! There is a very good chance this will become the longest expansion in history.A key reason the current expansion has been so long is that housing didn't contribute for the first few years of the expansion. Also the housing recovery was sluggish for a few more years after the bottom in 2011. This was because of the huge overhang of foreclosed properties coming on the market. Single family housing starts and new home sales both bottomed in 2011 - so this is just the seventh year of expansion - and I expect further increases in starts and sales over the next couple of years.
Unfortunately we only have new home sales data back to 1963, and the housing cycles aren't as clear as the overall business cycle (dates are approximate). But here are the housing expansions since 1963:
1) From a trough in January 1991 to a peak in November 1998 (94 months). Note: This could be considered all the way until July 2005 (a total of 175 months!)
2) From a trough in February 2011 to today, July 2018 (89 months and counting).
3) From a trough in June 2000 to a peak in July 2005 (61 months).
4) From a trough in September 1981 to a peak in March 1986 (54 months).
5) From a trough in January 1975 to a peak in October 1978 (45 months).
6) From a trough in February 1970 to a peak in October 1972 (32 months).
Usually housing bottoms a few months before the economy bottoms, but peaks a year or more before the economy peaks (this is why housing is a good leading indicator). In general the housing cycle is shorter than the business cycle. By the end of this year, the current housing expansion will be the longest since at least 1963 (unless we consider the previous two cycles as just one - then there is a long way to go!).
Given the number of housing starts and new home sales, there is still room for further expansion.
Saturday, July 14, 2018
Schedule for Week of July 15, 2018
by Calculated Risk on 7/14/2018 08:11:00 AM
The key economic reports this week are June Housing Starts and Retail Sales.
For manufacturing, June industrial production, and the July New York and Philly Fed surveys, will be released this week.
Fed Chair Jerome Powell will testify on the semiannual Monetary Policy Report to the Congress
 8:30 AM ET: Retail sales for June will be released. The consensus is for a 0.6% increase in retail sales.
This graph shows the year-over-year change in retail sales and food service (ex-gasoline) since 1993. Retail and Food service sales, ex-gasoline, increased by 4.9% on a YoY basis.
8:30 AM ET: The New York Fed Empire State manufacturing survey for July. The consensus is for a reading of 21.0, down from 25.0.
 9:15 AM: The Fed will release Industrial Production and Capacity Utilization for June.
This graph shows industrial production since 1967.
The consensus is for a 0.6% increase in Industrial Production, and for Capacity Utilization to increase to 78.3%.
10:00 AM: The July NAHB homebuilder survey. The consensus is for a reading of 69, up from 68 in June. Any number above 50 indicates that more builders view sales conditions as good than poor.
10:00 AM: Testimony, Fed Chair Jerome Powell, Semiannual Monetary Policy Report to the Congress, Before the Committee on Banking, Housing, and Urban Affairs, U.S. Senate
7:00 AM ET: The Mortgage Bankers Association (MBA) will release the results for the mortgage purchase applications index.
 8:30 AM: Housing Starts for June.
 This graph shows single and total housing starts since 1968.
The consensus is for 1.320 million SAAR, down from 1.350 million SAAR in May.
During the day: The AIA's Architecture Billings Index for June (a leading indicator for commercial real estate).
10:00 AM: Testimony, Fed Chair Jerome Powell, Semiannual Monetary Policy Report to the Congress, Before the Committee on Financial Services, U.S. House of Representatives
2:00 PM: the Federal Reserve Beige Book, an informal review by the Federal Reserve Banks of current economic conditions in their Districts.
8:30 AM: The initial weekly unemployment claims report will be released. The consensus is for 220 thousand initial claims, up from 214 thousand the previous week.
8:30 AM: the Philly Fed manufacturing survey for July. The consensus is for a reading of 22.0, up from 19.9.
10:00 AM: State Employment and Unemployment (Monthly) for June 2018


