by Calculated Risk on 6/08/2018 04:42:00 PM
Friday, June 08, 2018
Bernanke Video: "What you are getting is a stimulus at the very wrong moment"
This discussion with Ben Bernanke is worth watching. He discusses monetary policy, QE, and the poor timing of the recent fiscal stimulus (something I've mentioned several times).
The Bernanke portion of the video ends around the 35 minute mark.
Q2 GDP Forecasts
by Calculated Risk on 6/08/2018 01:19:00 PM
From Merrill Lynch:
Better than expected trade data nudged up 2Q GDP tracking to 3.8% qoq saar [June 8 estimate].And from the Altanta Fed: GDPNow
emphasis added
The GDPNow model estimate for real GDP growth (seasonally adjusted annual rate) in the second quarter of 2018 is 4.5 percent on June 6, down from 4.8 percent on June 1. [June 8 estimate]From the NY Fed Nowcasting Report
The New York Fed Staff Nowcast stands at 3.1% for 2018:Q2 and 2.9% for 2018:Q3. [June 8 estimate]CR Note: These estimates suggest real annualized GDP in the 3% to 4.5% range in Q2.
AAR: Rail Carloads Up 3.2% YoY, Intermodal Up 6.6% YoY
by Calculated Risk on 6/08/2018 11:19:00 AM
From the Association of American Railroads (AAR) Rail Time Indicators. Graphs and excerpts reprinted with permission.
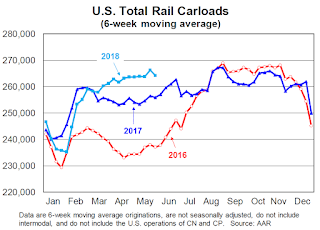
The U.S. economy is clicking right now, and freight railroads are both beneficiaries and enablers of that. In May 2018, originated carloads on U.S. railroads were up 3.2% over May 2017, the third straight month with year-over-year growth greater than 3%. In May 2018, 15 of the 20 commodity categories the AAR tracks saw higher carloads, including nearly all the major categories. Total carloads averaged 263,884 in May 2018, the most for May since 2015. … May was a good month for intermodal too: U.S. intermodal originations in May 2018 were up 6.6% over last year.
 Click on graph for larger image.
This graph from the Rail Time Indicators report shows U.S. average weekly rail carloads (NSA). Light blue is 2018.
Rail carloads have been weak over the last decade due to the decline in coal shipments.
U.S. railroads originated 1,319,420 carloads in May 2018, up 3.2% (41,078 carloads) over May 2017. Year-over-year carloads have risen by more than 3% for three straight months. Carloads averaged 263,884 in May 2018, the most for May since 2015. Year-to-date carloads through May (5.67 million) were up 1.2%, or 66,071 carloads, over the first five months of last year and were up 8.1% (422,829 carloads) over the first five months of 2016.
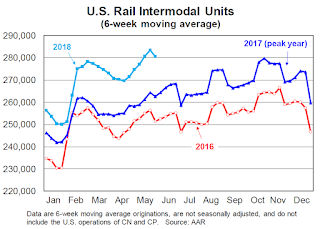
 The second graph is for intermodal traffic (using intermodal or shipping containers):
U.S. railroads originated 1,398,203 intermodal containers and trailers in May 2018, up 6.6%, or 86,010 units, over May 2017. Average weekly intermodal volume in May 2018 was 279,641 units — that’s the second most in history. (Only February 2018, at 279,853, had more.)
Year-to-date intermodal volume through May was a record 5,993,584, up 6.0%, or 336,944 units, over the same period in 2017. Barring a catastrophe, this year will be another record year for U.S. intermodal.
Hotels: Occupancy Rate increased Year-over-Year, On Record Annual Pace
by Calculated Risk on 6/08/2018 08:58:00 AM
From HotelNewsNow.com: STR: US hotel results for week ending 2 June
The U.S. hotel industry reported positive year-over-year results in the three key performance metrics during the week of 27 May through 2 June 2018, according to data from STR.The following graph shows the seasonal pattern for the hotel occupancy rate using the four week average.
In comparison with the week of 28 May through 3 June 2017, the industry recorded the following:
• Occupancy: +0.1% to 64.1%
• Average daily rate (ADR): +2.1% to US$122.58
• Revenue per available room (RevPAR): +2.3% to US$78.61
emphasis added
 Click on graph for larger image.
The red line is for 2018, dash light blue is 2017 (record year due to hurricanes), blue is the median, and black is for 2009 (the worst year probably since the Great Depression for hotels).
The occupancy rate, to date, is slightly ahead of the record year in 2017 (2017 finished strong due to the impact of the hurricanes).
On a seasonal basis, the occupancy rate will now increase as the summer travel season starts.
Data Source: STR, Courtesy of HotelNewsNow.com
Thursday, June 07, 2018
Leading Index for Commercial Real Estate Increases in May
by Calculated Risk on 6/07/2018 04:01:00 PM
Note: This index is possibly a leading indicator for new non-residential Commercial Real Estate (CRE) investment, except manufacturing.
From Dodge Data Analytics: Dodge Momentum Index Inches Up in May
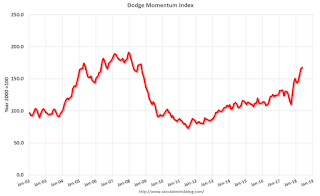
The Dodge Momentum Index eked out a small gain in May, moving 1.8% higher to 167.8 (2000=100) from the revised April reading of 164.9. The Momentum Index is a monthly measure of the first (or initial) report for nonresidential building projects in planning, which have been shown to lead construction spending for nonresidential buildings by a full year. May’s gain was the result of a 4.7% increase by the commercial component of the Momentum Index, while the institutional component fell 2.4%. The Momentum Index has posted solid gains through the first five months of 2018, rising 19% from the same period of 2017 and reaching a level not seen since mid-2008. However, the upturn to this point shows that the current expansion has been more drawn out than what occurred during the previous cyclical expansion. It has been nearly seven years since the Momentum Index hit bottom in July 2011, but it has yet to eclipse its previous peak set in December 2007. At the same time, the recent gains for the Momentum Index suggest that construction spending for nonresidential buildings should remain healthy through the rest of 2018.
emphasis added
 Click on graph for larger image.
This graph shows the Dodge Momentum Index since 2002. The index was at 167.8 in May, up from 164.9 in April.
According to Dodge, this index leads "construction spending for nonresidential buildings by a full year". This suggests further growth in 2018 and into 2019.
Fed's Flow of Funds: Household Net Worth increased in Q1
by Calculated Risk on 6/07/2018 01:25:00 PM
The Federal Reserve released the Q1 2018 Flow of Funds report today: Flow of Funds.
According to the Fed, household net worth increased in Q1 2018 compared to Q4 2017:
The net worth of households and nonprofits rose to $100.8 trillion during the first quarter of 2018. The value of directly and indirectly held corporate equities decreased $0.4 trillion and the value of real estate increased $0.5 trillionThe Fed estimated that the value of household real estate increased to $25.1 trillion in Q1. The value of household real estate is now above the bubble peak in early 2006 - but not adjusted for inflation, and this also includes new construction.
 Click on graph for larger image.
The first graph shows Households and Nonprofit net worth as a percent of GDP. Household net worth, as a percent of GDP, is higher than the peak in 2006 (housing bubble), and above the stock bubble peak.
This includes real estate and financial assets (stocks, bonds, pension reserves, deposits, etc) net of liabilities (mostly mortgages). Note that this does NOT include public debt obligations.
 This graph shows homeowner percent equity since 1952.
 Household percent equity (as measured by the Fed) collapsed when house prices fell sharply in 2007 and 2008.
In Q1 2018, household percent equity (of household real estate) was at 58.7% - up from Q4, and the highest since Q4 2005. This was because of an increase in house prices in Q1 (the Fed uses CoreLogic).
Note: about 30.3% of owner occupied households had no mortgage debt as of April 2010. So the approximately 50+ million households with mortgages have far less than 58.7% equity - and about 2.5 million homeowners still have negative equity.
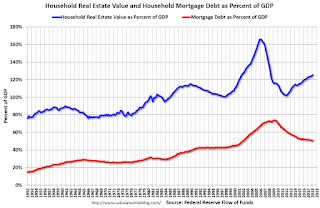
 The third graph shows household real estate assets and mortgage debt as a percent of GDP.
 Mortgage debt increased by $34 billion in Q1.
Mortgage debt has declined by $0.6 trillion from the peak. Studies suggest most of the decline in debt has been because of foreclosures (or short sales), but some of the decline is from homeowners paying down debt (sometimes so they can refinance at better rates).
The value of real estate, as a percent of GDP, was up in Q1, and is above the average of the last 30 years (excluding bubble). However, mortgage debt as a percent of GDP, continues to decline.
Las Vegas Real Estate in May: Sales Down 10% YoY, Inventory down 12%
by Calculated Risk on 6/07/2018 09:49:00 AM
This is a key former distressed market to follow since Las Vegas saw the largest price decline, following the housing bubble, of any of the Case-Shiller composite 20 cities.
The Greater Las Vegas Association of Realtors reported Southern Nevada home prices keep rising, approaching all-time peak; GLVAR housing statistics for May 2018
Prices for existing homes sold in Southern Nevada kept rising through May and are now approaching their all-time peak, according to a report released today by the Greater Las Vegas Association of REALTORS® (GLVAR).1) Overall sales were down 9.5% year-over-year from 4,297 in May 2017 to 3,890 in May 2018.
...
The low supply may also be slowing down local home sales, which have been running roughly even with last year’s sales pace so far this year after increasing in recent years. The total number of existing local homes, condos and townhomes sold during May was 3,890. Compared to one year ago, May sales were down 10.7 percent for homes and down 3.8 percent for condos and townhomes.
...
By the end of May, GLVAR reported 4,118 single-family homes listed for sale without any sort of offer. That’s down 17.2 percent from one year ago. For condos and townhomes, the 799 properties listed without offers in May represented a 26.8 percent increase from one year ago.
...
Meanwhile, the number of so-called distressed sales continues to decline. GLVAR reported that short sales and foreclosures combined accounted for 2.6 percent of all existing local home sales in May, down from 6.8 percent of all sales one year ago.
emphasis added
2) Active inventory (single-family and condos) is down from a year ago, from a total of 5,602 in May 2017 to 4,917 in May 2018. Note: Total inventory was down 12.2% year-over-year - a significant decline - but this was the smallest year-over-year decline in inventory since May 2016.
Watch inventory. Last year, inventory declined 120 homes and condos from April to May, this year inventory was up 311 homes and condos from April to May. The inventory decline might be nearing an end in Las Vegas (and elsewhere).
3) Fewer distressed sales.
Weekly Initial Unemployment Claims decrease to 222,000
by Calculated Risk on 6/07/2018 08:33:00 AM
The DOL reported:
In the week ending June 2, the advance figure for seasonally adjusted initial claims was 222,000, a decrease of 1,000 from the previous week's revised level. The previous week's level was revised up by 2,000 from 221,000 to 223,000. The 4-week moving average was 225,500, an increase of 2,750 from the previous week's revised average. The previous week's average was revised up by 500 from 222,250 to 222,750.The previous week was revised up.
Claims taking procedures in Puerto Rico and in the Virgin Islands have still not returned to normal.
emphasis added
The following graph shows the 4-week moving average of weekly claims since 1971.
 Click on graph for larger image.
The dashed line on the graph is the current 4-week average. The four-week average of weekly unemployment claims increased to 225,500.
This was close to the consensus forecast. The low level of claims suggest few layoffs.
Wednesday, June 06, 2018
"Mortgage Rates Up To 3-Week Highs"
by Calculated Risk on 6/06/2018 04:35:00 PM
From Matthew Graham at Mortgage News Daily: Mortgage Rates Up To 3-Week Highs
Mortgage rates rose today, resuming an upward trend that began last week after political turmoil in Italy began to die down. More simply put, rates had been rising in mid May. Italy's political turmoil caused enough concern about the fate of the Eurozone that investors moved money into bonds, thus helping rates move lower. As risks subsided in Europe, rates have returned to similar levels as those seen in the first half of May. [30YR FIXED - 4.625%-4.75%]Thursday:
emphasis added
• At 8:30 AM ET, The initial weekly unemployment claims report will be released. The consensus is for 225 thousand initial claims, up from 221 thousand the previous week.
• At 12:00 PM, Q1 Flow of Funds Accounts of the United States from the Federal Reserve.
• At 3:00 PM, Consumer Credit from the Federal Reserve. The consensus is for consumer credit to increase $13.5 billion in April.
Mortgage Rates and Ten Year Yield
by Calculated Risk on 6/06/2018 12:20:00 PM
With the ten year yield getting close to 3%, there has been some discussion about whether mortgage rates would hit 5% soon. Based on an historical relationship, 30-year rates should currently be around 4.75%.
As of yesterday, Mortgage News Daily reported: Mortgage Rates Hold Steady
Mortgage rates were little-changed today after rising somewhat quickly over the past 4 business days. … In terms of mortgage rates, we might think of it as an average 30yr fixed rate teetering between 4.625% and 4.75%.The graph shows the relationship between the monthly 10 year Treasury Yield and 30 year mortgage rates from the Freddie Mac survey.
emphasis added
 Currently the 10 year Treasury yield is at 2.97% and 30 year mortgage rates were at 4.56% according to the Freddie Mac survey last week.
To reach 5% (on the Freddie Mac survey), based on the historical relationship, the Ten Year yield would have to increase to about 3.25%.


