 RSS Feed
 by Calculated Risk on 12/31/2017 08:57:00 PM
Sunday, December 31, 2017
Question #4 for 2018: Will the core inflation rate rise in 2018? Will too much inflation be a concern in 2018?
Earlier I posted some questions for next year: Ten Economic Questions for 2018. I'm adding some thoughts, and maybe some predictions for each question.
4) Inflation: The inflation rate has increased a little recently, and some key measures are now close to the the Fed's 2% target. Will core inflation rate rise in 2018? Will too much inflation be a concern in 2018?
First, Tim Duy discusses the Fed's view of inflation: 5 Questions for the Fed in 2018
Inflation is always just a year away in the Fed’s forecast, and this year is no exception to that rule. In general, central bankers maintain that temporary factors such as declining mobile-phone service costs accounted for this year’s inflation shortfall. Hence, policy makers expect core inflation to accelerate to 1.9 percent in 2018 as those factors dissipate. Another inflation disappointment in 2018, however, would increase chatter at the central bank that maybe inflation expectations are declining and need to be bolstered with a more gradual path of tightening.This is a key question: Was inflation soft in 2017 due to transitory factors? Or was soft inflation more structural? I'm not going to discuss the possible structural reasons for low inflation, but there are several possible reasons including demographics, globalization, online buying, wealth inequality and more.
Although there are different measure for inflation (including some private measures) they mostly show inflation a little below the Fed's 2% inflation target, especially Core PCE.
Note: I follow several measures of inflation, median CPI and trimmed-mean CPI from the Cleveland Fed. Core PCE prices (monthly from the BEA) and core CPI (from the BLS).
 Click on graph for larger image.
On a year-over-year basis in November, the median CPI rose 2.3%, the trimmed-mean CPI rose 1.8%, and the CPI less food and energy rose 1.7%. Core PCE is for October and increased 1.4% year-over-year.
On a monthly basis, median CPI was at 2.7% annualized, trimmed-mean CPI was at 2.4% annualized, and core CPI was at 1.4% annualized.
The Fed is projecting core PCE inflation will increase to 1.7% to 1.9% by Q4 2018. However there are risks for higher inflation with the labor market near full employment, and new tax law providing some fiscal stimulus.
I do think there are structural reasons for low inflation, but currently I think PCE core inflation (year-over-year) will increase in 2018 and be closer to 2% by Q4 2018 (up from 1.4%), but too much inflation will still not be a serious concern in 2018.
Here are the Ten Economic Questions for 2018 and a few predictions:
• Question #1 for 2018: How much will the economy grow in 2018?
• Question #2 for 2018: Will job creation slow further in 2018?
• Question #3 for 2018: What will the unemployment rate be in December 2018?
• Question #4 for 2018: Will the core inflation rate rise in 2018? Will too much inflation be a concern in 2018?
• Question #5 for 2018: Will the Fed raise rates in 2018, and if so, by how much?
• Question #6 for 2018: How much will wages increase in 2018?
• Question #7 for 2018: How much will Residential Investment increase?
• Question #8 for 2018: What will happen with house prices in 2018?
• Question #9 for 2018: Will housing inventory increase or decrease in 2018?
• Question #10 for 2018: Will the New Tax Law impact Home Sales, Inventory, and Price Growth in Certain States?
Question #5 for 2018: Will the Fed raise rates in 2018, and if so, by how much?
by Calculated Risk on 12/31/2017 01:41:00 PM
Earlier I posted some questions for next year: Ten Economic Questions for 2018. I'm adding some thoughts, and maybe some predictions for each question.
5) Monetary Policy: The Fed raised rates three times in 2017 and started to reduce their balance sheet. The Fed is forecasting three more rate hikes in 2018. Some analysts think there will be more, from Goldman Sachs:
"We expect the next rate hike to come in March with subjective odds of 75%, and we continue to expect a total of four hikes in 2018."Will the Fed raise rates in 2018, and if so, by how much?
For years, following the great recession, I made fun of those predicting an imminent Fed Funds rate increase. Based on high unemployment and low inflation, I argued it would be a "long time" before the first rate hike. A long time passed ... and in 2015 I finally argued a rate hike was likely.
The Fed raised rates once in 2015, and then once again in December 2016, and then three times in 2017. Currently the target range for the federal funds rate is 1-1/4 to 1‑1/2 percent.
There is a wide range of views on the FOMC. As of December, the FOMC members see the following number of rate hikes in 2018:
| 25bp Rate Hikes in 2018 | FOMC Members |
|---|---|
| One Rate Cut | 1 |
| No Hikes | 1 |
| One | 1 |
| Two | 3 |
| Three | 6 |
| Four | 3 |
| More than Four | 1 |
The main view of the FOMC is three rate hikes in 2018.
As the economy approaches full employment, and with the new tax law adding a little stimulus, it is possible that inflation will pick up a little in 2018 - and, if so, the Fed could hike more than expected.
Tim Duy wrote Thursday: 5 Questions for the Fed in 2018
Is this the year inflation begins to pick up?My current guess is the Fed will hike three times in 2018.
...
Will job growth slow as expected?
...
Are policy makers underestimating the impact of the tax cuts?
...
Should the Fed care about inverting the yield curve?
...
Will financial stability concerns affect rate policy?
...
... as we think about these issues, note that the Fed will be navigating these waters with a new captain as Chair Janet Yellen is succeeded by Governor Jerome Powell. Plus, there will be a new crew in the form of Randy Quarles and, if confirmed, Marvin Goodfriend. Moreover, the more dovish voting members of the Federal Open Market Committee such as December dissenters Kashkari and Charles Evans rotate off in favor of the more hawkish voices such as John Williams and Loretta Mester. On net, the Fed will find more reasons to hike rates than hold steady in 2018, leaving the current three hike projection as the best bet.
As an aside, many new Fed Chairs have faced a crisis early in their term. A few examples, Paul Volcker took office in August 1979, and inflation hit almost 12% (up from 7.9% the year before), and the economy went into recession as Volcker raised rates. Alan Greenspan took office in August 1987, and the stock market crashed almost 34% within a couple months of Greenspan taking office (including over 20% in one day!). And Ben Bernanke took office in February 2006, just as house prices peaked - and he was challenged by the housing bust, great recession and financial crisis.
Hopefully Jerome Powell will see smoother sailing.
Here are the Ten Economic Questions for 2018 and a few predictions:
• Question #1 for 2018: How much will the economy grow in 2018?
• Question #2 for 2018: Will job creation slow further in 2018?
• Question #3 for 2018: What will the unemployment rate be in December 2018?
• Question #4 for 2018: Will the core inflation rate rise in 2018? Will too much inflation be a concern in 2018?
• Question #5 for 2018: Will the Fed raise rates in 2018, and if so, by how much?
• Question #6 for 2018: How much will wages increase in 2018?
• Question #7 for 2018: How much will Residential Investment increase?
• Question #8 for 2018: What will happen with house prices in 2018?
• Question #9 for 2018: Will housing inventory increase or decrease in 2018?
• Question #10 for 2018: Will the New Tax Law impact Home Sales, Inventory, and Price Growth in Certain States?
Question #6 for 2018: How much will wages increase in 2018?
by Calculated Risk on 12/31/2017 08:11:00 AM
Earlier I posted some questions for next year: Ten Economic Questions for 2018. I'm adding some thoughts, and maybe some predictions for each question.
6) Real Wage Growth: Wage growth picked up in 2016 (up 2.9%), but slowed in 2017 (up 2.5% year-over-year in November). How much will wages increase in 2018?
The most followed wage indicator is the “Average Hourly Earnings” from the Current Employment Statistics (CES) (aka "Establishment") monthly employment report.
 Click on graph for larger image.
The blue line shows the nominal year-over-year change in "Average Hourly Earnings" for all private employees. Nominal wage growth had been running close to 2% since 2010, and picked up a little in 2015, and more in 2016.
However nominal wage growth was a little soft in 2017.
The red line is real wage growth (adjusted using headline CPI). Real wages increased during the crisis because CPI declined sharply. CPI was very low in 2015 - due to the decline in oil prices - so real wage growth picked up in 2015.
Real wage growth trended down in 2017.
There are two quarterly sources for earnings data: 1) “Hourly Compensation,” from the BLS’s Productivity and Costs; and 2) the Employment Cost Index which includes wage/salary and benefit compensation. All three data series are different, and most of the focus recently has been the CES series (used in the graph above).
![]() The second graph is from the Atlanta Fed Wage Tracker. This measure is the year-over-year change in nominal wages for individuals.
The second graph is from the Atlanta Fed Wage Tracker. This measure is the year-over-year change in nominal wages for individuals.
By following wage changes for individuals, this removes the demographic composition effects (older workers who are retiring tend to be higher paid, and younger workers just entering the workforce tend to be lower paid).
The Atlanta Fed Wage tracker showed nominal wage growth close to 4% at the end of 2016, but only 3.2% in November 2017.
As the labor market continues to tighten, we should see more wage pressure as companies have to compete for employees. I expect to see some further increases in both the Average hourly earning from the CES, and in the Atlanta Fed Wage Tracker. Perhaps nominal wages will increase close to 3% in 2018 according to the CES.
Here are the Ten Economic Questions for 2018 and a few predictions:
• Question #1 for 2018: How much will the economy grow in 2018?
• Question #2 for 2018: Will job creation slow further in 2018?
• Question #3 for 2018: What will the unemployment rate be in December 2018?
• Question #4 for 2018: Will the core inflation rate rise in 2018? Will too much inflation be a concern in 2018?
• Question #5 for 2018: Will the Fed raise rates in 2018, and if so, by how much?
• Question #6 for 2018: How much will wages increase in 2018?
• Question #7 for 2018: How much will Residential Investment increase?
• Question #8 for 2018: What will happen with house prices in 2018?
• Question #9 for 2018: Will housing inventory increase or decrease in 2018?
• Question #10 for 2018: Will the New Tax Law impact Home Sales, Inventory, and Price Growth in Certain States?
Saturday, December 30, 2017
Question #7 for 2018: How much will Residential Investment increase?
by Calculated Risk on 12/30/2017 05:20:00 PM
Earlier I posted some questions for next year: Ten Economic Questions for 2018. I'm adding some thoughts, and maybe some predictions for each question.
7) Residential Investment: Residential investment (RI) was sluggish in 2017, although new home sales were up solidly. Note: RI is mostly investment in new single family structures, multifamily structures, home improvement and commissions on existing home sales. How much will RI increase in 2018? How about housing starts and new home sales in 2018?
First a graph of RI as a percent of Gross Domestic Product (GDP) through Q3 2017:
 Click on graph for larger image.
Usually residential investment is a strong contributor to GDP growth and employment in the early stages of a recovery, but not this time - and that weakness was a key reason why the start of the recovery was sluggish.
Residential investment finally turned positive during 2011 and made a solid positive contribution to GDP every year since then.
RI as a percent of GDP is still low - close to the lows of previous recessions - and was sluggish in 2017.
 The second graph shows total and single family housing starts through November 2017.
Housing starts are on pace to increase close to 3% in 2017. The slower growth in 2017 was due to the weakness in the multi-family sector.
Even after the significant increase over the last several years, the approximately 1.21 million housing starts in 2017 will still be the 17th lowest on an annual basis since the Census Bureau started tracking starts in 1959 (the seven lowest years were 2008 through 2014). The other lower years were the bottoms of previous recessions.
 The third graph shows New Home Sales since 1963 through November 2017. The dashed line is the November sales rate.
New home sales in 2017 were up about 9% compared to 2016 at close to 612 thousand.
Here is a table showing housing starts and new home sales since 2005. No one should expect an increase to 2005 levels, however demographics and household formation suggest starts will return to close to the 1.5 million per year average from 1959 through 2000. That would suggest starts would increase close to 25% over the next few years from the 2017 level.
| Housing Starts and New Home Sales (000s) | ||||
|---|---|---|---|---|
| Housing Starts | Change | New Home Sales | Change | |
| 2005 | 2068 | --- | 1,283 | --- |
| 2006 | 1801 | -12.9% | 1,051 | -18.1% |
| 2007 | 1355 | -24.8% | 776 | -26.2% |
| 2008 | 906 | -33.2% | 485 | -37.5% |
| 2009 | 554 | -38.8% | 375 | -22.7% |
| 2010 | 587 | 5.9% | 323 | -13.9% |
| 2011 | 609 | 3.7% | 306 | -5.3% |
| 2012 | 781 | 28.2% | 368 | 20.3% |
| 2013 | 925 | 18.5% | 429 | 16.6% |
| 2014 | 1003 | 8.5% | 437 | 1.9% |
| 2015 | 1112 | 10.9% | 501 | 14.7% |
| 2016 | 1174 | 5.6% | 561 | 12.0% |
| 20171 | 1210 | 3.1% | 612 | 9.1% |
| 12017 estimated | ||||
Most analysts are looking for starts to increase to around 1.25 to 1.3 million in 2018, and for new home sales of around 650 thousand.
I also think there will be further growth in 2018. My guess is starts will increase to just over 1.25 million in 2018 and new home sales will be just over 650 thousand.
Here are the Ten Economic Questions for 2018 and a few predictions:
• Question #1 for 2018: How much will the economy grow in 2018?
• Question #2 for 2018: Will job creation slow further in 2018?
• Question #3 for 2018: What will the unemployment rate be in December 2018?
• Question #4 for 2018: Will the core inflation rate rise in 2018? Will too much inflation be a concern in 2018?
• Question #5 for 2018: Will the Fed raise rates in 2018, and if so, by how much?
• Question #6 for 2018: How much will wages increase in 2018?
• Question #7 for 2018: How much will Residential Investment increase?
• Question #8 for 2018: What will happen with house prices in 2018?
• Question #9 for 2018: Will housing inventory increase or decrease in 2018?
• Question #10 for 2018: Will the New Tax Law impact Home Sales, Inventory, and Price Growth in Certain States?
December 2017: Unofficial Problem Bank list declines to 103 Institutions, Q4 2017 Transition Matrix
by Calculated Risk on 12/30/2017 01:59:00 PM
Note: Surferdude808 compiles an unofficial list of Problem Banks compiled only from public sources.
Here is the unofficial problem bank list for December 2017.
Here are the monthly changes and a few comments from surferdude808:
Update on the Unofficial Problem Bank List for December 2017. During the month, the list fell by five institutions to 103 after seven removals and two additions. Assets declined to $20.9 billion from $25.5 billion a month earlier. A year ago, the list held 169 institutions with assets of $45 billion.
This month, actions were terminated against The Brand Banking Company, Lawrenceville, GA ($2.3 billion); Los Alamos National Bank, Los Alamos, NM ($1.3 billion); PBI Bank, Louisville, KY ($961 million Ticker: PBIB); Brickyard Bank, Lincolnwood, IL ($106 million); American Metro Bank, Chicago, IL ($63 million); State Bank of Burnettsville, Burnettsville, IN ($39 million); and Eagle Community Bank, Maple Grove, MN ($23 million).
The two additions this month were South LaFourche Bank & Trust Company, Larose, LA ($157 million) and Bank of Hazlehurst, Hazlehurst, GA ($124 million). Concentrations of lending to commodities sectors are contributing factors in these banks problem status – oil & gas lending for South LaFourche Bank & Trust Company and agriculture lending for the Bank of Hazlehurst.
Two weeks ago, Washington Federal Bank for Savings, Chicago, IL ($166 million) became the eight failure of 2017; however, its failure did not cause a removal from the Unofficial Problem Bank List as the thrift had not been identified as a problem bank by the Office of the Comptroller of the Currency (OCC), its primary federal regulator. The FDIC estimated the thrift’s resolution cost at an extremely high 36.4 percent of the thrift’s assets. It seems likely that a long running fraud happened at the thrift. The lack of fraud identification by the OCC and the high resolution cost would lead some observers to say there was negligent oversight by the primary regulator. The untimely failure left $11.6 million of uninsured deposits at risk of loss. Moreover, the thrift’s CEO & president committed suicide about two weeks before the failure. Perhaps better and timelier oversight would have limited the losses. See this media account for further details: Failed Bridegport bank sold, millions in uninsured deposits at risk
With it being the end of the third quarter, we bring an updated transition matrix to detail how banks are moving off the Unofficial Problem Bank List. Since the Unofficial Problem Bank List was first published on August 7, 2009 with 389 institutions, a total of 1,725 institutions have appeared on a weekly or monthly list at some point. Only 6.0 percent of the banks that have appeared on a list remain today. In all, there have been 1,622 institutions that have transitioned through the list. Departure methods include 946 action terminations, 406 failures, 253 mergers, and 17 voluntary liquidations. Of the 389 institutions on the first published list, only 9 or 2.3 percent still remain in a designated troubled status more than eight years later. The 406 failures represent 23.5 percent of the 1,725 institutions that have made an appearance on the list. This failure rate is well above the 10-12 percent rate frequently cited in media reports on the failure rate of banks on the FDIC's official list.
| Unofficial Problem Bank List | |||
|---|---|---|---|
| Change Summary | |||
| Number of Institutions | Assets ($Thousands) | ||
| Start (8/7/2009) | 389 | 276,313,429 | |
| Subtractions | |||
| Action Terminated | 178 | (65,500,762) | |
| Unassisted Merger | 40 | (9,818,439) | |
| Voluntary Liquidation | 4 | (10,584,114) | |
| Failures | 158 | (186,397,337) | |
| Asset Change | (256,902) | ||
| Still on List at 12/31/2017 | 9 | 3,755,875 | |
| Additions after 8/7/2009 | 94 | 17,175,536 | |
| End (12/31/2017) | 103 | 20,931,411 | |
| Intraperiod Removals1 | |||
| Action Terminated | 768 | 318,084,198 | |
| Unassisted Merger | 213 | 81,629,084 | |
| Voluntary Liquidation | 13 | 2,515,855 | |
| Failures | 248 | 125,152,210 | |
| Total | 1,242 | 527,381,347 | |
| 1Institution not on 8/7/2009 or 12/31/2017 list but appeared on a weekly list. | |||
Schedule for Week of December 31st
by Calculated Risk on 12/30/2017 08:09:00 AM
Happy New Year!
The key report this week is the December employment report on Friday.
Other key indicators include the December ISM manufacturing and non-manufacturing indexes, the November trade deficit, and December auto sales.
Also the Q4 quarterly Reis surveys for office and malls will be released this week.
All US markets will be closed in observance of the New Year's Day Holiday.
10:00 AM: Corelogic House Price index for November.
7:00 AM ET: The Mortgage Bankers Association (MBA) will release the results for the mortgage purchase applications index.
Early: Reis Q4 2017 Office Survey of rents and vacancy rates.
 10:00 AM: ISM Manufacturing Index for December. The consensus is for the ISM to be at 58.0, down from 58.2 in November.
Here is a long term graph of the ISM manufacturing index.
The ISM manufacturing index indicated expansion in October. The PMI was at 58.2% in November, the employment index was at 59.7%, and the new orders index was at 64.0%.
10:00 AM: Construction Spending for November. The consensus is for a 0.6% increase in construction spending.
 All day: Light vehicle sales for December. The consensus is for light vehicle sales to be 17.5 million SAAR in December, up from 17.4 million in November (Seasonally Adjusted Annual Rate).
This graph shows light vehicle sales since the BEA started keeping data in 1967. The dashed line is the November sales rate.
2:00 PM: FOMC Minutes, Meeting of December 12 - 13, 2017
8:15 AM: The ADP Employment Report for December. This report is for private payrolls only (no government). The consensus is for 185,000 payroll jobs added in December, down from 190,000 added in November.
8:30 AM: The initial weekly unemployment claims report will be released. The consensus is for 240 thousand initial claims, down from 245 thousand the previous week.
Early: Reis Q4 2017 Mall Survey of rents and vacancy rates.
8:30 AM: Employment Report for December. The consensus is for an increase of 190,000 non-farm payroll jobs added in December, down from the 228,000 non-farm payroll jobs added in November.
 The consensus is for the unemployment rate to be unchanged at 4.1%.
This graph shows the year-over-year change in total non-farm employment since 1968.
In November the year-over-year change was 2.07 million jobs.
A key will be the change in wages.
 8:30 AM: Trade Balance report for November from the Census Bureau.
 This graph shows the U.S. trade deficit, with and without petroleum, through October. The blue line is the total deficit, and the black line is the petroleum deficit, and the red line is the trade deficit ex-petroleum products.
The consensus is for the U.S. trade deficit to be at $48.3 billion in November from $48.7 billion in October.
10:00 AM: the ISM non-Manufacturing Index for December. The consensus is for index to increase to 57.6 from 57.4 in November.
Friday, December 29, 2017
Fannie Mae: Mortgage Serious Delinquency rate increased in November due to Hurricanes
by Calculated Risk on 12/29/2017 04:30:00 PM
Fannie Mae reported that the Single-Family Serious Delinquency rate increased to 1.12% in November, up from 1.01% in October. The serious delinquency rate is down from 1.23% in November 2016.
These are mortgage loans that are "three monthly payments or more past due or in foreclosure".
The Fannie Mae serious delinquency rate peaked in February 2010 at 5.59%.
 Click on graph for larger image
By vintage, for loans made in 2004 or earlier (4% of portfolio), 3.05% are seriously delinquent. For loans made in 2005 through 2008 (7% of portfolio), 6.26% are seriously delinquent, For recent loans, originated in 2009 through 2017 (89% of portfolio), only 0.42% are seriously delinquent. So Fannie is still working through poor performing loans from the bubble years.
This increase in the delinquency rate was due to the hurricanes - and we might see a further increase over the next month (These are serious delinquencies, so it takes three months late to be counted).
After the hurricane bump, maybe the rate will decline another 0.5 percentage points or so to a cycle bottom, but this is pretty close to normal.
Note: Freddie Mac reported earlier.
Question #8 for 2018: What will happen with house prices in 2018?
by Calculated Risk on 12/29/2017 03:58:00 PM
Earlier I posted some questions for next year: Ten Economic Questions for 2018. I'm adding some thoughts, and maybe some predictions for each question.
8) House Prices: It appears house prices - as measured by the national repeat sales index (Case-Shiller, CoreLogic) - will be up over 6% in 2017. What will happen with house prices in 2018?
The following graph shows the year-over-year change through October 2017, in the seasonally adjusted Case-Shiller Composite 10, Composite 20 and National indices (the Composite 20 was started in January 2000).
 Click on graph for larger image.
The Composite 10 SA was up 6.0% compared to October 2016, the Composite 20 SA was up 6.4% and the National index SA was up 6.2% year-over-year. Other house price indexes have indicated similar gains (see table below).
Although I mostly use Case-Shiller, I also follow several other price indexes. The following table shows the year-over-year change for several house prices indexes.
| Year-over-year Change for Various House Price Indexes | ||
|---|---|---|
| Index | Through | Increase |
| Case-Shiller Comp 20 | Oct-17 | 6.4% |
| Case-Shiller National | Oct-17 | 6.2% |
| CoreLogic | Oct-17 | 7.0% |
| Black Knight | Oct-17 | 6.5% |
| FHFA Purchase Only | Oct-17 | 6.2% |
Most analysts are forecasting prices will increase in the 3% to 5% range in 2017.
Inventories will probably remain low in 2018, although I expect inventories to increase on a year-over-year basis by December of 2018. Low inventories, and a decent economy suggests further price increases in 2018.
Perhaps higher mortgage rates will slow price appreciation. If we look back at the "taper tantrum" in 2013, price appreciation slowed somewhat over the next year - but that was from a high level. In June 2013, the Case-Shiller National index was up 9.3% year-over-year. By June 2014, the index was up 6.3% year-over-year.
If inventory increases year-over-year as I expect by December 2018, it seems likely that price appreciation will slow to the low-to-mid single digits.
Here are the Ten Economic Questions for 2018 and a few predictions:
• Question #1 for 2018: How much will the economy grow in 2018?
• Question #2 for 2018: Will job creation slow further in 2018?
• Question #3 for 2018: What will the unemployment rate be in December 2018?
• Question #4 for 2018: Will the core inflation rate rise in 2018? Will too much inflation be a concern in 2018?
• Question #5 for 2018: Will the Fed raise rates in 2018, and if so, by how much?
• Question #6 for 2018: How much will wages increase in 2018?
• Question #7 for 2018: How much will Residential Investment increase?
• Question #8 for 2018: What will happen with house prices in 2018?
• Question #9 for 2018: Will housing inventory increase or decrease in 2018?
• Question #10 for 2018: Will the New Tax Law impact Home Sales, Inventory, and Price Growth in Certain States?
Question #9 for 2018: Will housing inventory increase or decrease in 2018?
by Calculated Risk on 12/29/2017 10:01:00 AM
Earlier I posted some questions for next year: Ten Economic Questions for 2018. I'm adding some thoughts, and maybe some predictions for each question.
9) Housing Inventory: Housing inventory declined in 2015, 2016 and 2017. Will inventory increase or decrease in 2018?
Tracking housing inventory is very helpful in understanding the housing market. The plunge in inventory in 2011 helped me call the bottom for house prices in early 2012 (The Housing Bottom is Here). And the increase in inventory in late 2005 (see first graph below) helped me call the top for house prices in 2006.
This graph shows nationwide inventory for existing homes through November 2017.
 Click on graph for larger image.
According to the NAR, inventory decreased to 1.67 million in November from 1.80 million in October.
Inventory has steadily been decreasing over the last few years.
This was the lowest level for the month of November since 2000.
Inventory is not seasonally adjusted, and usually inventory decreases from the seasonal high in mid-summer to the seasonal lows in December and January as sellers take their homes off the market for the holidays.
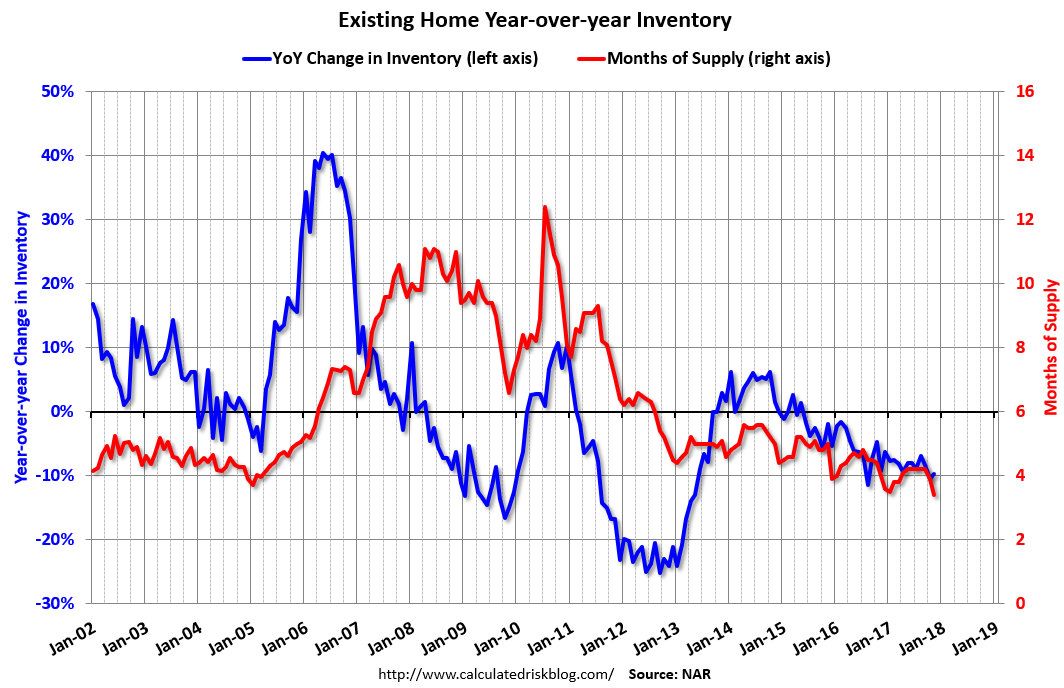 The second graph shows the year-over-year (YoY) change in reported existing home inventory and months-of-supply. Note: Months-of-supply is based on the seasonally adjusted sales and not seasonally adjusted inventory.
Inventory decreased 9.7% year-over-year in November compared to November 2016. Months of supply was at 3.4 months in November.
Note that the blue line (year-over-year change) turned slightly positive in 2013, but has been negative since mid-2015.
Two of the key reasons inventory is low: 1) A large number of single family home and condos were converted to rental units. In 2015, housing economist Tom Lawler estimated there were 17.5 million renter occupied single family homes in the U.S., up from 10.7 million in 2000. Many of these houses were purchased by investors, and rents have increased substantially, and the investors are not selling (even though prices have increased too). Most of these rental conversions were at the lower end, and that is limiting the supply for first time buyers. 2) Baby boomers are aging in place (people tend to downsize when they are 75 or 80, in another 10 to 20 years for the boomers). Instead we have seen a surge in home improvement spending, and this is also limiting supply.
The recent change in the tax law might lead to more inventory in certain areas, and I'll be tracking that over the course of the year.
I was wrong on inventory last year (and the previous year), but right now my guess is active inventory will increase in 2018 (inventory will decline seasonally in December and January, but I expect to see inventory up again year-over-year in December 2018). My reasons for expecting more inventory are 1) inventory is historically low (lowest for November since 2000), 2) and the recent changes to the tax law.
If correct, this will keep house price increases down in 2018 (probably lower than the 6% or so gains in 2017).
Here are the Ten Economic Questions for 2018 and a few predictions:
• Question #1 for 2018: How much will the economy grow in 2018?
• Question #2 for 2018: Will job creation slow further in 2018?
• Question #3 for 2018: What will the unemployment rate be in December 2018?
• Question #4 for 2018: Will the core inflation rate rise in 2018? Will too much inflation be a concern in 2018?
• Question #5 for 2018: Will the Fed raise rates in 2018, and if so, by how much?
• Question #6 for 2018: How much will wages increase in 2018?
• Question #7 for 2018: How much will Residential Investment increase?
• Question #8 for 2018: What will happen with house prices in 2018?
• Question #9 for 2018: Will housing inventory increase or decrease in 2018?
• Question #10 for 2018: Will the New Tax Law impact Home Sales, Inventory, and Price Growth in Certain States?
Chicago PMI "Rises" in December "to Six-and-a-Half Year High"
by Calculated Risk on 12/29/2017 09:33:00 AM
From the Chicago PMI: December Chicago Business Barometer Rises to 67.6
The MNI Chicago Business Barometer rose to 67.6 in December, up from 63.9 in November, closing the year at the highest level since March 2011.This was well above the consensus forecast of 61.8, and a strong reading.
On a calendar quarter basis, the Barometer rose to 65.9 in Q4 from 61.0 in Q3, the best quarterly performance since Q1 2011, only the second time in the last decade there have been three consecutive above-60 readings in the Oct-Dec period.
...
“Sentiment among businesses started 2017 in good shape and only impressed more as the year progressed. December’s result secured the MNI Chicago Business Barometer’s first full year of expansion since 2014 and with New Orders ending the quarter in fine shape there is every chance this form could be carried over into 2018,” said Jamie Satchi, Economist at MNI Indicators.
emphasis added


