 RSS Feed
 by Calculated Risk on 10/29/2017 09:20:00 PM
Sunday, October 29, 2017
Sunday Night Futures
Weekend:
• Schedule for Week of Oct 29, 2017
Monday:
• At 8:30 AM ET, Personal Income and Outlays for September. The consensus is for a 0.4% increase in personal income, and for a 0.9% increase in personal spending. And for the Core PCE price index to increase 0.1%.
• At 10:30 AM, Dallas Fed Survey of Manufacturing Activity for October. This is the last of the regional surveys for October.
From CNBC: Pre-Market Data and Bloomberg futures: S&P 500 future are down 3 and DOW futures are down 10 (fair value).
Oil prices were up over the last week with WTI futures at $53.98 per barrel and Brent at $60.54 per barrel. A year ago, WTI was at $47, and Brent was at $46 - so oil prices are up solidly year-over-year.
Here is a graph from Gasbuddy.com for nationwide gasoline prices. Nationally prices are at $2.45 per gallon. A year ago prices were at $2.20 per gallon - so gasoline prices are up 25 cents per gallon year-over-year.
October 2017: Unofficial Problem Bank list declines to 111 Institutions
by Calculated Risk on 10/29/2017 08:14:00 AM
Note: Surferdude808 compiles an unofficial list of Problem Banks compiled only from public sources.
Here is the unofficial problem bank list for October 2017.
Here are the monthly changes and a few comments from surferdude808:
Update on the Unofficial Problem Bank List for October 2017. The list declined by eight to 111 banks. Aggregate assets dropped by $1.1 billion to $26.6 billion. A year ago, the list held 173 institutions with assets of $54.9 billion.
Actions were terminated against First National Bank of Griffin, Griffin, GA ($260 million); Citizens Commerce National Bank, Versailles, KY ($223 million); First National Bank of Brookfield, Brookfield, IL ($175 million); Delanco Federal Savings Bank, Delanco, NJ ($126 million); Americana Community Bank, Sleepy Eye, MN ($110 million); Gunnison Valley Bank, Gunnison, UT ($81 million); and Citizens First State Bank of Walnut, Walnut, IL ($45 million).
The Farmers and Merchants State Bank of Argonia, Argonia, KS ($34 million) failed on October 13, 2017. This is the seventh bank to fail this year and the 528th bank to fail in the wake of the Great Recession. Of the 528 failures, ten have been in Kansas.
Saturday, October 28, 2017
Schedule for Week of Oct 29, 2017
by Calculated Risk on 10/28/2017 08:09:00 AM
The key report this week is the October employment report on Friday.
Other key indicators include Case-Shiller house prices for August, the October ISM manufacturing and non-manufacturing indexes, October auto sales and the September Trade deficit.
The FOMC meets on Tuesday and Wednesday, and no change to policy is expected at this meeting.
Also, the announcement of the new (or hopefully reappointed) Fed Chair is expected this week.
8:30 AM: Personal Income and Outlays for September. The consensus is for a 0.4% increase in personal income, and for a 0.9% increase in personal spending. And for the Core PCE price index to increase 0.1%.
10:30 AM: Dallas Fed Survey of Manufacturing Activity for October. This is the last of the regional surveys for October.
 9:00 AM ET: S&P/Case-Shiller House Price Index for August.
This graph shows the nominal seasonally adjusted National Index, Composite 10 and Composite 20 indexes through the July 2017 report (the Composite 20 was started in January 2000).
The consensus is for a 6.0% year-over-year increase in the Comp 20 index for August.
9:45 AM: Chicago Purchasing Managers Index for October. The consensus is for a reading of 62.0, down from 65.2 in September.
10:00 AM: the Q3 Housing Vacancies and Homeownership from the Census Bureau.
7:00 AM ET: The Mortgage Bankers Association (MBA) will release the results for the mortgage purchase applications index.
8:15 AM: The ADP Employment Report for October. This report is for private payrolls only (no government). The consensus is for 210,000 payroll jobs added in October, up from 135,000 added in September.
 10:00 AM: ISM Manufacturing Index for October. The consensus is for the ISM to be at 59.5, down from 60.8 in September.
Here is a long term graph of the ISM manufacturing index.
The ISM manufacturing index indicated expansion in September. The PMI was at 60.8% in September, the employment index was at 60.3%, and the new orders index was at 64.6%.
10:00 AM: Construction Spending for September. The consensus is for a 0.1% increase in construction spending.
 All day: Light vehicle sales for October. The consensus is for light vehicle sales to be 17.5 million SAAR in October, down from 18.6 million in September (Seasonally Adjusted Annual Rate).
This graph shows light vehicle sales since the BEA started keeping data in 1967. The dashed line is the September sales rate.
2:00 PM: FOMC Meeting Announcement. The FOMC is expected to announce no change to policy at this meeting.
8:30 AM: The initial weekly unemployment claims report will be released. The consensus is for 235 thousand initial claims, up from 233 thousand the previous week.
8:30 AM: Employment Report for October. The consensus is for an increase of 323,000 non-farm payroll jobs added in October, up from the 33,000 non-farm payroll jobs lost in September.
 The consensus is for the unemployment rate to increase to 4.3%.
This graph shows the year-over-year change in total non-farm employment since 1968.
In September the year-over-year change was 1.78 million jobs. This was the smallest year-over-year gain since 2012.
A key will be the change in wages.
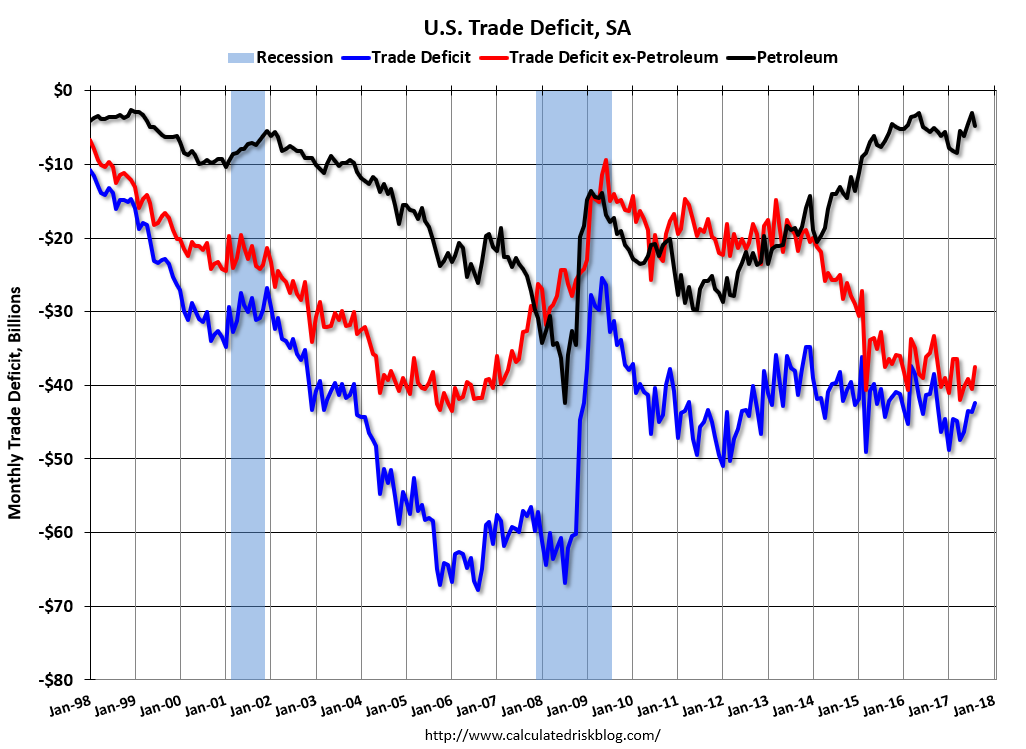 8:30 AM: Trade Balance report for September from the Census Bureau.
 This graph shows the U.S. trade deficit, with and without petroleum, through August. The blue line is the total deficit, and the black line is the petroleum deficit, and the red line is the trade deficit ex-petroleum products.
The consensus is for the U.S. trade deficit to be at $43.4 billion in September from $42.4 billion in August.
10:00 AM: the ISM non-Manufacturing Index for October. The consensus is for index to decrease to 58.7 from 59.8 in September.
Friday, October 27, 2017
Oil Rigs "Rig counts rebounded modestly this week"
by Calculated Risk on 10/27/2017 06:45:00 PM
CR Note: Oil prices increased today with WTI at $53.90 per barrel, and Brent at $60.55. If those prices hold, we might see a pick up in the rig count going forward.
A few comments from Steven Kopits of Princeton Energy Advisors LLC on Oct 27, 2017:
• After last week’s bloodbath, rig counts rebounded modestly this week
• Total US oil rigs were up 1 to 737
• Horizontal oil rigs were up 2 to 630
...
• The gap between Brent and WTI continues to widen, today standing at $6.60 / barrel, and both WTI and Brent were commensurately strong, with WTI adding $1.40 just today.
• I think we’re likely reaching a local peak for WTI, so I expect we’ll see some retrenchment in the next few weeks somewhere, but the numbers speak to substantially stronger global oil demand than analysts currently think.
 Click on graph for larger image.
CR note: This graph shows the US horizontal rig count by basin.
Graph and comments Courtesy of Steven Kopits of Princeton Energy Advisors LLC.
Five Economic Questions I'm Frequently Asked
by Calculated Risk on 10/27/2017 03:55:00 PM
Here are five questions that people ask me all the time.
1. Are house prices in a bubble? Short answer: No.
2. Is a recession imminent (within the next 12 months)? No.
3. Is the stock market a bubble? I rarely comment on the stock market directly ...
4. Can investors use macro analysis? Yes, but not frequently.
5. Will Mr. Trump have a negative impact on the economy? Maybe.
I'll post some thoughts on each of these topics over the next couple of weeks.
Hotel Occupancy Rate increases YoY
by Calculated Risk on 10/27/2017 02:37:00 PM
From HotelNewsNow.com: STR: US hotel results for week ending 21 October
The U.S. hotel industry reported positive year-over-year results in the three key performance metrics during the week of 15-21 October 2017, according to data from STR.The following graph shows the seasonal pattern for the hotel occupancy rate using the four week average.
In comparison with the week of 16-22 October 2016, the industry recorded the following:
• Occupancy: +0.9% to 72.8%
• Average daily rate (ADR): +1.7% to US$131.58
• Revenue per available room (RevPAR): +2.6% to US$95.82
Among the Top 25 Markets, Houston, Texas, reported the largest year-over-year increases in occupancy (+23.7% to 86.6%) and RevPAR (+25.9% to US$103.34). Post-Hurricane Harvey demand continues to drive performance levels in the market.
emphasis added
 The red line is for 2017, dash light blue is 2016, dashed orange is 2015 (best year on record), blue is the median, and black is for 2009 (the worst year since the Great Depression for hotels).
Currently the occupancy rate, to date, is ahead of last year, and tied with the record year in 2015. The hurricanes will probably push the annual occupancy rate to a new record in 2017.
Data Source: STR, Courtesy of HotelNewsNow.com
Q3 GDP: Investment
by Calculated Risk on 10/27/2017 11:11:00 AM
The first graph below shows the contribution to GDP from residential investment, equipment and software, and nonresidential structures (3 quarter trailing average). This is important to follow because residential investment tends to lead the economy, equipment and software is generally coincident, and nonresidential structure investment trails the economy.
In the graph, red is residential, green is equipment and software, and blue is investment in non-residential structures. So the usual pattern - both into and out of recessions is - red, green, blue.
The dashed gray line is the contribution from the change in private inventories.
 Click on graph for larger image.
Residential investment (RI) decreased at a 6.0% annual rate in Q3. Equipment investment increased at a 8.6% annual rate, and investment in non-residential structures decreased at a 5.2% annual rate.
On a 3 quarter trailing average basis, RI (red) is slightly negative, equipment (green), and nonresidential structures (blue) are positive.
The slight dip in RI isn't concerning - as long as it doesn't continue!
I'll post more on the components of non-residential investment once the supplemental data is released.
 The second graph shows residential investment as a percent of GDP.
Residential Investment as a percent of GDP decreased in Q3, but has generally been increasing. RI as a percent of GDP is only just above the bottom of the previous recessions - and I expect RI to continue to increase for the next couple of years.
I'll break down Residential Investment into components after the GDP details are released.
Note: Residential investment (RI) includes new single family structures, multifamily structures, home improvement, broker's commissions, and a few minor categories.
 The third graph shows non-residential investment in structures, equipment and "intellectual property products". Investment in equipment - as a percent of GDP - picked up.
Investment in residential structures declined slightly in Q3.
BEA: Real GDP increased at 3.0% Annualized Rate in Q3
by Calculated Risk on 10/27/2017 08:33:00 AM
From the BEA: Gross Domestic Product: Third Quarter 2017 (Advance Estimate)
Real gross domestic product (GDP) increased at an annual rate of 3.0 percent in the third quarter of 2017, according to the "advance" estimate released by the Bureau of Economic Analysis. In the second quarter, real GDP increased 3.1 percent.The advance Q3 GDP report, with 3.0% annualized growth, was slightly above expectations.
...
The increase in real GDP in the third quarter reflected positive contributions from personal consumption expenditures (PCE), private inventory investment, nonresidential fixed investment, exports, and federal government spending. These increases were partly offset by negative contributions from residential fixed investment and state and local government spending. Imports, which are a subtraction in the calculation of GDP, decreased .
The deceleration in real GDP growth in the third quarter primarily reflected decelerations in PCE, in nonresidential fixed investment, and in exports that were partly offset by an acceleration in private inventory investment and a downturn in imports.
emphasis added
Personal consumption expenditures (PCE) increased at 2.4% annualized rate in Q3, down from 3.3% in Q2. Residential investment (RI) decreased at a 6.0% pace. Equipment investment increased at a 8.6% annualized rate, and investment in non-residential structures decreased at a 5.2% pace.
I'll have more later ...
Thursday, October 26, 2017
Friday: GDP
by Calculated Risk on 10/26/2017 05:44:00 PM
From the Altanta Fed: GDPNow (as of Oct 26th)
The final GDPNow model forecast for real GDP growth (seasonally adjusted annual rate) in the third quarter of 2017 is 2.5 percent on October 26, down from 2.7 percent on October 25. The forecast of the contribution of inventory investment to third-quarter GDP growth declined from 1.01 percentage points to 0.80 percentage points after this morning's Advance Economic Indicators report from the U.S. Census Bureau.From the NY Fed Nowcasting Report (as of Oct 20th)
emphasis added
The New York Fed Staff Nowcast stands at 1.5% for 2017:Q3 and 2.6% for 2017:Q4.From Merrill Lynch: (as of Oct 26th)
the decline in inventories more than offset, lowering our 3Q GDP tracking estimate back down to 3.0% from 3.2%.Friday:
• At 8:30 AM ET, Gross Domestic Product, 3rd quarter 2017 (Advance estimate). The consensus is that real GDP increased 2.5% annualized in Q3.
• At 10:00 AM, University of Michigan's Consumer sentiment index (final for October). The consensus is for a reading of 101.1, unchanged from the preliminary reading 101.1.
Goldman: "On Course for a December Hike"
by Calculated Risk on 10/26/2017 01:46:00 PM
CR Note: The FOMC meets next week, and no change to policy is expected. However it appears another rate hike is coming at the December meeting.
A few brief excerpts from a piece by Goldman Sachs economist Spencer Hill: On Course for a December Hike
We expect the FOMC to keep policy unchanged next week and see few substantive changes to the statement.
We expect a slightly more upbeat tone on growth that acknowledges the disruptions from the hurricanes but characterizes them as temporary or in the past tense ... Despite the disappointing September CPI report, we do not expect a downgrade of the inflation assessment or outlook, reflecting broadly stable year-over-year inflation and the further decline in the unemployment rate.
We expect the statement to acknowledge that balance sheet normalization was “initiated” in October, but we do not expect further discussion of the topic, given the lack of adverse market reaction and the passive nature of the run-off. We also look for the characterization of current policy (“accommodative”) to remain unchanged.


