 RSS Feed
 by Calculated Risk on 10/12/2017 08:34:00 AM
Thursday, October 12, 2017
Weekly Initial Unemployment Claims decrease to 243,000
The DOL reported:
In the week ending October 7, the advance figure for seasonally adjusted initial claims was 243,000, a decrease of 15,000 from the previous week's revised level. The previous week's level was revised down by 2,000 from 260,000 to 258,000. The 4-week moving average was 257,500, a decrease of 9,500 from the previous week's revised average. The previous week's average was revised down by 1,250 from 268,250 to 267,000.The previous week was revised down.
Hurricanes Harvey, Irma, and Maria impacted this week's claims.
emphasis added
The following graph shows the 4-week moving average of weekly claims since 1971.
 Click on graph for larger image.
The dashed line on the graph is the current 4-week average. The four-week average of weekly unemployment claims decreased to 257,500.
This was below the consensus forecast. The recent increase in claims is due to the hurricanes.
Wednesday, October 11, 2017
Port of Long Beach: Record Month, "Looks like retailers are optimistic about the holiday season"
by Calculated Risk on 10/11/2017 06:45:00 PM
From the Port of Long Beach: Port of Long Beach Sets Record for September
Cargo volume continues to break records at the Port of Long Beach, which moved more containers last month than any September in its history.CR Note: I'll have more on port traffic soon.
The 701,619 twenty-foot equivalent units (TEUs) processed in Long Beach for September — up 28.3 percent — also resulted in the Port’s best quarter ever. In the third quarter (July, August and September), the Port of Long Beach handled 2,114,306 TEUs, as volumes swelled 15.9 percent over the same period last year.
“Simply put, we are having the best trade months in Port history,” said Harbor Commission President Lou Anne Bynum. “Back-to-school merchandise was strong for us, and it looks like retailers are optimistic about the holiday season.”
Thursday:
• At 8:30 AM ET, The initial weekly unemployment claims report will be released. The consensus is for 252 thousand initial claims, down from 260 thousand the previous week.
• Also at 8:30 AM, The Producer Price Index for September from the BLS. The consensus is a 0.4% increase in PPI, and a 0.2% increase in core PPI.
FOMC Minutes: "Many participants thought" December Rate Hike "likely to be warranted"
by Calculated Risk on 10/11/2017 03:05:00 PM
From the Fed: Minutes of the Federal Open Market Committee, September 19-20, 2017. Excerpts:
In their discussion of monetary policy, all participants agreed that the economy had evolved broadly as they had anticipated at the time of the June meeting and that the incoming data had not materially altered the medium-term economic outlook. Consistent with those assessments, participants saw it as appropriate, at this meeting, to announce implementation of the plan for reducing the Federal Reserve's securities holdings that the Committee released in June. Many underscored that the reduction in securities holdings would be gradual and that financial market participants appeared to have a clear understanding of the Committee's planned approach for a gradual normalization of the size of the Federal Reserve's balance sheet. Consequently, participants generally expected that any reaction in financial markets to the start of balance sheet normalization would likely be limited.
...
Consistent with the expectation that a gradual rise in the federal funds rate would be appropriate, many participants thought that another increase in the target range later this year was likely to be warranted if the medium-term outlook remained broadly unchanged. Several others noted that, in light of the uncertainty around their outlook for inflation, their decision on whether to take such a policy action would depend importantly on whether the economic data in coming months increased their confidence that inflation was moving up toward the Committee's objective. A few participants thought that additional increases in the federal funds rate should be deferred until incoming information confirmed that the low readings on inflation this year were not likely to persist and that inflation was clearly on a path toward the Committee's symmetric 2 percent objective over the medium term. All agreed that they would closely monitor and assess incoming data before making any further adjustment to the federal funds rate.
emphasis added
BLS: Job Openings Decreased Slightly in August
by Calculated Risk on 10/11/2017 10:06:00 AM
From the BLS: Job Openings and Labor Turnover Summary
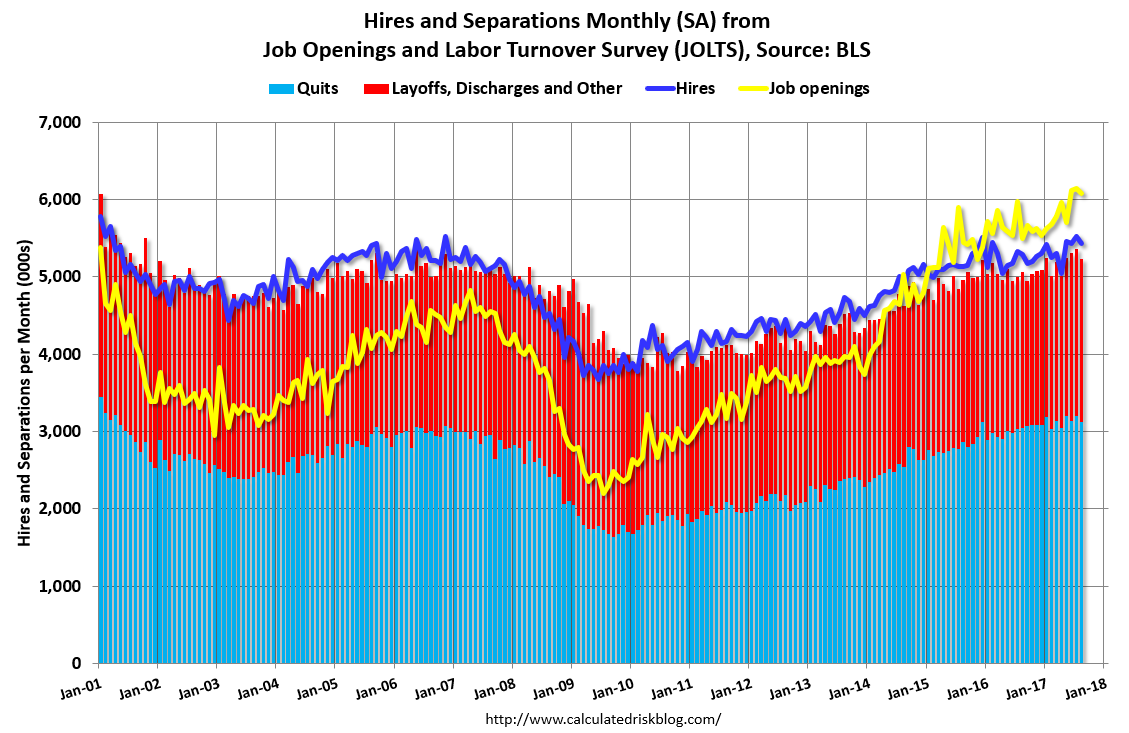
The number of job openings was little changed at 6.1 million on the last business day of August, the U.S. Bureau of Labor Statistics reported today. Over the month, hires and separations were also little changed at 5.4 million and 5.2 million, respectively. Within separations, the quits rate and the layoffs and discharges rate were little changed at 2.1 percent and 1.2 percent, respectively. ...The following graph shows job openings (yellow line), hires (dark blue), Layoff, Discharges and other (red column), and Quits (light blue column) from the JOLTS.
The number of quits was little changed at 3.1 million in August. The quits rate was 2.1 percent. The number of quits was little changed for total private and for government. Quits decreased in information (-14,000) and mining and logging (-6,000). In the regions, the number of quits increased in the West but decreased in the South.
emphasis added
This series started in December 2000.
Note: The difference between JOLTS hires and separations is similar to the CES (payroll survey) net jobs headline numbers. This report is for August, the most recent employment report was for September.
 Click on graph for larger image.
Note that hires (dark blue) and total separations (red and light blue columns stacked) are pretty close each month. This is a measure of labor market turnover. When the blue line is above the two stacked columns, the economy is adding net jobs - when it is below the columns, the economy is losing jobs.
Jobs openings decreased in August to 6.082 million from 6.140 in July. Note: July had the highest number of job openings since this series started in December 2000.
The number of job openings (yellow) are up 11% year-over-year.
Quits are up 2% year-over-year. These are voluntary separations. (see light blue columns at bottom of graph for trend for "quits").
Job openings are mostly moving sideways at a high level, and quits are increasing year-over-year. This is another strong report.
MBA: Mortgage Applications Decrease in Latest Weekly Survey
by Calculated Risk on 10/11/2017 07:00:00 AM
From the MBA: Mortgage Applications Decrease in Latest MBA Weekly Survey
Mortgage applications decreased 2.1 percent from one week earlier, according to data from the Mortgage Bankers Association’s (MBA) Weekly Mortgage Applications Survey for the week ending October 6, 2017.
... The Refinance Index decreased 4 percent from the previous week. The seasonally adjusted Purchase Index decreased 0.1 percent from one week earlier. The unadjusted Purchase Index increased 0.1 percent compared with the previous week and was 7 percent higher than the same week one year ago. ...
The average contract interest rate for 30-year fixed-rate mortgages with conforming loan balances ($424,100 or less) increased to 4.16 percent from 4.12 percent, with points decreasing to 0.44 from 0.45 (including the origination fee) for 80 percent loan-to-value ratio (LTV) loans.
emphasis added
 Click on graph for larger image.
The first graph shows the refinance index since 1990.
Refinance activity will not pick up significantly unless mortgage rates fall well below 4%.
 The second graph shows the MBA mortgage purchase index.
 According to the MBA, purchase activity is up 7% year-over-year.
Tuesday, October 10, 2017
Wednesday: Job Openings, FOMC Minutes
by Calculated Risk on 10/10/2017 07:38:00 PM
From Matthew Graham at Mortgage News Daily: Mortgage Rates Little-Changed Near 4%
Mortgage rates were marginally lower today compared to last week, but only when factoring in upfront finance charges. Actual quoted interest rates have been unchanged for more than a week with the average lender quoting conventional 30yr fixed rates of 4.0% on top tier scenarios.Wednesday:
• At 7:00 AM ET: The Mortgage Bankers Association (MBA) will release the results for the mortgage purchase applications index.
• At 10:00 AM: Job Openings and Labor Turnover Survey for August from the BLS. Jobs openings increased in July to 6.170 million from 6.116 in June. This was the highest number of job openings since this series started in December 2000. The number of job openings were up 3% year-over-year, and Quits were up 4% year-over-year.
• At 2:00 PM: FOMC Minutes, Meeting of September 19 - 20, 2017
Q3 Review: Ten Economic Questions for 2017
by Calculated Risk on 10/10/2017 02:55:00 PM
At the end of last year, I posted Ten Economic Questions for 2017. I followed up with a brief post on each question. The goal was to provide an overview of what I expected in 2017 (I don't have a crystal ball, but I think it helps to outline what I think will happen - and understand - and change my mind, when the outlook is wrong).
By request, here is a quick Q3 review. I've linked to my posts from the beginning of the year, with a brief excerpt and a few comments:
10) Question #10 for 2017: Will housing inventory increase or decrease in 2017?
I was wrong on inventory last year, but right now my guess is active inventory will increase in 2017 (inventory will decline seasonally in December and January, but I expect to see inventory up again year-over-year in December 2017). My reasons for expecting more inventory are 1) inventory is historically low (lowest for November since 2000), 2) and the recent increase in interest rates.According to the August NAR report on existing home sales, inventory was down 6.5% year-over-year in August, and the months-of-supply was at 4.2 months. This was the smallest year-over-year decline this year, but it appears unlikely inventory will be up by year end. This is a key metric to watch!
9) Question #9 for 2017: What will happen with house prices in 2017?
Inventories will probably remain low in 2017, although I expect inventories to increase on a year-over-year basis by December of 2017. Low inventories, and a decent economy suggests further price increases in 2017.The Case-Shiller data released last month showed prices up 5.9% year-over-year in July. The Case-Shiller year-over-year increase is about the same as the annual increase in 2016.
Perhaps higher mortgage rates will slow price appreciation. If we look back at the "taper tantrum" in 2013, price appreciation slowed somewhat over the next year - but that was from a high level. In June 2013, the Case-Shiller National index was up 9.3% year-over-year. By June 2014, the index was up 6.3% year-over-year.
If inventory increases year-over-year as I expect by December 2017, it seems likely that price appreciation will slow to the low-to-mid single digits.
8) Question #8 for 2017: How much will Residential Investment increase?
Most analysts are looking for starts to increase to around 1.25 million in 2017, and for new home sales of around 600 to 650 thousand. This would be an increase of around 7% for starts and maybe 10% for new home sales.Through August, starts were up 2.7% year-over-year compared to the same period in 2016. And new home sales were up 7.5% year-over-year. About as expected.
I think there will be further growth in 2017, but I think a combination of higher mortgage rates, less multi-family starts, and not enough lots for low-to-mid range new homes will mean sluggish growth in 2017.
My guess is starts will increase to just over 1.2 million in 2017 and new home sales will be in the low 600 thousand range.
7) Question #7 for 2017: How much will wages increase in 2017?
As the labor market continues to tighten, we should see more wage pressure as companies have to compete for employees. I expect to see some further increases in both the Average hourly earning from the CES, and in the Atlanta Fed Wage Tracker. Perhaps nominal wages will increase more than 3% in 2017 according to the CES.Through September 2017, nominal hourly wages were up 2.9% year-over-year. This is a pickup from last year, and so far it appears wages will increase at a faster rate in 2017.
6) Question #6 for 2017: Will the Fed raise rates in 2017, and if so, by how much?
Analysts are being cautious on forecasting rate hikes, probably because they forecasted too many hikes over the last few years. However, as the economy approaches full employment, and with the possibility of fiscal stimulus in 2017, it is possible that inflation will pick up a little - and, if so, the Fed could hike more than expected.The Fed has already hiked twice in 2017, and started to reduce the balance sheet. The Fed is still forecasting three hikes this year. The third hike is currently expected in December.
My current guess is the Fed will hike twice in 2017.
5) Question #5 for 2017: Will the core inflation rate rise in 2017? Will too much inflation be a concern in 2017?
The Fed is projecting core PCE inflation will increase to 1.8% to 1.9% by Q4 2017. However there are risks for higher inflation. The labor market is approaching full employment, and the new administration is proposing some fiscal stimulus (tax cuts, possible infrastructure spending), so it is possible - as a result - that inflation will increase more than expected in 2017 and 2018.Inflation has eased, and is below the Fed's target by most measures.
Currently I think PCE core inflation (year-over-year) will increase further and be close to 2% in 2017, but too much inflation will still not be a serious concern in 2017.
4) Question #4 for 2017: What will the unemployment rate be in December 2017?
Depending on the estimate for the participation rate and job growth (next question), it appears the unemployment rate will declining slightly by December 2017 from the current 4.7%.The unemployment rate was at 4.2% in September - a little below the level I expected for the end of 2017.
3) Question #3 for 2017: Will job creation slow further in 2017?
So my forecast is for gains of 125,000 to 150,000 payroll jobs per month in 2017. Lower than in 2016, but another solid year for employment gains given current demographics.Through September 2017, the economy has added 1,519,000 jobs, or 152,000 per month, down from 187,000 per month in 2016. This is as expected.
2) Question #2 for 2017: How much will the economy grow in 2017?
There will probably be some economic boost from oil sector investment in 2017 since oil prices have increased (this was a drag last year).GDP averaged just over 2% in the first half of 2017. It is too early to tell if there will be any pickup in GDP growth this year.
The housing recovery is ongoing, however auto sales might have peaked.
And demographics are improving (the prime working age population is growing about 0.5% per year, compared to declining a few years ago).
All these factors combined will probably push GDP growth into the mid-to-high 2% range in 2017, but this will depend somewhat on which policies are enacted.
1) Question #1 for 2017: What about fiscal and regulatory policy in 2017?
We are still waiting for the details. As far as the impact on 2017, my expectation is there will be both individual and corporate tax cuts - and some sort of infrastructure program. I expect that something will happen with the ACA (those that have insurance for 2017 will keep their insurance, but they might not have insurance in 2018 - and that impact would be in 2018). I think the negative proposals (immigration, trade) will impact the economy in 2018 or later - overall there will be a small boost to GDP in 2017.So far nothing has happened with the ACA, taxes, infrastructure, or trade. Policy remains a wild card.
A final comment: The words of a President matter. Mr Trump has been impulsive, reckless and irresponsible with his comments, and that has continued since the election. One absurd comment could send the markets into a tailspin and negatively impact the economy (and that could happen at any time).
Currently it looks like 2017 is unfolding mostly as expected.
Off-topic: The Art of Negotiation
by Calculated Risk on 10/10/2017 12:23:00 PM
Recently I’ve spoken to a few Trump supporters who think Mr. Trump has extensive negotiating experience. They are wrong.
In general, there are two types of negotiations. There is the “win-lose” type (or Distributive negotiation) where one party receives more and the other party receives less. This is the common approach when buying a car or real estate, or haggling at a street market.
The other type of negotiation is “win-win” (or Integrative negotiation). This type is used when negotiating between a company and a worker’s union, with long term suppliers, negotiating agreements between international allies – and even with adversaries.
The tactics for the two types of negotiations are very different. In the first type (win-lose), bluffing, threats (like threatening to walk away), even lying are commonly used. (Sound familiar?)
The approach to an integrative negotiation includes building trust, understanding the other party’s concerns, and knowing the details of the agreement – with the goal to reach a mutually beneficial agreement.
It is important to understand when each approach is appropriate. A used car buyer could use the Integrative negotiation approach, but they probably wouldn’t get a very good deal.
A company could use the “win-lose” tactics with a worker’s union, but they would probably face an extended strike followed by a long period of ill-will.
This brings me to Mr. Trump. He has experience in “win-lose” negotiations (buying and selling real estate), but apparently little or no experience in Integrative negotiations.
Mr. Trump keeps using the tactics of “win-lose” in negotiating with Congress, allies and adversaries. Not only has this been ineffective (members of Congress have repeatedly called his bluffs), but it is damaging to long term relationships. Mr. Trump’s use of “win-lose” techniques with North Korea have made him look weak and ineffective (a “dotard”), and have increased the risks of a major misunderstanding and possibly a war.
So, what can Mr. Trump do to be effective? First, he needs to realize he lacks the negotiating experience that is required for these types of negotiations. He needs to stop with the empty threats, bluffs, and lying. And he either needs to learn the integrative negotiation approach (and become a student of the details), or hire people with relevant negotiating experience (and remove himself from the process). All of this seems unlikely, and I expect Mr. Trump to continue using inappropriate tactics - that betray his lack of negotiating experience.
CoreLogic: House Prices up 6.9% Year-over-year in August
by Calculated Risk on 10/10/2017 10:00:00 AM
Notes: This CoreLogic House Price Index report is for August. The recent Case-Shiller index release was for July. The CoreLogic HPI is a three month weighted average and is not seasonally adjusted (NSA).
From CoreLogic: CoreLogic US Home Price Report Shows Prices Up 6.9 Percent in August 2017
August National Home Prices Home prices nationwide, including distressed sales, increased year over year by 6.9 percent in August 2017 compared with August 2016 and increased month over month by 0.9 percent in August 2017 compared with July 2017. ...The CoreLogic HPI Forecast indicates that home prices will increase by 4.7 percent on a year-over-year basis from August 2017 to August 2018, and on a month-over-month basis home prices are expected to increase by 0.1 percent from August 2017 to September 2017.CR Note: The YoY increase has been in the 5% to 7% range for the last couple of years.
emphasis added
The year-over-year comparison has been positive for over five consecutive years since turning positive year-over-year in February 2012.
NFIB: Small Business Optimism Index decreased in September
by Calculated Risk on 10/10/2017 08:43:00 AM
From the National Federation of Independent Business (NFIB): Small Business Optimism Slides in September, Expected business conditions tumble in NFIB Optimism Index
The NFIB Index of Small Business Optimism tumbled in September from 105.3 to 103 led by a steep drop in sales expectations, not just in hurricane-affected states, but across the country.
“The temptation is to blame the decline on the hurricanes in Texas and Florida, but that is not consistent with our data,” said Juanita Duggan, NFIB President and CEO. “Small business owners across the country were measurably less enthusiastic last month.”
...
Job creation weakened in the small business sector as business owners reported an adjusted average employment change per firm of -0.17 workers. Decreases were reported by owners in six of the nine Census regions, so it wasn’t just a hurricane effect. ... Nineteen percent of owners cited the difficulty of finding qualified workers as their Single Most Important Business Problem (unchanged), second only to taxes. This is the top ranked problem for those in construction (30 percent) and manufacturing (28 percent), getting more votes than taxes and regulations.
emphasis added
 Click on graph for larger image.
This graph shows the small business optimism index since 1986.
The index decreased to 103.0 in September.


