by Calculated Risk on 7/25/2017 09:13:00 AM
Tuesday, July 25, 2017
Case-Shiller: National House Price Index increased 5.6% year-over-year in May
S&P/Case-Shiller released the monthly Home Price Indices for May ("May" is a 3 month average of March, April and May prices).
This release includes prices for 20 individual cities, two composite indices (for 10 cities and 20 cities) and the monthly National index.
From S&P: The S&P Corelogic Case-Shiller National Home Price NSA Index Sets Record for Sixth Consecutive Months
The S&P CoreLogic Case-Shiller U.S. National Home Price NSA Index, covering all nine U.S. census divisions, reported a 5.6% annual gain in May, the same as the prior month. The 10-City Composite annual increase came in at 4.9%, down from 5.0% the previous month. The 20-City Composite posted a 5.7% year-over-year gain, down from 5.8% in April.I'll have more later.
Seattle, Portland, and Denver reported the highest year-over-year gains among the 20 cities. In May, Seattle led the way with a 13.3% year-over-year price increase, followed by Portland with 8.9%, and Denver overtaking Dallas with a 7.9% increase. Nine cities reported greater price increases in the year ending May 2017 versus the year ending April 2017.
...
Before seasonal adjustment, the National Index posted a month -over-month gain of 1.0% in May. The 10-City Composite posted a 0.7% increase and 20-City Composite reported a 0.8% increase in May. After seasonal adjustment, the National Index recorded a 0. 2% month-over-month increase. The 10- City Composite remained stagnant with no month-over-month increase. The 20-City Composite posted a 0.1% month-over-month increase. All 20 cities reported increases in May before seasonal adjustment; after seasonal adjustment, 14 cities saw prices rise.
“Home prices continue to climb and outpace both inflation and wages,” says David M. Blitzer, Managing Director and Chairman of the Index Committee at S&P Dow Jones Indices. “Housing is not repeating the bubble period of 2000-2006: price increases vary across the country unlike the earlier period when rising prices were almost universal; the number of homes sold annually is 20% less today than in the earlier period and the months’ supply is declining, not surging. The small supply of homes for sale, at only about four months’ worth, is one cause of rising prices. New home construction, higher than during the recession but still low, is another factor in rising prices.
“For the last 19 months, either Seattle or Portland OR was the city with fastest rising home prices based on 12-month gains. Since the national index bottomed in February 2012, San Francisco has the largest gain. Using Census Bureau data for 2011 to 2015, it is possible to compare these three cities to national averages. The proportion of owner-occupied homes is lower than the national average in all three cities with San Francisco being the lowest at 36%, Seattle at 46%, and Portland at 52%. Nationally, the figure is 64%. The key factor for the rise in home prices is population growth from 2010 to 2016: the national increase is 4.7%, but for these cities, it is 8.2% in San Francisco, 9.6% in Portland and 15.7% in Seattle. A larger population combined with more people working leads to higher home prices.”
emphasis added
Monday, July 24, 2017
Tuesday: Case-Shiller House Prices
by Calculated Risk on 7/24/2017 07:49:00 PM
From Matthew Graham at Mortgage News Daily: Rates Begin Week Unchanged at July's Lows
Mortgage rates held steady today, which leaves them in line with the lowest levels in July. [30YR FIXED - 4.00%] ... The most obvious calendar item is the Fed Announcement on Wednesday.Tuesday:
• At 9:00 AM ET, FHFA House Price Index for May 2017. This was originally a GSE only repeat sales, however there is also an expanded index.
• At 9:00 AM, S&P/Case-Shiller House Price Index for May. The consensus is for a 5.8% year-over-year increase in the Comp 20 index for May.
• At 10:00 AM, Richmond Fed Survey of Manufacturing Activity for July.
Funny Real Estate Quote from 10 Years Ago
by Calculated Risk on 7/24/2017 03:51:00 PM
Time flies!
Ten years ago, the NAR reported existing home sales of 5.75 million SAAR for June 2007. Since then sales for June 2007 have been revised down to 5.120 million SAAR.
Note: Earlier today, the NAR reported June 2017 sales at 5.52 million SAAR - after several years of increasing sales.
Ten years ago, NAR's senior economist said:
"It is too early to say if home sales have already passed bottom," said Lawrence Yun, the senior economist for the group in the report. "Still, major declines in home sales are likely to have occurred already and further declines, if any, are likely to be modest given the accumulating pent-up demand."Yes. It was too early to call the bottom - by several years. And sales fell much further to a low of 3.3 million SAAR in July 2010 (Sales for a number of months were below 4 million SAAR).
A Few Comments on June Existing Home Sales
by Calculated Risk on 7/24/2017 01:06:00 PM
Earlier: NAR: "Existing-Home Sales Retreat 1.8 Percent in June"
Inventory is still very low and falling year-over-year (down 7.1% year-over-year in June). Inventory has declined year-over-year for 25 consecutive months, although the pace of decline has slowed over the two months.
I started the year expecting inventory would be increasing year-over-year by the end of 2017. That now seems unlikely, but still possible. In April, inventory was down 9.4% year-over-year, and in May, inventory was down 7.9% - and in June, down 7.1%. If that trend continues, inventory might be close to unchanged (or just down slightly) year-over-year by December.
Inventory is a key metric to watch. More inventory would probably mean smaller price increases, and less inventory somewhat larger price increases.
The following graph shows existing home sales Not Seasonally Adjusted (NSA).

Sales NSA in June (red column) were above June2016. (NSA) - and the highest for June since 2006.
Note that sales NSA are now in the seasonally strong period (March through September).
NAR: "Existing-Home Sales Retreat 1.8 Percent in June"
by Calculated Risk on 7/24/2017 10:11:00 AM
From the NAR: Existing-Home Sales Retreat 1.8 Percent in June
Existing-home sales slipped in June as low supply kept homes selling at a near record pace but ultimately ended up muting overall activity, according to the National Association of Realtors®. Only the Midwest saw an increase in sales last month.
Total existing-home sales, which are completed transactions that include single-family homes, townhomes, condominiums and co-ops, decreased 1.8 percent to a seasonally adjusted annual rate of 5.52 million in June from 5.62 million in May. Despite last month's decline, June's sales pace is 0.7 percent above a year ago, but is the second lowest of 2017 (February, 5.47 million).
...
Total housing inventory at the end of June declined 0.5 percent to 1.96 million existing homes available for sale, and is now 7.1 percent lower than a year ago (2.11 million) and has fallen year-over-year for 25 consecutive months. Unsold inventory is at a 4.3-month supply at the current sales pace, which is down from 4.6 months a year ago.
emphasis added
 Click on graph for larger image.
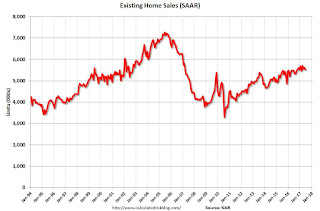
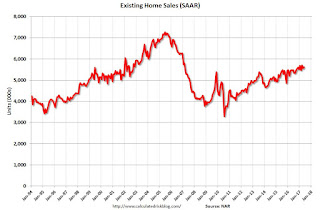
This graph shows existing home sales, on a Seasonally Adjusted Annual Rate (SAAR) basis since 1993.
Sales in June (5.63 million SAAR) were 1.8% lower than last month, and were 0.7% above the June 2016 rate.
The second graph shows nationwide inventory for existing homes.
 According to the NAR, inventory decreased to 1.96 million in June from 1.97 million in May. Headline inventory is not seasonally adjusted, and inventory usually decreases to the seasonal lows in December and January, and peaks in mid-to-late summer.
The last graph shows the year-over-year (YoY) change in reported existing home inventory and months-of-supply. Since inventory is not seasonally adjusted, it really helps to look at the YoY change. Note: Months-of-supply is based on the seasonally adjusted sales and not seasonally adjusted inventory.
 Inventory decreased 7.1% year-over-year in June compared to June 2016.
 Months of supply was at 4.3 months in June.
This was slightly below the consensus expectations. For existing home sales, a key number is inventory - and inventory is still low. I'll have more later ...
Sunday, July 23, 2017
Sunday Night Futures
by Calculated Risk on 7/23/2017 09:27:00 PM
Weekend:
• Schedule for Week of July 23, 2017
Monday:
• At 10:00 AM ET, Existing Home Sales for June from the National Association of Realtors (NAR). The consensus is for 5.58 million SAAR, down from 5.62 million in May. Housing economist Tom Lawler expects the NAR to report sales of 5.59 million SAAR for June.
From CNBC: Pre-Market Data and Bloomberg futures: S&P futures are down 3, and DOW futures are down 25 (fair value).
Oil prices were down over the last week with WTI futures at $45.72 per barrel and Brent at $48.00 per barrel. A year ago, WTI was at $43, and Brent was at $44 - so oil prices are up 5% to 10% year-over-year.
Here is a graph from Gasbuddy.com for nationwide gasoline prices. Nationally prices are at $2.28 per gallon - a year ago prices were at $2.16 per gallon - so gasoline prices are up 12 cents per gallon year-over-year.
Hotels: Occupancy Rate Down Slightly Year-over-Year
by Calculated Risk on 7/23/2017 12:23:00 PM
From HotelNewsNow.com: STR: US hotel results for week ending 15 July
The U.S. hotel industry reported mostly positive year-over-year results in the three key performance metrics during the week of 9-15 July 2017, according to data from STR.The following graph shows the seasonal pattern for the hotel occupancy rate using the four week average.
In comparison with the week of 10-16 July 2016, the industry recorded the following:
• Occupancy: -0.1% to 77.4%
• Average daily rate (ADR): +1.7% to US$130.76
• Revenue per available room (RevPAR): +1.6% to US$101.15
emphasis added
 The red line is for 2017, dash light blue is 2016, dashed orange is 2015 (best year on record), blue is the median, and black is for 2009 (the worst year since the Great Depression for hotels).
Currently the occupancy rate is tracking close to last year, and slightly behind the record year in 2015.
For hotels, occupancy will be strong over the summer.
Data Source: STR, Courtesy of HotelNewsNow.com
Saturday, July 22, 2017
Schedule for Week of July 23, 2017
by Calculated Risk on 7/22/2017 08:09:00 AM
The key economic reports this week are the advance estimate of Q1 GDP, New and Existing Home sales for June, and Case-Shiller house prices.
The FOMC meets on Tuesday and Wednesday, and no change to policy is expected.
 10:00 AM: Existing Home Sales for June from the National Association of Realtors (NAR). The consensus is for 5.58 million SAAR, down from 5.62 million in May.
The graph shows existing home sales from 1994 through the report last month.
Housing economist Tom Lawler expects the NAR to report sales of 5.59 million SAAR for June.
9:00 AM: FHFA House Price Index for May 2017. This was originally a GSE only repeat sales, however there is also an expanded index.
 9:00 AM ET: S&P/Case-Shiller House Price Index for May.
This graph shows the nominal seasonally adjusted National Index, Composite 10 and Composite 20 indexes through the April 2017 report (the Composite 20 was started in January 2000).
The consensus is for a 5.8% year-over-year increase in the Comp 20 index for May.
10:00 AM: Richmond Fed Survey of Manufacturing Activity for July.
7:00 AM ET: The Mortgage Bankers Association (MBA) will release the results for the mortgage purchase applications index.
 10:00 AM ET: New Home Sales for June from the Census Bureau.
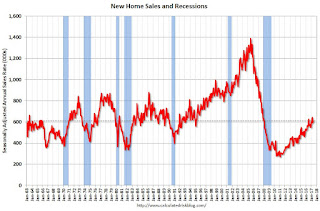
 This graph shows New Home Sales since 1963. The dashed line is the May sales rate.
The consensus is for 612 thousand SAAR, up from 610 thousand in May.
2:00 PM: FOMC Meeting Announcement. No change to policy is expected at this meeting.
8:30 AM ET: The initial weekly unemployment claims report will be released. The consensus is for 240 thousand initial claims, up from 233 thousand the previous week.
8:30 AM: Durable Goods Orders for June from the Census Bureau. The consensus is for a 3.2% increase in durable goods orders.
8:30 AM: Chicago Fed National Activity Index for June. This is a composite index of other data.
10:00 AM: the Q2 Housing Vacancies and Homeownership from the Census Bureau.
11:00 AM: the Kansas City Fed manufacturing survey for July.
8:30 AM: Gross Domestic Product, 2nd quarter 2017 (Advance estimate). The consensus is that real GDP increased 2.6% annualized in Q2, up from 1.4% in Q1.
10:00 AM: University of Michigan's Consumer sentiment index (final for July). The consensus is for a reading of 93.1, unchanged from the preliminary reading 93.1.
Friday, July 21, 2017
Oil Rigs decline slightly
by Calculated Risk on 7/21/2017 03:48:00 PM
A few comments from Steven Kopits of Princeton Energy Advisors LLC on July 21, 2017:
• Total US oil rigs were down 1 to 764
• Horizontal oil rigs were down 2 to 653
...
• $45 WTI seems sufficient to restrain US oil rig count growth
• However, shale well productivity yoy continues to surge based on early data. If the numbers continue to hold up, $45 will soon be a ceiling, not a floor, and oil prices could fall to $39-42 / barrel WTI by this time next year
 Click on graph for larger image.
CR note: This graph shows the US horizontal rig count by basin.
Graph and comments Courtesy of Steven Kopits of Princeton Energy Advisors LLC.
Q2 GDP Forecasts
by Calculated Risk on 7/21/2017 03:15:00 PM
From Merrill Lynch:
Next week is the annual 2017 revision to the NIPAs, which will update real GDP growth and PCE inflation since 2014. ... Updates to the underlying source data and methodology are likely to result in only slight changes to past GDP growth. The story for inflation is less clear.From Goldman Sachs:
More important will be 2Q GDP growth, which we expect will accelerate to 2.1%.
Our Q2 GDP tracking has declined [to 1.9%]From the Altanta Fed: GDPNow
The GDPNow model forecast for real GDP growth (seasonally adjusted annual rate) in the second quarter of 2017 is 2.5 percent on July 19, up from 2.4 percent on July 14.From the NY Fed Nowcasting Report
The New York Fed Staff Nowcast stands at 2.0% for 2017:Q2 and 2.0% for 2017:Q3.CR Note: Looks like real GDP growth will be around 2% in Q2.


