by Calculated Risk on 7/23/2017 09:27:00 PM
Sunday, July 23, 2017
Sunday Night Futures
Weekend:
• Schedule for Week of July 23, 2017
Monday:
• At 10:00 AM ET, Existing Home Sales for June from the National Association of Realtors (NAR). The consensus is for 5.58 million SAAR, down from 5.62 million in May. Housing economist Tom Lawler expects the NAR to report sales of 5.59 million SAAR for June.
From CNBC: Pre-Market Data and Bloomberg futures: S&P futures are down 3, and DOW futures are down 25 (fair value).
Oil prices were down over the last week with WTI futures at $45.72 per barrel and Brent at $48.00 per barrel. A year ago, WTI was at $43, and Brent was at $44 - so oil prices are up 5% to 10% year-over-year.
Here is a graph from Gasbuddy.com for nationwide gasoline prices. Nationally prices are at $2.28 per gallon - a year ago prices were at $2.16 per gallon - so gasoline prices are up 12 cents per gallon year-over-year.
Hotels: Occupancy Rate Down Slightly Year-over-Year
by Calculated Risk on 7/23/2017 12:23:00 PM
From HotelNewsNow.com: STR: US hotel results for week ending 15 July
The U.S. hotel industry reported mostly positive year-over-year results in the three key performance metrics during the week of 9-15 July 2017, according to data from STR.The following graph shows the seasonal pattern for the hotel occupancy rate using the four week average.
In comparison with the week of 10-16 July 2016, the industry recorded the following:
• Occupancy: -0.1% to 77.4%
• Average daily rate (ADR): +1.7% to US$130.76
• Revenue per available room (RevPAR): +1.6% to US$101.15
emphasis added
 The red line is for 2017, dash light blue is 2016, dashed orange is 2015 (best year on record), blue is the median, and black is for 2009 (the worst year since the Great Depression for hotels).
Currently the occupancy rate is tracking close to last year, and slightly behind the record year in 2015.
For hotels, occupancy will be strong over the summer.
Data Source: STR, Courtesy of HotelNewsNow.com
Saturday, July 22, 2017
Schedule for Week of July 23, 2017
by Calculated Risk on 7/22/2017 08:09:00 AM
The key economic reports this week are the advance estimate of Q1 GDP, New and Existing Home sales for June, and Case-Shiller house prices.
The FOMC meets on Tuesday and Wednesday, and no change to policy is expected.
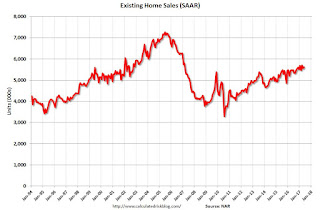
 10:00 AM: Existing Home Sales for June from the National Association of Realtors (NAR). The consensus is for 5.58 million SAAR, down from 5.62 million in May.
The graph shows existing home sales from 1994 through the report last month.
Housing economist Tom Lawler expects the NAR to report sales of 5.59 million SAAR for June.
9:00 AM: FHFA House Price Index for May 2017. This was originally a GSE only repeat sales, however there is also an expanded index.
 9:00 AM ET: S&P/Case-Shiller House Price Index for May.
This graph shows the nominal seasonally adjusted National Index, Composite 10 and Composite 20 indexes through the April 2017 report (the Composite 20 was started in January 2000).
The consensus is for a 5.8% year-over-year increase in the Comp 20 index for May.
10:00 AM: Richmond Fed Survey of Manufacturing Activity for July.
7:00 AM ET: The Mortgage Bankers Association (MBA) will release the results for the mortgage purchase applications index.
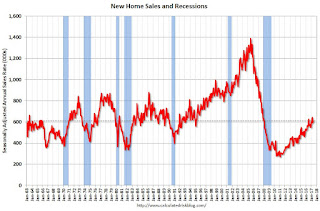
 10:00 AM ET: New Home Sales for June from the Census Bureau.
 This graph shows New Home Sales since 1963. The dashed line is the May sales rate.
The consensus is for 612 thousand SAAR, up from 610 thousand in May.
2:00 PM: FOMC Meeting Announcement. No change to policy is expected at this meeting.
8:30 AM ET: The initial weekly unemployment claims report will be released. The consensus is for 240 thousand initial claims, up from 233 thousand the previous week.
8:30 AM: Durable Goods Orders for June from the Census Bureau. The consensus is for a 3.2% increase in durable goods orders.
8:30 AM: Chicago Fed National Activity Index for June. This is a composite index of other data.
10:00 AM: the Q2 Housing Vacancies and Homeownership from the Census Bureau.
11:00 AM: the Kansas City Fed manufacturing survey for July.
8:30 AM: Gross Domestic Product, 2nd quarter 2017 (Advance estimate). The consensus is that real GDP increased 2.6% annualized in Q2, up from 1.4% in Q1.
10:00 AM: University of Michigan's Consumer sentiment index (final for July). The consensus is for a reading of 93.1, unchanged from the preliminary reading 93.1.
Friday, July 21, 2017
Oil Rigs decline slightly
by Calculated Risk on 7/21/2017 03:48:00 PM
A few comments from Steven Kopits of Princeton Energy Advisors LLC on July 21, 2017:
• Total US oil rigs were down 1 to 764
• Horizontal oil rigs were down 2 to 653
...
• $45 WTI seems sufficient to restrain US oil rig count growth
• However, shale well productivity yoy continues to surge based on early data. If the numbers continue to hold up, $45 will soon be a ceiling, not a floor, and oil prices could fall to $39-42 / barrel WTI by this time next year
 Click on graph for larger image.
CR note: This graph shows the US horizontal rig count by basin.
Graph and comments Courtesy of Steven Kopits of Princeton Energy Advisors LLC.
Q2 GDP Forecasts
by Calculated Risk on 7/21/2017 03:15:00 PM
From Merrill Lynch:
Next week is the annual 2017 revision to the NIPAs, which will update real GDP growth and PCE inflation since 2014. ... Updates to the underlying source data and methodology are likely to result in only slight changes to past GDP growth. The story for inflation is less clear.From Goldman Sachs:
More important will be 2Q GDP growth, which we expect will accelerate to 2.1%.
Our Q2 GDP tracking has declined [to 1.9%]From the Altanta Fed: GDPNow
The GDPNow model forecast for real GDP growth (seasonally adjusted annual rate) in the second quarter of 2017 is 2.5 percent on July 19, up from 2.4 percent on July 14.From the NY Fed Nowcasting Report
The New York Fed Staff Nowcast stands at 2.0% for 2017:Q2 and 2.0% for 2017:Q3.CR Note: Looks like real GDP growth will be around 2% in Q2.
Goldman: FOMC Preview
by Calculated Risk on 7/21/2017 12:25:00 PM
The FOMC will meet on Tuesday and Wednesday next week, and no change to policy is expected.
Here are a few brief excerpts from a note by Goldman Sachs economist David Mericle: FOMC Preview
We do not expect any policy changes at the July FOMC meeting and expect only limited changes to the post-meeting statement. The statement is likely to upgrade the description of job growth, but might also recognize that inflation has declined further. We think the statement is also likely to acknowledge that the balance sheet announcement is now closer at hand.
Looking ahead, we continue to expect the FOMC to announce the start of balance sheet normalization in September. We see a 5% probability that the next rate hike will come in September, a 5% probability that it will come in November, and a 50% probability that it will come in December, for a 60% cumulative probability of at least three hikes this year.
BLS: Unemployment Rates Lower in 10 states in June, Two States at New Series Lows
by Calculated Risk on 7/21/2017 10:20:00 AM
From the BLS: Regional and State Employment and Unemployment Summary
Unemployment rates were lower in June in 10 states, higher in 2 states, and stable in 38 states and the District of Columbia, the U.S. Bureau of Labor Statistics reported today. Twenty-seven states had jobless rate decreases from a year earlier and 23 states and the District had little or no change. The national unemployment rate, 4.4 percent, was little changed from May but was 0.5 percentage point lower than in June 2016.
...
Colorado and North Dakota had the lowest unemployment rates in June, 2.3 percent each. The rates in North Dakota (2.3 percent) and Tennessee (3.6 percent) set new series lows. ... Alaska had the highest jobless rate, 6.8 percent, followed by New Mexico, 6.4 percent.
emphasis added
 Click on graph for larger image.
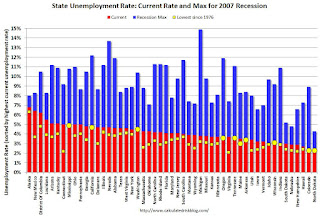
This graph shows the current unemployment rate for each state (red), and the max during the recession (blue). All states are well below the maximum unemployment rate for the recession.
The size of the blue bar indicates the amount of improvement. The yellow squares are the lowest unemployment rate per state since 1976.
Note: The larger yellow markers indicate the states that reached the all time low since the end of the 2007 recession. These ten states are: Arkansas, California, Colorado, Maine, Mississippi, North Dakota, Oregon, Tennessee, Washington, and Wisconsin.
The states are ranked by the highest current unemployment rate. Alaska, at 6.8%, had the highest state unemployment rate.
 The second graph shows the number of states (and D.C.) with unemployment rates at or above certain levels since January 2006. At the worst of the employment recession, there were 11 states with an unemployment rate at or above 11% (red).
Currently no state has an unemployment rate at or above 7% (light blue); Only two states and D.C. are at or above 6% (dark blue). The states are Alaska (6.8%) and New Mexico (6.4%). D.C. is at 6.2%.
Thursday, July 20, 2017
Lawler: Early Read on Existing Home Sales in June
by Calculated Risk on 7/20/2017 05:20:00 PM
From housing economist Tom Lawler:
Based on publicly-available local realtor/MLS reports from across the country released through today, I project that US existing home sales as estimated by the National Association of Realtors ran at a seasonally adjusted annual rate of 5.59 million in June, down 0.5% from May’s preliminary pace and up 2.0% from last May’s seasonally adjusted pace. On the inventory front, local realtor/MLS data suggest that there was a smaller YOY decline in the number of homes for sale in June compared to May, and I project that the NAR’s estimate of the number of existing homes for sale in June will be 1.97 million, up 0.5% from May’s preliminary estimate and down 6.6% from last May’s estimate. Finally, I project that the NAR’s estimate of the median existing single-family home sales price in June will be up 6.1% from last June.
In terms of inventories, there are sizable differences in trends across markets. As an example, the California Association of Realtors’ tabulation is that active listings of existing SF homes in California last month were down 13.5% from a year earlier, compared to a YOY decline of 12.4% in May. For Texas, in contrast, the Real Estate Center at Texas A&M University reported that active residential listings in Texas last month were up 13.0% from last June, compared to a YOY increase of 10.2% in May.
CR Note: The NAR is scheduled to release existing home sales for June on Monday, July 24th. The consensus forecast is for sales of 5.62 million SAAR.
NMHC: Apartment Market Tightness Index remained negative in July Survey
by Calculated Risk on 7/20/2017 03:50:00 PM
From the National Multifamily Housing Council (NMHC): Apartment Markets Decline Slightly in the July NMHC Quarterly Survey
All four indexes of the National Multifamily Housing Council’s (NMHC) July Quarterly Survey of Apartment Market Conditions remained slightly below the breakeven level of 50, the fourth consecutive quarter indicating softening conditions. The Market Tightness (43), Sales Volume (47), Equity Financing (46), and Debt Financing (47) Indexes all improved from April, but still hovered just below 50.
“All four indexes are below 50 but rising, suggesting that the softening is less wide-spread than in previous quarters,” said Mark Obrinsky, NMHC’s SVP of Research and Chief Economist. “Despite some softness at the high end of the apartment market—due to construction having finally ramped up to the level needed—demand for apartments will continue to be substantial for years to come.”
...
The Market Tightness Index edged up from 41 to 43, as almost half of respondents (48 percent) reported unchanged conditions. One-third (33 percent) of respondents saw conditions as looser than three months ago, while the remaining 19 percent reported tighter conditions. This marks the seventh consecutive quarter of overall declining conditions.
emphasis added

Click on graph for larger image.
This graph shows the quarterly Apartment Tightness Index. Any reading below 50 indicates looser conditions from the previous quarter. This indicates market conditions were looser over the last quarter.
As I've mentioned before, this index helped me call the bottom for effective rents (and the top for the vacancy rate) early in 2010.
This is the seventh consecutive quarterly survey indicating looser conditions - it appears supply has caught up with demand - and I expect rent growth to continue to slow.
Black Knight: Mortgage Delinquencies mostly unchanged in June
by Calculated Risk on 7/20/2017 12:49:00 PM
From Black Knight: Black Knight’ First Look at June 2017 Mortgage Data: Delinquencies Hold Steady Despite Seasonal Pressure; Low Interest Rates Help Prepayments Continue to Climb
• Despite upward seasonal pressure, mortgage delinquencies held steady at 3.8 percent in JuneAccording to Black Knight's First Look report for June, the percent of loans delinquent increased slightly in June compared to May, and declined 11.8% year-over-year.
• While total non-current inventory saw a three percent seasonal rise over Q2 2017, the inventory of serious delinquencies (loans 90 or more days past due) and active foreclosures fell by seven percent
• In total, serious delinquencies and active foreclosures have declined by 17 percent (nearly 200,000 loans) this year
• Low interest rates helped push prepayment activity up another 5.3 percent in June, following May’s 23 percent rise
The percent of loans in the foreclosure process declined 2.7% in June and were down 27.0% over the last year.
Black Knight reported the U.S. mortgage delinquency rate (loans 30 or more days past due, but not in foreclosure) was 3.80% in June, up from 3.79% in May.
The percent of loans in the foreclosure process declined in June to 0.81%.
The number of delinquent properties, but not in foreclosure, is down 246,000 properties year-over-year, and the number of properties in the foreclosure process is down 148,000 properties year-over-year.
| Black Knight: Percent Loans Delinquent and in Foreclosure Process | ||||
|---|---|---|---|---|
| June 2017 | May 2017 | June 2016 | June 2015 | |
| Delinquent | 3.80% | 3.79% | 4.31% | 4.79% |
| In Foreclosure | 0.81% | 0.83% | 1.10% | 1.56% |
| Number of properties: | ||||
| Number of properties that are delinquent, but not in foreclosure: | 1,932,000 | 1,927,000 | 2,178,000 | 2,415,000 |
| Number of properties in foreclosure pre-sale inventory: | 410,000 | 421,000 | 558,000 | 789,000 |
| Total Properties | 2,342,000 | 2,348,000 | 2,736,000 | 3,204,000 |


