by Calculated Risk on 7/21/2017 12:25:00 PM
Friday, July 21, 2017
Goldman: FOMC Preview
The FOMC will meet on Tuesday and Wednesday next week, and no change to policy is expected.
Here are a few brief excerpts from a note by Goldman Sachs economist David Mericle: FOMC Preview
We do not expect any policy changes at the July FOMC meeting and expect only limited changes to the post-meeting statement. The statement is likely to upgrade the description of job growth, but might also recognize that inflation has declined further. We think the statement is also likely to acknowledge that the balance sheet announcement is now closer at hand.
Looking ahead, we continue to expect the FOMC to announce the start of balance sheet normalization in September. We see a 5% probability that the next rate hike will come in September, a 5% probability that it will come in November, and a 50% probability that it will come in December, for a 60% cumulative probability of at least three hikes this year.
BLS: Unemployment Rates Lower in 10 states in June, Two States at New Series Lows
by Calculated Risk on 7/21/2017 10:20:00 AM
From the BLS: Regional and State Employment and Unemployment Summary
Unemployment rates were lower in June in 10 states, higher in 2 states, and stable in 38 states and the District of Columbia, the U.S. Bureau of Labor Statistics reported today. Twenty-seven states had jobless rate decreases from a year earlier and 23 states and the District had little or no change. The national unemployment rate, 4.4 percent, was little changed from May but was 0.5 percentage point lower than in June 2016.
...
Colorado and North Dakota had the lowest unemployment rates in June, 2.3 percent each. The rates in North Dakota (2.3 percent) and Tennessee (3.6 percent) set new series lows. ... Alaska had the highest jobless rate, 6.8 percent, followed by New Mexico, 6.4 percent.
emphasis added
 Click on graph for larger image.
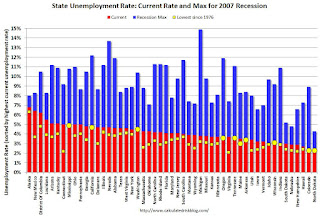
This graph shows the current unemployment rate for each state (red), and the max during the recession (blue). All states are well below the maximum unemployment rate for the recession.
The size of the blue bar indicates the amount of improvement. The yellow squares are the lowest unemployment rate per state since 1976.
Note: The larger yellow markers indicate the states that reached the all time low since the end of the 2007 recession. These ten states are: Arkansas, California, Colorado, Maine, Mississippi, North Dakota, Oregon, Tennessee, Washington, and Wisconsin.
The states are ranked by the highest current unemployment rate. Alaska, at 6.8%, had the highest state unemployment rate.
 The second graph shows the number of states (and D.C.) with unemployment rates at or above certain levels since January 2006. At the worst of the employment recession, there were 11 states with an unemployment rate at or above 11% (red).
Currently no state has an unemployment rate at or above 7% (light blue); Only two states and D.C. are at or above 6% (dark blue). The states are Alaska (6.8%) and New Mexico (6.4%). D.C. is at 6.2%.
Thursday, July 20, 2017
Lawler: Early Read on Existing Home Sales in June
by Calculated Risk on 7/20/2017 05:20:00 PM
From housing economist Tom Lawler:
Based on publicly-available local realtor/MLS reports from across the country released through today, I project that US existing home sales as estimated by the National Association of Realtors ran at a seasonally adjusted annual rate of 5.59 million in June, down 0.5% from May’s preliminary pace and up 2.0% from last May’s seasonally adjusted pace. On the inventory front, local realtor/MLS data suggest that there was a smaller YOY decline in the number of homes for sale in June compared to May, and I project that the NAR’s estimate of the number of existing homes for sale in June will be 1.97 million, up 0.5% from May’s preliminary estimate and down 6.6% from last May’s estimate. Finally, I project that the NAR’s estimate of the median existing single-family home sales price in June will be up 6.1% from last June.
In terms of inventories, there are sizable differences in trends across markets. As an example, the California Association of Realtors’ tabulation is that active listings of existing SF homes in California last month were down 13.5% from a year earlier, compared to a YOY decline of 12.4% in May. For Texas, in contrast, the Real Estate Center at Texas A&M University reported that active residential listings in Texas last month were up 13.0% from last June, compared to a YOY increase of 10.2% in May.
CR Note: The NAR is scheduled to release existing home sales for June on Monday, July 24th. The consensus forecast is for sales of 5.62 million SAAR.
NMHC: Apartment Market Tightness Index remained negative in July Survey
by Calculated Risk on 7/20/2017 03:50:00 PM
From the National Multifamily Housing Council (NMHC): Apartment Markets Decline Slightly in the July NMHC Quarterly Survey
All four indexes of the National Multifamily Housing Council’s (NMHC) July Quarterly Survey of Apartment Market Conditions remained slightly below the breakeven level of 50, the fourth consecutive quarter indicating softening conditions. The Market Tightness (43), Sales Volume (47), Equity Financing (46), and Debt Financing (47) Indexes all improved from April, but still hovered just below 50.
“All four indexes are below 50 but rising, suggesting that the softening is less wide-spread than in previous quarters,” said Mark Obrinsky, NMHC’s SVP of Research and Chief Economist. “Despite some softness at the high end of the apartment market—due to construction having finally ramped up to the level needed—demand for apartments will continue to be substantial for years to come.”
...
The Market Tightness Index edged up from 41 to 43, as almost half of respondents (48 percent) reported unchanged conditions. One-third (33 percent) of respondents saw conditions as looser than three months ago, while the remaining 19 percent reported tighter conditions. This marks the seventh consecutive quarter of overall declining conditions.
emphasis added

Click on graph for larger image.
This graph shows the quarterly Apartment Tightness Index. Any reading below 50 indicates looser conditions from the previous quarter. This indicates market conditions were looser over the last quarter.
As I've mentioned before, this index helped me call the bottom for effective rents (and the top for the vacancy rate) early in 2010.
This is the seventh consecutive quarterly survey indicating looser conditions - it appears supply has caught up with demand - and I expect rent growth to continue to slow.
Black Knight: Mortgage Delinquencies mostly unchanged in June
by Calculated Risk on 7/20/2017 12:49:00 PM
From Black Knight: Black Knight’ First Look at June 2017 Mortgage Data: Delinquencies Hold Steady Despite Seasonal Pressure; Low Interest Rates Help Prepayments Continue to Climb
• Despite upward seasonal pressure, mortgage delinquencies held steady at 3.8 percent in JuneAccording to Black Knight's First Look report for June, the percent of loans delinquent increased slightly in June compared to May, and declined 11.8% year-over-year.
• While total non-current inventory saw a three percent seasonal rise over Q2 2017, the inventory of serious delinquencies (loans 90 or more days past due) and active foreclosures fell by seven percent
• In total, serious delinquencies and active foreclosures have declined by 17 percent (nearly 200,000 loans) this year
• Low interest rates helped push prepayment activity up another 5.3 percent in June, following May’s 23 percent rise
The percent of loans in the foreclosure process declined 2.7% in June and were down 27.0% over the last year.
Black Knight reported the U.S. mortgage delinquency rate (loans 30 or more days past due, but not in foreclosure) was 3.80% in June, up from 3.79% in May.
The percent of loans in the foreclosure process declined in June to 0.81%.
The number of delinquent properties, but not in foreclosure, is down 246,000 properties year-over-year, and the number of properties in the foreclosure process is down 148,000 properties year-over-year.
| Black Knight: Percent Loans Delinquent and in Foreclosure Process | ||||
|---|---|---|---|---|
| June 2017 | May 2017 | June 2016 | June 2015 | |
| Delinquent | 3.80% | 3.79% | 4.31% | 4.79% |
| In Foreclosure | 0.81% | 0.83% | 1.10% | 1.56% |
| Number of properties: | ||||
| Number of properties that are delinquent, but not in foreclosure: | 1,932,000 | 1,927,000 | 2,178,000 | 2,415,000 |
| Number of properties in foreclosure pre-sale inventory: | 410,000 | 421,000 | 558,000 | 789,000 |
| Total Properties | 2,342,000 | 2,348,000 | 2,736,000 | 3,204,000 |
Earlier: Philly Fed Manufacturing Survey "Region continues to grow but at a slower pace" in July
by Calculated Risk on 7/20/2017 10:29:00 AM
Earlier from the Philly Fed: July 2017 Manufacturing Business Outlook Survey
Manufacturing activity in the region continues to grow but at a slower pace, according to results from the July Manufacturing Business Outlook Survey. The diffusion indexes for general activity, new orders, shipments, employment, and work hours remained positive but fell from their readings in June. Respondents also reported a moderation of price pressures this month. Firms remained generally optimistic about future growth. More than one-third of the manufacturers expect to add to their payrolls over the next six months.Here is a graph comparing the regional Fed surveys and the ISM manufacturing index:
The index for current manufacturing activity in the region decreased from a reading of 27.6 in June to 19.5 this month. The index has been positive for 12 consecutive months, but July’s reading is the lowest since November. ... Firms reported overall increases in manufacturing employment this month, but the current employment index fell 5 points. The index has been positive for eight consecutive months.
emphasis added
 Click on graph for larger image.
The New York and Philly Fed surveys are averaged together (yellow, through July), and five Fed surveys are averaged (blue, through June) including New York, Philly, Richmond, Dallas and Kansas City. The Institute for Supply Management (ISM) PMI (red) is through June (right axis).
This suggests the ISM manufacturing index will show slower, but still solid expansion, in July.
Weekly Initial Unemployment Claims decrease to 233,000
by Calculated Risk on 7/20/2017 08:33:00 AM
The DOL reported:
In the week ending July 15, the advance figure for seasonally adjusted initial claims was 233,000, a decrease of 15,000 from the previous week's revised level. The previous week's level was revised up by 1,000 from 247,000 to 248,000. The 4-week moving average was 243,750, a decrease of 2,250 from the previous week's revised average. The previous week's average was revised up by 250 from 245,750 to 246,000.The previous week was revised up.
emphasis added
The following graph shows the 4-week moving average of weekly claims since 1971.
 Click on graph for larger image.
The dashed line on the graph is the current 4-week average. The four-week average of weekly unemployment claims decreased to 243,750.
This was lower than the consensus forecast.
The low level of claims suggests relatively few layoffs.
Wednesday, July 19, 2017
Thursday: Unemployment Claims, Philly Fed Mfg
by Calculated Risk on 7/19/2017 07:22:00 PM
From Matthew Graham at Mortgage News Daily: Mortgage Rates at 3-Week Lows
Although today's rates aren't appreciably lower than yesterday's, they're technically the best we've seen since June 28th. More lenders are quoting top tier conventional 30yr fixed rates of 4.0% instead of 4.125%, and some of the aggressive lenders are back down to 3.875%.Tuesday:
• At 8:30 AM ET, The initial weekly unemployment claims report will be released. The consensus is for 245 thousand initial claims, down from 247 thousand the previous week.
• Also at 8:30 AM, the Philly Fed manufacturing survey for July. The consensus is for a reading of 23.5, down from 27.6.
Comments on June Housing Starts
by Calculated Risk on 7/19/2017 03:15:00 PM
Earlier: Housing Starts increased to 1.215 Million Annual Rate in June
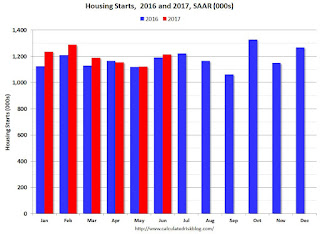
The housing starts report released this morning showed starts were up 8.3% in June compared to May, and were up 2.1% year-over-year compared to June 2016. This was a solid report and was above the consensus forecast.
Note that multi-family starts are volatile month-to-month, and has seen wild swings over the last year.
This first graph shows the month to month comparison between 2016 (blue) and 2017 (red).

Starts were up 2.1% in June 2017 compared to June 2016, and starts are up 6.0% year-to-date.
Note that single family starts are up 10.7% year-to-date, and the weakness (as expected) has been in multi-family starts.
My guess is starts will increase around 3% to 7% in 2017.
Below is an update to the graph comparing multi-family starts and completions. Since it usually takes over a year on average to complete a multi-family project, there is a lag between multi-family starts and completions. Completions are important because that is new supply added to the market, and starts are important because that is future new supply (units under construction is also important for employment).
These graphs use a 12 month rolling total for NSA starts and completions.

The rolling 12 month total for starts (blue line) increased steadily over the last few years - but has turned down recently. Completions (red line) have lagged behind - but completions have been generally catching up (more deliveries). Completions lag starts by about 12 months.
I think the growth in multi-family starts is behind us - in fact, multi-family starts probably peaked in June 2015 (at 510 thousand SAAR) - although I expect solid multi-family starts for a few more years (based on demographics).

Note the exceptionally low level of single family starts and completions. The "wide bottom" was what I was forecasting following the recession, and now I expect a few years of increasing single family starts and completions.
AIA: Architecture Billings Index positive in June
by Calculated Risk on 7/19/2017 09:52:00 AM
Note: This index is a leading indicator primarily for new Commercial Real Estate (CRE) investment.
From the AIA: Architecture firms end second quarter on a strong note
For the fifth consecutive month, architecture firms recorded increasing demand for design services as reflected in the June Architecture Billings Index (ABI). As a leading economic indicator of construction activity, the ABI reflects the approximate nine to twelve month lead time between architecture billings and construction spending. The American Institute of Architects (AIA) reported the June ABI score was 54.2, up from a score of 53.0 in the previous month. This score reflects an increase in design services (any score above 50 indicates an increase in billings). The new projects inquiry index was 58.6, down from a reading of 62.4 the previous month, while the new design contracts index decreased from 54.8 to 53.7.
“So far this year, new activity coming into architecture firms has generally exceeded their ability to complete ongoing projects,” said AIA Chief Economist, Kermit Baker, Hon. AIA, PhD. “Now, firms seem to be ramping up enough to manage these growing workloads.”
...
• Regional averages: South (54.8), West (53.1), Midwest (51.9), Northeast (51.5)
• Sector index breakdown: multi-family residential (57.1), mixed practice (53.8), institutional (52.6), commercial / industrial (52.1)
emphasis added
 Click on graph for larger image.
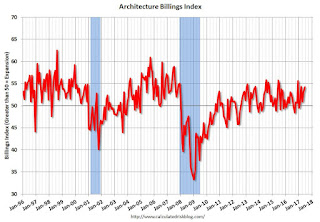
This graph shows the Architecture Billings Index since 1996. The index was at 54.2 in June, up from 53.0 the previous month. Anything above 50 indicates expansion in demand for architects' services.
Note: This includes commercial and industrial facilities like hotels and office buildings, multi-family residential, as well as schools, hospitals and other institutions.
According to the AIA, there is an "approximate nine to twelve month lag time between architecture billings and construction spending" on non-residential construction. This index was positive in 9 of the last 12 months, suggesting a further increase in CRE investment in 2017 and early 2018.


