 RSS Feed
 by Calculated Risk on 3/06/2017 11:22:00 AM
Monday, March 06, 2017
Update: It Does Rain in California!
California has endured a five year drought, but for much of the state, the drought is over.
Here are a few resources to track the rain and snow.
These tables show the snowpack in the North, Central and South Sierra. Currently the snowpack is about 153% of normal for this date in the North, 189% of normal in the Central Sierra, and 197% of normal in the Southern Sierra.
And here are some plots comparing the current and previous years to the average, a very dry year ('14-'15) and a wet year ('82-'83). This winter is well above the average and close to the record winter of '82-'83 in the Central and Southern Sierra.
And for Los Angeles, here is a historical table of annual rainfall. After five years of significantly below average rainfall, this year is well above normal. On average, there is about 11" of rain through February in LA (rain is measured July through June). This year, LA has received over 18" of rain through February.
This is good news for the state and the state economy.
 For Pacific Crest Trail and John Muir Trail hikers, I recommend using the Upper Tyndall Creek sensor to track the snow conditions. This graph shows the snow water content for Upper Tyndall Creek for the last 40 years. Note: I hiked the trail in September 1998 - a very wet year - and there was snow all year on Mt. Whitney.
There were four very dry years in a row, and then last winter was a little better - but still below normal.
For the Tyndall Creek area, this is the wettest year since 1998, and it is still early March!
Black Knight: Mortgage "Origination volumes in 2016 highest level seen in nine years"
by Calculated Risk on 3/06/2017 08:01:00 AM
Black Knight Financial Services (BKFS) released their Mortgage Monitor report for January today. According to BKFS, 4.25% of mortgages were delinquent in January, down from 5.09% in January 2016. BKFS also reported that 0.94% of mortgages were in the foreclosure process, down from 1.30% a year ago.
This gives a total of 5.19% delinquent or in foreclosure.
Press Release: Black Knight’s Mortgage Monitor: Strong Q4 Pushes 2016 Originations to Highest Level in Nine Years; Reperforming Loan Population Sits at Nearly Two Million
Today, the Data & Analytics division of Black Knight Financial Services, Inc. (NYSE: BKFS) released its latest Mortgage Monitor Report, based on data as of the end of January 2017. This month, Black Knight examined final Q4 2016 origination data to get a sense of purchase and refinance lending volumes and trends for the year as a whole. In addition, the report also looked at the nation’s population of reperforming loans (RPLs), mortgages that had been at least 120 days or more delinquent or in active foreclosure at some point in the past but have now been current for at least four months. As Black Knight Data & Analytics Executive Vice President Ben Graboske explained, 2016 was the best year for overall mortgage originations since 2007.
“A strong fourth quarter finish to the year pushed total 2016 origination volumes to the highest level seen in nine years,” said Graboske. “We’ve now seen nine consecutive quarters of double-digit purchase origination growth, and growth overall in the purchase market in 21 of the past 22 quarters. The $2.1 trillion in first lien mortgages originated throughout the year represented a 17 percent increase over 2015, stemming from a 22 percent jump in refinance lending and a 13 percent increase in purchase loans. This was the second straight year of double-digit growth in purchase lending, which hit its highest yearly total since 2006 at $1.1 trillion. As good of a year as it was for purchase lending, it was still 28 percent off the peak volume seen in 2005.”
emphasis added
 Click on graph for larger image.
This graph from Black Knight shows first lien mortgage originations per year.
From Black Knight:
• A strong Q4 pushed total 2016 origination volumes to the highest level seen in nine years
• $2.1 trillion in first lien mortgages originated in 2016 represented a 17 percent increase over 2015
• Refinance lending was up 22 percent, while purchase originations rose 13 percent
 This graph from Black Knight shows purchases origination per quarter - and the year-over-year change.
From Black Knight:
• We’ve now seen nine consecutive quarters of double digit purchase origination growth, and overall growth in the purchase market in 21 of the past 22 quartersThere is much more in the mortgage monitor.
• $260B in purchase volume in Q4 2016 was the highest fourth quarter origination volume since 2006
• The annual purchase origination growth rate accelerated in Q4 from 11 percent to 14 percent
Sunday, March 05, 2017
Sunday Night Futures
by Calculated Risk on 3/05/2017 07:03:00 PM
Weekend:
• Schedule for Week of Mar 5, 2017
From CNBC: Pre-Market Data and Bloomberg futures: S&P futures are down 8, and DOW futures are down 68 (fair value).
Oil prices were down slightly over the last week with WTI futures at $53.24 per barrel and Brent at $55.90 per barrel. A year ago, WTI was at $36, and Brent was at $38 - so oil prices are up almost 50% year-over-year.
Here is a graph from Gasbuddy.com for nationwide gasoline prices. Nationally prices are at $2.31 per gallon - a year ago prices were at $1.82 per gallon - so gasoline prices are up about 50 cents a gallon year-over-year.
Oil: "Another big week for horizontal rigs"
by Calculated Risk on 3/05/2017 11:35:00 AM
A few comments from Steven Kopits of Princeton Energy Advisors LLC on Feb 4, 2017:
• US oil rig count up by 7 this week to 609
• US horizontal oil rigs were up by 11
...
• Horizontal oil rigs adds have averaged 12 per week for the last seven weeks
• The OPEC production cut thesis now warrants a closer review—shales are going to prove more resilient than people are thinking
 Click on graph for larger image.
Graph and comments Courtesy of Steven Kopits of Princeton Energy Advisors LLC.
Saturday, March 04, 2017
Schedule for Week of Mar 5, 2017
by Calculated Risk on 3/04/2017 08:09:00 AM
The key report this week is the February employment report on Friday.
Also the January Trade Deficit, and the Q4 Quarterly Services and the Fed's Q4 Flow of Funds reports, will be released this week.
10:00 AM: Manufacturers' Shipments, Inventories and Orders (Factory Orders) for January. The consensus is a 1.1% increase in orders.
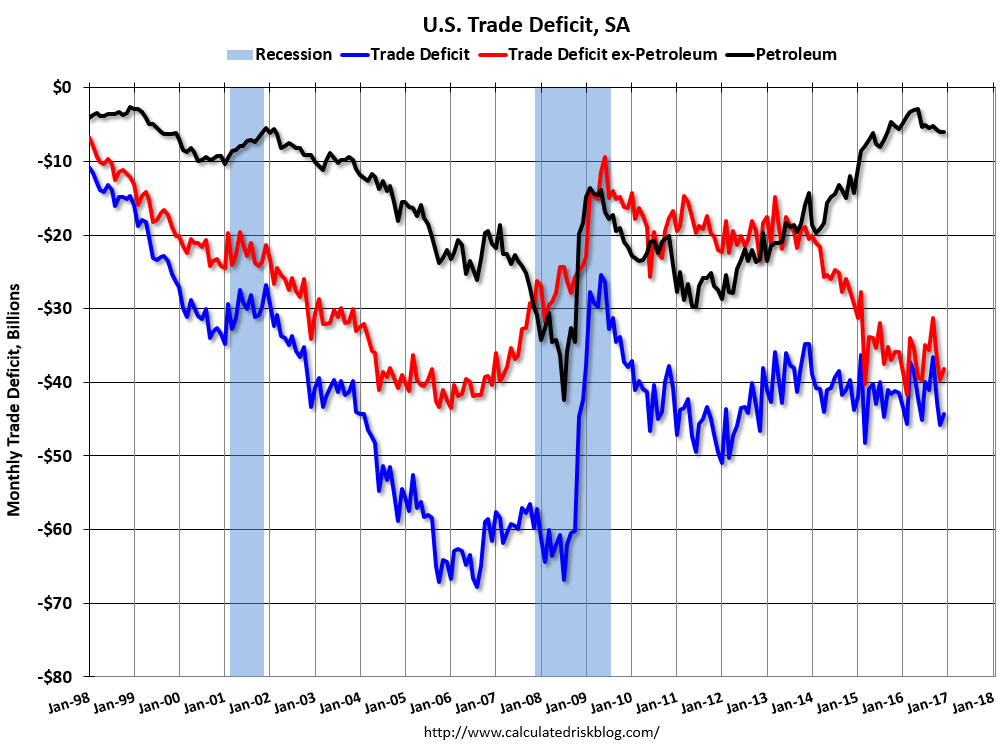 8:30 AM: Trade Balance report for January from the Census Bureau.
 This graph shows the U.S. trade deficit, with and without petroleum, through December. The blue line is the total deficit, and the black line is the petroleum deficit, and the red line is the trade deficit ex-petroleum products.
The consensus is for the U.S. trade deficit to be at $48.5 billion in January from $44.3 billion in December.
3:00 PM: Consumer credit from the Federal Reserve. The consensus is for a $18.3 billion increase in credit.
7:00 AM ET: The Mortgage Bankers Association (MBA) will release the results for the mortgage purchase applications index.
8:15 AM: The ADP Employment Report for February. This report is for private payrolls only (no government). The consensus is for 183,000 payroll jobs added in February, down from 246,000 added in January.
10:00 AM: Monthly Wholesale Trade: Sales and Inventories for January.
8:30 AM ET: The initial weekly unemployment claims report will be released. The consensus is for 238 thousand initial claims, up from 223 thousand the previous week.
10:00 AM: The Q4 Quarterly Services Report from the Census Bureau.
12:00 PM: Q4 Flow of Funds Accounts of the United States from the Federal Reserve.
8:30 AM: Employment Report for February. The consensus is for an increase of 195,000 non-farm payroll jobs added in February, down from the 227,000 non-farm payroll jobs added in January.
The consensus is for the unemployment rate to decline to 4.7%.
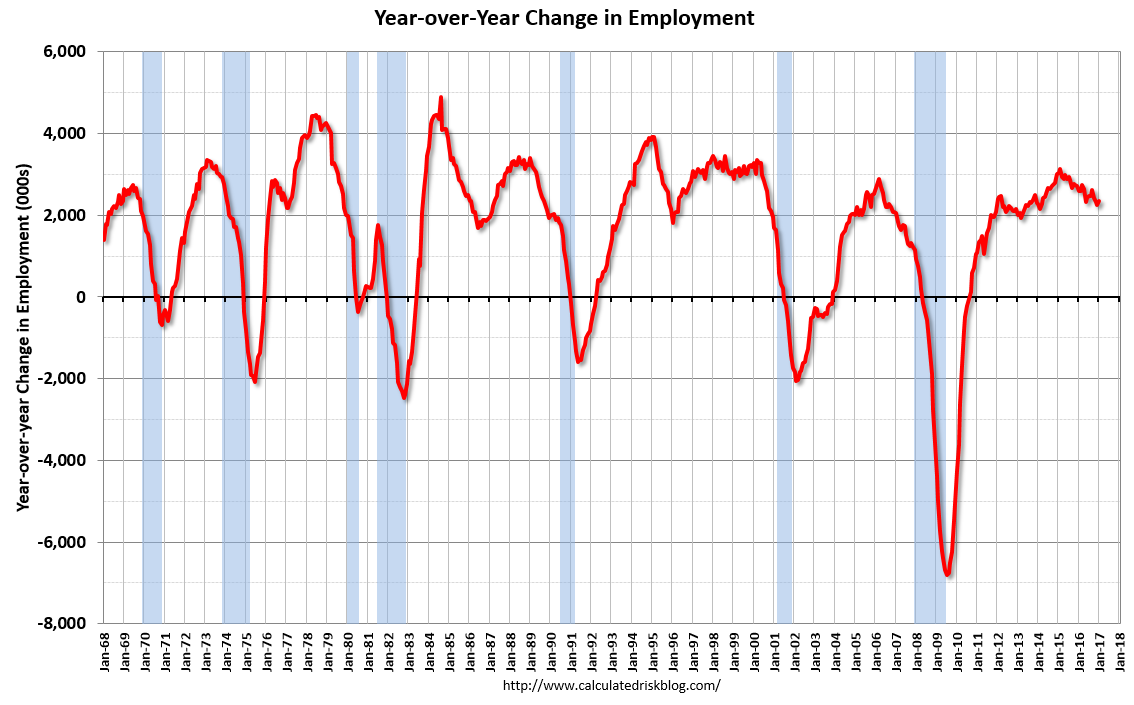 This graph shows the year-over-year change in total non-farm employment since 1968.
In January, the year-over-year change was 2.34 million jobs.
A key will be the change in wages.
Friday, March 03, 2017
AAR: Rail Traffic increased in February
by Calculated Risk on 3/03/2017 05:25:00 PM
From the Association of American Railroads (AAR) Rail Time Indicators. Graphs and excerpts reprinted with permission.
U.S. rail intermodal traffic in February 2017 was 1,068,439 containers and trailers, up 1.8% (19,350 units) over February 2016 and the best February ever for U.S. intermodal. U.S. rail carloads were 1,044,040 for the month, up 6.7% (65,141 carloads) over February 2016, thanks mainly to coal — coal carloads were up 19.2% (57,589 carloads) over last year.
 Click on graph for larger image.
This graph from the Rail Time Indicators report shows U.S. average weekly rail carloads (NSA). Dark blue is 2017.
Rail carloads have been weak over the last decade due to the decline in coal shipments.
February 2017 wasn’t a great month for rail traffic, but it was a good month, at least relatively speaking. U.S. railroads originated 1,044,040 total carloads for the month, up 6.7%, or 65,141 carloads, over February 2016. It’s the fourth straight year-over-year carload increase and the biggest percentage carload increase since December 2014. ...
 The second graph is for intermodal traffic (using intermodal or shipping containers):
U.S. rail intermodal volume in February 2017 was 1,068,439 containers and trailers, up 1.8% (19,350 units) over February 2016 and the highest-volume February ever for U.S. intermodal. In the first two months of 2017, U.S. intermodal volume was 2,089,507 units, down 0.04%, or 797 units, from 2016
Yellen: "a further adjustment of the federal funds rate would likely be appropriate" at March Meeting
by Calculated Risk on 3/03/2017 01:03:00 PM
From Fed Chair Janet Yellen: From Adding Accommodation to Scaling It Back Excerpt:
[W]e currently judge that it will be appropriate to gradually increase the federal funds rate if the economic data continue to come in about as we expect. Indeed, at our meeting later this month, the Committee will evaluate whether employment and inflation are continuing to evolve in line with our expectations, in which case a further adjustment of the federal funds rate would likely be appropriate.A rate hike is very likely at the March FOMC meeting.
ISM Non-Manufacturing Index increased to 57.6% in February
by Calculated Risk on 3/03/2017 10:05:00 AM
The February ISM Non-manufacturing index was at 57.6%, up from 56.5% in January. The employment index increased in February to 55.2%, from 54.7%. Note: Above 50 indicates expansion, below 50 contraction.
From the Institute for Supply Management:February 2017 Non-Manufacturing ISM Report On Business®
Economic activity in the non-manufacturing sector grew in February for the 86th consecutive month, say the nation's purchasing and supply executives in the latest Non-Manufacturing ISM® Report On Business®.
The report was issued today by Anthony Nieves, CPSM, C.P.M., CFPM, chair of the Institute for Supply Management® (ISM®) Non-Manufacturing Business Survey Committee: "The NMI® registered 57.6 percent, which is 1.1 percentage points higher than the January reading of 56.5 percent. This is the highest reading since October 2015 and represents continued growth in the non-manufacturing sector at a slightly faster rate. The Non-Manufacturing Business Activity Index increased to 63.6 percent, 3.3 percentage points higher than the January reading of 60.3 percent, which is the highest reading since February 2011, when the index registered 63.8 percent, reflecting growth for the 91st consecutive month, at a faster rate in February. The New Orders Index registered 61.2 percent, 2.6 percentage points higher than the reading of 58.6 percent in January. This is the highest reading since August 2015, when the index registered 62.7 percent. The Employment Index increased 0.5 percentage point in February to 55.2 percent from the January reading of 54.7 percent. The Prices Index decreased 1.3 percentage points from the January reading of 59 percent to 57.7 percent, indicating prices increased for the 11th consecutive month, at a slower rate in February. According to the NMI®, 16 non-manufacturing industries reported growth in February. The non-manufacturing sector reflected strong growth in February after cooling off in January. Respondents’ comments continue to be mixed, with some uncertainty; however, the majority indicate a positive outlook on business conditions and the overall economy."
emphasis added
 Click on graph for larger image.
This graph shows the ISM non-manufacturing index (started in January 2008) and the ISM non-manufacturing employment diffusion index.
This suggests faster expansion in February than in January. A strong report.
Thursday, March 02, 2017
Friday: Yellen, ISM Non-Mfg Index
by Calculated Risk on 3/02/2017 09:32:00 PM
This will be a closely watched speech by Fed Chair Janet Yellen. It appears that the FOMC is leaning towards raising rates this month.
Friday:
• At 10:00 AM, the ISM non-Manufacturing Index for February. The consensus is for index to increase to 57.2 from 57.1 in December.
• At 12:30 PM, Speech by Fed Vice Chairman Stanley Fischer, Fed Monetary Policy Decisionmaking, At the 2017 U.S. Monetary Policy Forum, New York, N.Y.
• At 1:00 PM, Speech by Fed Chair Janet Yellen, Economic Outlook, At the Executives Club of Chicago, Chicago, Ill.
Fannie Mae: Mortgage Serious Delinquency rate unchanged in January
by Calculated Risk on 3/02/2017 06:31:00 PM
Fannie Mae reported that the Single-Family Serious Delinquency rate was unchanged at 1.20% in January, from 1.20% in December. The serious delinquency rate is down from 1.55% in January 2016.
This ties last month as the lowest serious delinquency rate since March 2008.
These are mortgage loans that are "three monthly payments or more past due or in foreclosure".
The Fannie Mae serious delinquency rate peaked in February 2010 at 5.59%.
 Click on graph for larger image
Although the rate is declining, the "normal" serious delinquency rate is under 1%.
The Fannie Mae serious delinquency rate has fallen 0.35 percentage points over the last year, and at that rate of improvement, the serious delinquency rate will not be below 1% until later this year.
Note: Freddie Mac reported earlier.


