 RSS Feed
 by Calculated Risk on 3/04/2017 08:09:00 AM
Saturday, March 04, 2017
Schedule for Week of Mar 5, 2017
The key report this week is the February employment report on Friday.
Also the January Trade Deficit, and the Q4 Quarterly Services and the Fed's Q4 Flow of Funds reports, will be released this week.
10:00 AM: Manufacturers' Shipments, Inventories and Orders (Factory Orders) for January. The consensus is a 1.1% increase in orders.
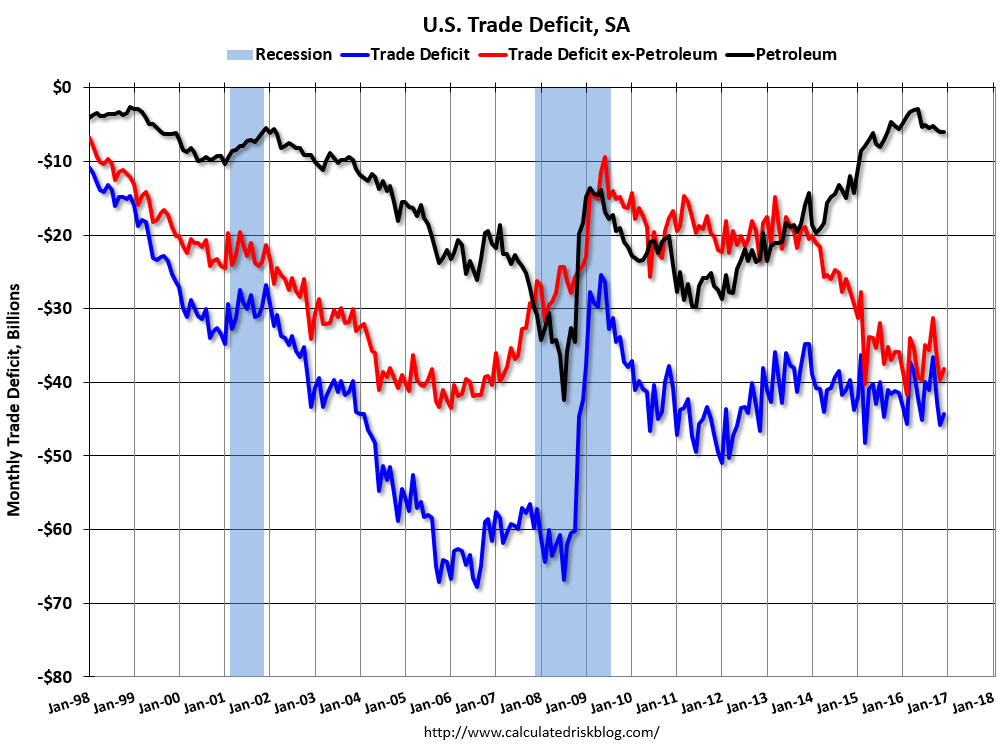 8:30 AM: Trade Balance report for January from the Census Bureau.
 This graph shows the U.S. trade deficit, with and without petroleum, through December. The blue line is the total deficit, and the black line is the petroleum deficit, and the red line is the trade deficit ex-petroleum products.
The consensus is for the U.S. trade deficit to be at $48.5 billion in January from $44.3 billion in December.
3:00 PM: Consumer credit from the Federal Reserve. The consensus is for a $18.3 billion increase in credit.
7:00 AM ET: The Mortgage Bankers Association (MBA) will release the results for the mortgage purchase applications index.
8:15 AM: The ADP Employment Report for February. This report is for private payrolls only (no government). The consensus is for 183,000 payroll jobs added in February, down from 246,000 added in January.
10:00 AM: Monthly Wholesale Trade: Sales and Inventories for January.
8:30 AM ET: The initial weekly unemployment claims report will be released. The consensus is for 238 thousand initial claims, up from 223 thousand the previous week.
10:00 AM: The Q4 Quarterly Services Report from the Census Bureau.
12:00 PM: Q4 Flow of Funds Accounts of the United States from the Federal Reserve.
8:30 AM: Employment Report for February. The consensus is for an increase of 195,000 non-farm payroll jobs added in February, down from the 227,000 non-farm payroll jobs added in January.
The consensus is for the unemployment rate to decline to 4.7%.
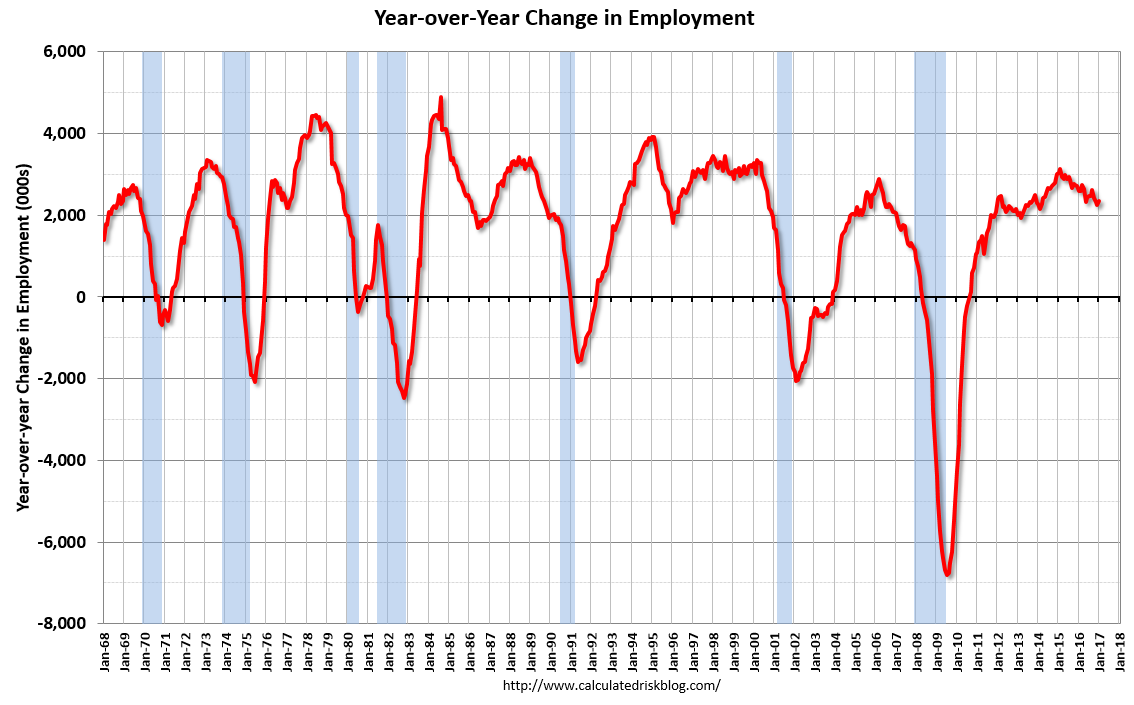 This graph shows the year-over-year change in total non-farm employment since 1968.
In January, the year-over-year change was 2.34 million jobs.
A key will be the change in wages.


