 RSS Feed
 by Calculated Risk on 2/20/2017 08:10:00 PM
Monday, February 20, 2017
Monday Night Futures
Weekend:
• Schedule for Week of Feb 19, 2017
• Post from 2005: Mortgage Debt and the "Recovery"
• Demographics and GDP
From CNBC: Pre-Market Data and Bloomberg futures: S&P futures are up 4, and DOW futures are up 29 (fair value).
Oil prices were down slightly over the last week with WTI futures at $53.69 per barrel and Brent at $56.14 per barrel. A year ago, WTI was at $29, and Brent was at $32 - so oil prices are up sharply year-over-year.
Here is a graph from Gasbuddy.com for nationwide gasoline prices. Nationally prices are at $2.28 per gallon - a year ago prices were at $1.72 per gallon - so gasoline prices are up about 55 cents a gallon year-over-year.
Post from 2005: Mortgage Debt and the "Recovery"
by Calculated Risk on 2/20/2017 12:49:00 PM
Here are some excerpts from a post I wrote in February 2005 (hard to believe this was 12 years ago).
Note: I think I've improved the graphs since then! From 2005:
The following chart shows household mortgage debt as a % of GDP. Although mortgage debt has been increasing for years, the last four years have seen a tremendous increase in debt. Last year alone mortgage debt increased close to $800 Billion - almost 7% of GDP.
Source: Federal Reserve


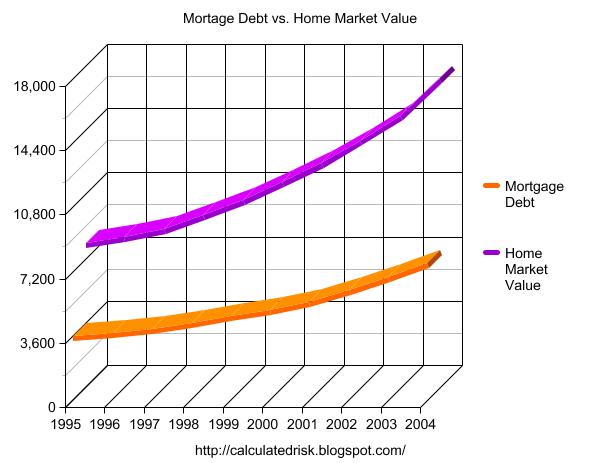
Some obervers have remarked that mortgage debt is still below 50% of household RE assets - and that is an accurate statement. In fact, if you plot mortgage debt vs. household RE assets everything looks reasonable.
Source: Federal Reserve
But lets plot household RE assets as a % of GDP.
Source: Federal Reserve
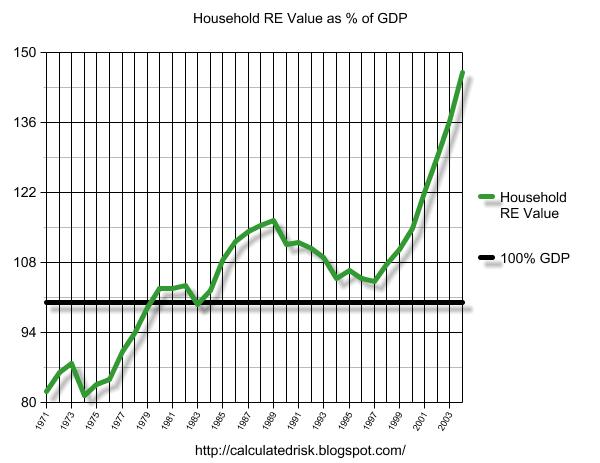
This final graph shows the potential problem. Household assets have really soared in the last few years. Many homeowners have refinanced their homes (or moved and taken cash out), in essence using their homes as an ATM.
It wouldn't take a RE bust to impact the general economy. Just a slowdown in both volume (to impact employment) and in prices (to slow down borrowing) might push the general economy into recession. An actual bust, especially with all of the extensive sub-prime lending, might cause a serious problem.
CR note: And a serious problem is what happened.
Fannie and Freddie: REO inventory declined in Q4, Down 33% Year-over-year
by Calculated Risk on 2/20/2017 10:36:00 AM
Fannie and Freddie reported results last week. Here is some information on Real Estate Owned (REOs).
Freddie Mac reported the number of REO declined to 11,418 at the end of Q4 2106 compared to 17,004 at the end of Q4 2015.
For Freddie, this is down 85% from the 74,897 peak number of REOs in Q3 2010. For Freddie, this is the lowest since at least 2007.
Fannie Mae reported the number of REO declined to 38,093 at the end of Q4 2016 compared to 57,253 at the end of Q4 2015.
For Fannie, this is down 77% from the 166,787 peak number of REOs in Q3 2010. For Fannie, this is the lowest since Q4 2007.
 Click on graph for larger image.
Here is a graph of Fannie and Freddie Real Estate Owned (REO).
REO inventory decreased in Q4 for both Fannie and Freddie, and combined inventory is down 33% year-over-year.
Delinquencies are falling, but there are still a number of properties in the foreclosure process with long time lines in judicial foreclosure states - but this is getting close to normal levels of REOs.
Sunday, February 19, 2017
Don't like the data? Change it!
by Calculated Risk on 2/19/2017 08:47:00 PM
From the WSJ: Trump Administration Considers Change in Calculating U.S. Trade Deficit
The Trump administration is considering changing the way it calculates U.S. trade deficits, a shift that would make the country’s trade gap appear larger than it had in past years ...I'm all for constantly evaluating methods, and improving data collection and reporting, but this - as reported - doesn't seem to make sense.
The leading idea under consideration would exclude from U.S. exports any goods first imported into the country, such as cars, and then transferred to a third country like Canada or Mexico unchanged, these people told The Wall Street Journal.
Economists say that approach would inflate trade deficit numbers because it would typically count goods as imports when they come into the country but not count the same goods when they go back out, known as re-exports.
If a car is imported to the U.S., and then is unchanged and exported to a third country, it seems there would be two choices: 1) Count it is an import AND an export, or 2) don't count it as either an import or export (it is just passing through). But counting the import and not the export makes as much sense as counting the export, but not the import. Crazy.
Demographics and GDP
by Calculated Risk on 2/19/2017 10:25:00 AM
Two years ago I wrote: Demographics and GDP: 2% is the new 4%. As I noted, "One simple way to look at the change in GDP is as the change in the labor force, times the change in productivity. If the labor force is growing quickly, GDP will be higher with the same gains in productivity. And the opposite is true."
Obviously demographics are important for GDP.
Last week, Goldman Sachs economist Daan Struyven wrote: Immigration Restrictions: A Downside Risk to the Economy's Speed Limit. Here are few excerpts from his note:
The contribution from net immigration to total population growth has risen from 30% in the 1990s to 40-50% recently as the natural increase in population has slowed. The effect of immigration on growth of the labor force is even more pronounced as immigrants tend to be younger and therefore more likely to participate in the labor force than the native-born population. As a result, net immigration currently accounts for virtually all of the 0.5% trend increase in the labor force.As Struyven notes, immigrations restrictions will lower potenetial GDP.
Reduced immigration would result in slower labor force growth and therefore slower growth in potential GDP—the economy’s “speed limit”. In addition, academic studies suggest there could be negative knock-on effects on productivity growth. As a result, we see immigration restrictions as an important source of downside risk to our 1.75% estimate of potential growth.
And yesterday, Professor Krugman wrote: Trump’s Rosy Scenario
The claimed returns to Trumpnomics are close to the highest growth rates we’ve seen under any modern administration. Real GDP grew 3.4 percent annually under Reagan; it grew 3.7 percent annually under Clinton ... But there are fundamental reasons to believe that such growth is unlikely to happen now.CR Note: It seems very unlikely that growth will pick up sharply, especially if there are severe immigration restrictions.
First, demography: Reagan took office with baby boomers — and women — still entering the work force; these days baby boomers are leaving. ... Just on demography alone, then, you’d expect growth to be around a percentage point lower than it was under Reagan.
Saturday, February 18, 2017
Schedule for Week of Feb 19, 2017
by Calculated Risk on 2/18/2017 08:11:00 AM
The key economic report this week are January New and Existing Home sales.
All US markets are closed in observance of the Presidents' Day holiday.
No major economic releases scheduled.
7:00 AM ET: The Mortgage Bankers Association (MBA) will release the results for the mortgage purchase applications index.
 10:00 AM: Existing Home Sales for January from the National Association of Realtors (NAR). The consensus is for 5.55 million SAAR, up from 5.49 million in December.
Housing economist Tom Lawler expects the NAR to report sales of 5.60 million SAAR in January.
During the day: The AIA's Architecture Billings Index for January (a leading indicator for commercial real estate).
2:00 PM: FOMC Minutes for the Meeting of January 31-February 1, 2017
8:30 AM ET: The initial weekly unemployment claims report will be released. The consensus is for 240 thousand initial claims, up from 239 thousand the previous week.
8:30 AM: Chicago Fed National Activity Index for January. This is a composite index of other data.
9:00 AM: FHFA House Price Index for December 2016. This was originally a GSE only repeat sales, however there is also an expanded index.
11:00 AM: the Kansas City Fed manufacturing survey for February.
 10:00 AM ET: New Home Sales for January from the Census Bureau.
 This graph shows New Home Sales since 1963. The dashed line is the December sales rate.
The consensus is for a increase in sales to 573 thousand Seasonally Adjusted Annual Rate (SAAR) in January from 536 thousand in December.
10:00 AM: University of Michigan's Consumer sentiment index (final for February). The consensus is for a reading of 96.0, up from the preliminary reading 95.7.
Friday, February 17, 2017
Lawler: Early Read on Existing Home Sales in January
by Calculated Risk on 2/17/2017 04:12:00 PM
From housing economist Tom Lawler: Early Read on Existing Home Sales in January
Based on publicly-available state and/or local realtor/MLS reports released through today, I project that US existing home sales as estimated by the National Association of Realtors ran at a seasonally adjusted annual rate of 5.60 million, up 2.0% from December’s preliminary pace and up 2.4% from last January’s seasonally-adjusted pace. Unadjusted sales should show a larger YOY gain, reflecting the higher business day count this January compared to last January. Remember that in the January report the NAR will update its seasonal factors (and as a result its seasonally adjusted sales figures) both for last year and for the previous several years.
Realtor data suggest that the YOY decline in existing homes for sale was larger in January than in December, and I project that the NAR’s inventory estimate will be 1,650, unchanged from the preliminary December estimate and down 9.3% from last January. Finally, realtor data suggest that the median existing SF home sales price in January was up about 6.1% from last January.
CR Note: The NAR is scheduled to release January existing home sales on Wednesday, February 22nd. The consensus is the NAR will report sales of 5.55 million SAAR.
AAR: Rail Traffic increased in January
by Calculated Risk on 2/17/2017 01:40:00 PM
From the Association of American Railroads (AAR) Rail Time Indicators. Graphs and excerpts reprinted with permission.
January 2017 wasn’t a great start of the year for U.S. rail traffic, but it wasn’t terrible either. Total carloads were up 2.9% (28,341) over last January, thanks mainly to a 35,798 (11.9%) increase in carloads of coal. ... Intermodal was down 1.8% on U.S. railroads in January 2017, but it was still the second-best January for intermodal on record.
 Click on graph for larger image.
This graph from the Rail Time Indicators report shows U.S. average weekly rail carloads (NSA). Dark blue is 2017.
Rail carloads have been weak over the last decade due to the decline in coal shipments.
U.S. railroads originated 996,573 total carloads in the four weeks of January 2017, up 2.9% (28,341 carloads) over January 2016. ...
Coal carloads were up 11.9% (35,798 carloads) in January 2017. Coal carloads had fallen so low last year there didn’t seem to be anywhere to go but up.
 The second graph is for intermodal traffic (using intermodal or shipping containers):
U.S. intermodal volume in January 2017 was down 1.8% from January 2016, as a 1.7% decline in containers joined a 3.0% decline in trailers. Still, weekly average volume of 255,267 containers and trailers in January 2017 was the second highest (behind last year) for January in history.
Quarterly Housing Starts by Intent
by Calculated Risk on 2/17/2017 11:06:00 AM
In addition to housing starts for January, the Census Bureau also released the Q4 "Started and Completed by Purpose of Construction" report last week.
It is important to remember that we can't directly compare single family housing starts to new home sales. For starts of single family structures, the Census Bureau includes owner built units and units built for rent that are not included in the new home sales report. For an explanation, see from the Census Bureau: Comparing New Home Sales and New Residential Construction
We are often asked why the numbers of new single-family housing units started and completed each month are larger than the number of new homes sold. This is because all new single-family houses are measured as part of the New Residential Construction series (starts and completions), but only those that are built for sale are included in the New Residential Sales series.However it is possible to compare "Single Family Starts, Built for Sale" to New Home sales on a quarterly basis.
The quarterly report released last week showed there were 138,000 single family starts, built for sale, in Q4 2016, and that was above the 126,000 new homes sold for the same quarter, so inventory increased in Q4 (Using Not Seasonally Adjusted data for both starts and sales).
This graph shows the NSA quarterly intent for four start categories since 1975: single family built for sale, owner built (includes contractor built for owner), starts built for rent, and condos built for sale.
 Click on graph for larger image.
Single family starts built for sale were up about 17% compared to Q4 2015.
Owner built starts were unchanged year-over-year. And condos built for sale not far above the record low.
The 'units built for rent' (blue) has increased significantly in recent years, but is now moving more sideways.
Phoenix Real Estate in January: Sales up 16%, Inventory down 8%
by Calculated Risk on 2/17/2017 08:47:00 AM
This is a key housing market to follow since Phoenix saw a large bubble and bust, followed by strong investor buying.
The Arizona Regional Multiple Listing Service (ARMLS) reports (table below):
1) Overall sales in January were up 15.9% year-over-year.
2) Cash Sales (frequently investors) were down to 27.1% of total sales.
3) Active inventory is now down 7.7% year-over-year.
More inventory (a theme in most of 2014) - and less investor buying - suggested price increases would slow sharply in 2014. And prices increases did slow in 2014, only increasing 2.4% according to Case-Shiller.
In 2015, with falling inventory, prices increased a little faster. Prices were up 6.3% in 2015 according to Case-Shiller.
This is the third consecutive month with a YoY decrease in inventory following eight months with YoY increases. This might be a change in trend - something to watch.
| January Residential Sales and Inventory, Greater Phoenix Area, ARMLS | ||||||
|---|---|---|---|---|---|---|
| Sales | YoY Change Sales | Cash Sales | Percent Cash | Active Inventory | YoY Change Inventory | |
| Jan-08 | 2,907 | --- | 553 | 19.0% | 56,8741 | --- |
| Jan-09 | 4,736 | 62.9% | 1,625 | 34.3% | 53,581 | -5.8% |
| Jan-10 | 5,789 | 22.2% | 2,475 | 42.8% | 41,506 | -22.5% |
| Jan-11 | 6,539 | 13.0% | 3,263 | 49.9% | 42,881 | 3.3% |
| Jan-12 | 6,455 | -1.3% | 3,198 | 49.5% | 25,025 | -41.6% |
| Jan-13 | 5,790 | -10.3% | 2,555 | 44.1% | 22,090 | -11.7% |
| Jan-14 | 4,799 | -17.1% | 1,740 | 36.3% | 28,630 | 29.6% |
| Jan-15 | 4,785 | -0.3% | 1,529 | 32.0% | 27,238 | -4.9% |
| Jan-16 | 5,199 | 8.7% | 1,425 | 27.4% | 25,736 | -5.5% |
| Jan-17 | 6,028 | 15.9% | 1,631 | 27.1% | 23,762 | -7.7% |
| 1 January 2008 probably included pending listings | ||||||


