 RSS Feed
 by Calculated Risk on 2/07/2017 02:11:00 PM
Tuesday, February 07, 2017
Las Vegas Real Estate in January: Sales up 13.9% YoY, Inventory down Sharply
This is a key distressed market to follow since Las Vegas has seen the largest price decline of any of the Case-Shiller composite 20 cities.
The Greater Las Vegas Association of Realtors reported Southern Nevada Home Prices Rise to Start 2017, GLVAR Housing Statistics for January 2017
The Greater Las Vegas Association of REALTORS® (GLVAR) reported Tuesday that Southern Nevada home prices started 2017 with a relatively rare January jump while the number of homes available for sale continued to shrink.1) Overall sales were up 13.9% year-over-year.
...
The total number of existing local homes, condos and townhomes sold in January was 2,675, up from 2,348 in January 2016. Compared to one year ago, sales were up 14.1 percent for homes and up 13.2 percent for condos and townhomes. According to GLVAR, a total of 41,720 such properties were sold in 2016. That was more than the 38,577 properties sold during 2015. It was also more than in 2014, but fewer than during each of the previous five years.
...
By the end of January, GLVAR reported 5,852 single-family homes listed for sale without any sort of offer. That’s down 21.2 percent from one year ago. For condos and townhomes, the 811 properties listed without offers in January represented a 63.4 percent decrease from one year ago.
...
In recent years, GLVAR has been reporting fewer distressed sales and more traditional home sales, where lenders are not controlling the transaction. That trend continued in January, when 4.2 percent of all local sales were short sales – which occur when lenders allow borrowers to sell a home for less than what they owe on the mortgage. That’s down from 7.0 percent of all sales in January 2016. Another 6.8 percent of all January sales were bank-owned, down from 7.9 percent one year ago.
emphasis added
2) Active inventory (single-family and condos) is down sharply from a year ago (A very sharp decline in condo inventory).
3) Fewer distressed sales.
BLS: Job Openings "little changed" in December
by Calculated Risk on 2/07/2017 10:06:00 AM
From the BLS: Job Openings and Labor Turnover Summary
The number of job openings was little changed at 5.5 million on the last business day of December, the U.S. Bureau of Labor Statistics reported today. Over the month, hires and separations were also little changed at 5.3 million and 5.0 million, respectively. ...The following graph shows job openings (yellow line), hires (dark blue), Layoff, Discharges and other (red column), and Quits (light blue column) from the JOLTS.
...
The number of quits was little changed in December at 3.0 million. The quits rate was 2.0 percent. Over the month, the number of quits was little changed for total private and for government.
emphasis added
This series started in December 2000.
Note: The difference between JOLTS hires and separations is similar to the CES (payroll survey) net jobs headline numbers. This report is for December, the most recent employment report was for January.
 Click on graph for larger image.
Note that hires (dark blue) and total separations (red and light blue columns stacked) are pretty close each month. This is a measure of labor market turnover. When the blue line is above the two stacked columns, the economy is adding net jobs - when it is below the columns, the economy is losing jobs.
Jobs openings were mostly unchanged in December at 5.501 million compared to 5.505 million in November. Job openings are mostly moving sideways at a high level.
The number of job openings (yellow) are up 4% year-over-year.
Quits are down 3% year-over-year. These are voluntary separations. (see light blue columns at bottom of graph for trend for "quits").
This is another solid report.
CoreLogic: House Prices up 7.2% Year-over-year in December
by Calculated Risk on 2/07/2017 09:07:00 AM
Notes: This CoreLogic House Price Index report is for December. The recent Case-Shiller index release was for November. The CoreLogic HPI is a three month weighted average and is not seasonally adjusted (NSA).
From CoreLogic: CoreLogic US Home Price Report Shows Prices Up 7.2 Percent in December 2016
Home prices nationwide, including distressed sales, increased year over year by 7.2 percent in December 2016 compared with December 2015 and increased month over month by 0.8 percent in December 2016 compared with November 2016, according to the CoreLogic HPI.
...
“As of the end of 2016, the CoreLogic national index was 3.9 percent below the peak reached in April 2006,” said Dr. Frank Nothaft, chief economist for CoreLogic. “We expect our national index to rise 4.7 percent during 2017, which would put homes prices at a new nominal peak before the end of this year.”
“Last year ended with a bang with home prices up over 7 percent nationally, led largely by major metro areas,” said Anand Nallathambi, president and CEO of CoreLogic. “We expect prices to continue to rise just under 5 percent in 2017 buoyed by lack of supply and continued high demand.”
emphasis added
 Click on graph for larger image.
 This graph shows the national CoreLogic HPI data since 1976. January 2000 = 100.
The index was up 0.8% in December (NSA), and is up 7.2% over the last year.
This index is not seasonally adjusted, and this was another solid month-to-month increase.
The index is still 3.9% below the bubble peak in nominal terms (not inflation adjusted).
 The second graph shows the YoY change in nominal terms (not adjusted for inflation).
The YoY increase had been moving sideways over the last two years, but might have picked up recently (the recent pickup could be revised away).
The year-over-year comparison has been positive for almost five consecutive years since turning positive year-over-year in February 2012.
Trade Deficit at $44.3 Billion in December
by Calculated Risk on 2/07/2017 08:51:00 AM
From the Department of Commerce reported:
The U.S. Census Bureau and the U.S. Bureau of Economic Analysis, through the Department of Commerce, announced today that the goods and services deficit was $44.3 billion in December, down $1.5 billion from $45.7 billion in November, revised. December exports were $190.7 billion, $5.0 billion more than November exports. December imports were $235.0 billion, $3.6 billion more than November imports.The trade deficit was smaller than the consensus forecast.
...
For 2016, the goods and services deficit increased $1.9 billion, or 0.4 percent, from 2015. Exports decreased $51.7 billion or 2.3 percent. Imports decreased $49.9 billion or 1.8 percent.
The first graph shows the monthly U.S. exports and imports in dollars through December 2016.
 Click on graph for larger image.
Imports and exports increased in December.
Exports are 15% above the pre-recession peak and up 4% compared to December 2015; imports are slightly above the pre-recession peak, and up 5% compared to December 2015.
It appears trade might is picking up a little.
The second graph shows the U.S. trade deficit, with and without petroleum.
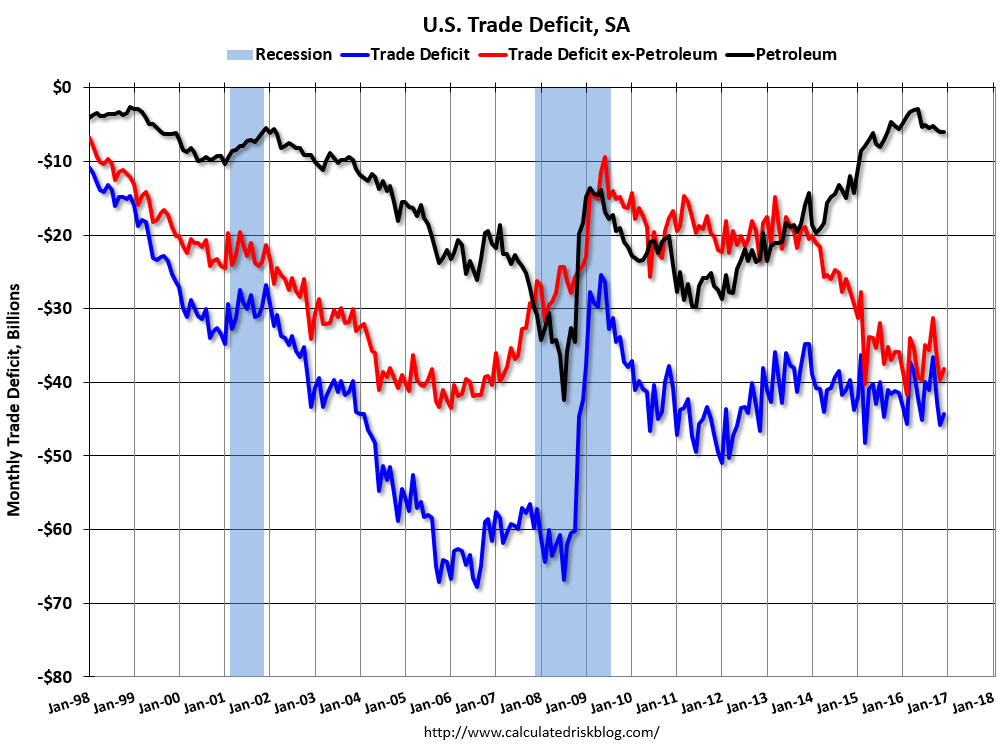 The blue line is the total deficit, and the black line is the petroleum deficit, and the red line is the trade deficit ex-petroleum products.
Oil imports averaged $41.45 in December, up from $40.82 in November, and up from $36.63 in December 2015. The petroleum deficit has generally been declining and is the major reason the overall deficit has declined a little since early 2012.
The trade deficit with China decreased to $27.8 billion in November, from $27.9 billion in December 2015. The deficit with China is a substantial portion of the overall deficit, but the deficit with China has generally been declining.
Monday, February 06, 2017
Tuesday: Trade Deficit, Job Openings
by Calculated Risk on 2/06/2017 07:27:00 PM
Tuesday:
• At 6:00 AM ET, NFIB Small Business Optimism Index for January.
• At 8:30 AM, Trade Balance report for December from the Census Bureau. The consensus is for the U.S. trade deficit to be at $44.9 billion in December from $45.2 billion in November.
• At 10:00 AM, Job Openings and Labor Turnover Survey for December from the BLS. Jobs openings increased in November to 5.522 million from 5.451 million in October. The number of job openings (yellow) were up 6% year-over-year, and Quits were up 7% year-over-year.
• At 3:00 PM, Consumer credit from the Federal Reserve. The consensus is for a $20.0 billion increase in credit.
U.S. Courts: Bankruptcy Filings Drop 6 Percent in 2016, Lowest since 2006
by Calculated Risk on 2/06/2017 04:06:00 PM
From the U.S. Courts: Bankruptcy Filings Fall 5.9%, Reach Lowest Level Since 2006
During the 12-month period ending December 31, 2016, 794,960 cases were filed in federal bankruptcy courts, down from the 844,495 bankruptcy cases filed in calendar year 2015—a 5.9 percent drop in filings.
This is the lowest number of bankruptcy filings for any calendar year since 2006, and the sixth consecutive calendar year that filings have fallen. However, it was the first calendar year since 2011 that the rate of annual decline was less than 10 percent.
 Click on graph for larger image.
This graph shows the business and non-business bankruptcy filings by calendar year since 2001.
The sharp decline in 2006 was due to the so-called "Bankruptcy Abuse Prevention and Consumer Protection Act of 2005". (a good example of Orwellian named legislation since this was more a "Lender Protection Act").
Other than 2006, this was the lowest level for filings since 1995. This is another indicator of an economy mostly recovered from the housing bust and financial crisis.
More Rain in California!
by Calculated Risk on 2/06/2017 01:01:00 PM
California has been enduring a five year drought, but it keeps raining in SoCal and snowing in the mountains this year. For much of the state, the drought is over.
Here are a few resources to track the rain and snow.
These tables show the snowpack in the North, Central and South Sierra. Currently the snowpack is about 145% of normal for this date in the North, 174% of normal in the Central Sierra, and 198% of normal in the Southern Sierra.
And here are some plots comparing the current and previous years to the average, a very dry year ('14-'15) and a wet year ('82-'83). This winter is already above the average and close to the record winter of '82-'83.
And for Los Angeles, here is a historical table of annual rainfall. After five years of significantly below average rainfall, this year is well above normal and the rain is still falling.
This is good news for the state and the state economy.
 For Pacific Crest Trail and John Muir Trail hikers, I recommend using the Upper Tyndall Creek sensor to track the snow conditions. This graph shows the snow water content for Upper Tyndall Creek for the last 40 years. Note: I hiked the trail in September 1998 - a very wet year - and there was snow all year on Mt. Whitney.
There were four very dry years in a row, and then last winter was a little better - but still below normal.
For the Tyndall Creek area, this is the fifth wettest year in the last 20 years - and it is still early February!
Black Knight: "7.4 million homes lost to foreclosure sale since 2007"
by Calculated Risk on 2/06/2017 10:01:00 AM
Black Knight Financial Services (BKFS) released their Mortgage Monitor report for December today. According to BKFS, 4.42% of mortgages were delinquent in December, down from 4.78% in December 2015. BKFS also reported that 0.95% of mortgages were in the foreclosure process, down from 1.37% a year ago.
This gives a total of 5.37% delinquent or in foreclosure.
Press Release: Black Knight’s Mortgage Monitor: Historical Data Suggests Up to 300,000 Delinquent Borrowers May Use Tax Refunds to Pay Mortgages Current; Affordability Suffers from Rate Increases
Today, the Data & Analytics division of Black Knight Financial Services, Inc. (NYSE: BKFS) released its latest Mortgage Monitor Report, based on data as of the end of December 2016. This month, Black Knight examined Internal Revenue Service (IRS) tax filing statistics in conjunction with mortgage performance data to quantify potential impacts of the upcoming tax season on the mortgage market. As Black Knight Data & Analytics Executive Vice President Ben Graboske explained, there has historically been a distinct correlation between income tax refund disbursements and delinquent mortgages curing to current status.
“Looking at IRS filing statistics, we see that nearly one in five Americans file their returns within the first two weeks of tax season, and over 40 percent had completed their taxes by the first week in March,” said Graboske. “Unsurprisingly, incentive played a big role in this timing; not only were Americans who filed early more likely to receive a refund than those filing later, but they also received larger refunds on average. Likewise, mortgage cures -- delinquent borrowers who bring themselves back to current status -- correspondingly spike in February and March as well, suggesting that some portion of Americans are using their tax refunds to make past-due payments on their mortgages. In recent years, this has meant nearly 300,000 borrowers on average paying their loans current in February and March alone, on top of normal cure volumes for the typical month. All things being equal, there’s no reason to expect this tax season to be any different.
“We see this increase in cures across the delinquency and foreclosure spectrum, but it is most pronounced in the early and moderate stages of delinquency. ...”
emphasis added
 Click on graph for larger image.
This graph from Black Knight shows the number of foreclosure starts (and repeat foreclosures) per year.
From Black Knight:
• Nearly 790K mortgages were referred to foreclosure in 2016; 57 percent of these were repeats (mortgages that had been referred to foreclosure at least once previously)
• 335K first time foreclosure starts is the lowest oneyear total since before the turn of the century, and was actually 20 percent below what we saw in 2015
• As of Q4 2016, over 13 million foreclosures had been initiated since 2007
 This graph from Black Knight shows foeclosure sales per year:
From Black Knight:
• There were 309K foreclosure sales in 2016, marking a 19 percent decline from 2015 and the lowest yearly total since 2005There is much more in the mortgage monitor.
• This is still slightly elevated from historical perspective; 2000-2005 averaged ~275k foreclosure sales/year
• Overall there have now been 7.4 million homes lost to foreclosure sale since 2007
Sunday Night Futures
by Calculated Risk on 2/06/2017 12:21:00 AM
Weekend:
• Schedule for Week of Feb 5, 2017
• Oil: "Another huge week" for total US oil rigs, Pressure on OPEC deal
• Goldman on the Trump Agenda
From CNBC: Pre-Market Data and Bloomberg futures: S&P futures are down 2, and DOW futures are down 10 (fair value).
Oil prices were up over the last week with WTI futures at $54.00 per barrel and Brent at $56.98 per barrel. A year ago, WTI was at $33, and Brent was at $33 - so oil prices are up sharply year-over-year.
Here is a graph from Gasbuddy.com for nationwide gasoline prices. Nationally prices are at $2.26 per gallon - a year ago prices were at $1.76 per gallon - so gasoline prices are up 50 cents a gallon year-over-year.
Sunday, February 05, 2017
Goldman on the Trump Agenda
by Calculated Risk on 2/05/2017 11:15:00 AM
On Thursday I wrote Some Random Concerns and Observations .... One of my observations was that after the election, many analysts thought the priorities of the new administration would be tax cuts, infrastructure spending, and deregulation. And the analysts thought that the negative economic policies on immigration and trade would be delayed until at least 2018. So far the new administration has delayed the policies with potential short term economic benefits - and pushed the negative policies.
From CNBC: US political, economic risks mounting against Trump's agenda, Goldman Sachs says
The policy halo effect that provided ballast to the stock market and fueled investor optimism is already being dimmed by political realities, according to Goldman Sachs, which may have negative implications for economic growth.Here are a few excepts from the Goldman Sachs note by economist Alex Phillips mentioned in the CNBC article:
In a note to clients on Friday, the investment bank noted President Donald Trump's agenda was already running into bipartisan political resistance, with doubts growing about potential tax reform and a repeal of the Affordable Care Act, among other marquee Trump administration initiatives.
• The Trump Agenda presents risks in both directions; tax cuts and infrastructure funding could boost growth but could be offset by the negative effects of restrictions on trade and immigration.
• Following the election, the positive shift in sentiment among investors, business, and consumers suggested that the probability of tax cuts and easier regulation was seen to be higher than the probability of meaningful restrictions to trade and immigration.
• One month into the year, the balance of risks is somewhat less positive in our view, for three reasons. First, the recent difficulty congressional Republicans have had in moving forward on Obamacare repeal does not bode well for reaching a quick agreement on tax reform or infrastructure funding, and reinforces our view that a fiscal boost, if it happens, is mostly a 2018 story.
• Second, while bipartisan cooperation looked possible on some issues following the election, the political environment appears to be as polarized as ever, suggesting that issues that require bipartisan support may be difficult to address.
• Third, some of the recent administrative actions by the Trump Administration serve as a reminder that the president is likely to follow through on campaign promises on trade and immigration, some of which could be disruptive for financial markets and the real economy.


