 RSS Feed
 by Calculated Risk on 8/30/2016 09:13:00 AM
Tuesday, August 30, 2016
Case-Shiller: National House Price Index increased 5.1% year-over-year in June
S&P/Case-Shiller released the monthly Home Price Indices for June ("June" is a 3 month average of April, May and June prices).
This release includes prices for 20 individual cities, two composite indices (for 10 cities and 20 cities) and the monthly National index.
Note: Case-Shiller reports Not Seasonally Adjusted (NSA), I use the SA data for the graphs.
From S&P: Home Price Gains in June Concentrated in South and West According to the S&P CoreLogic Case-Shiller Indices
The S&P CoreLogic Case-Shiller U.S. National Home Price NSA Index, covering all nine U.S. census divisions, reported a 5.1% annual gain in June, unchanged from last month. The 10-City Composite posted a 4.3% annual increase, down from 4.4% the previous month.The 20-City Composite reported a year-over-year gain of 5.1%, down from 5.3% in May.
...
Before seasonal adjustment, the National Index posted a month-over-month gain of 1.0% while both the 10-City Composite and the 20-City Composite posted a 0.8% increase in June. After seasonal adjustment, the National Index recorded a 0.2% month-over-month increase, and both the 10-City Composite and 20-City Composite posted 0.1% month-over-month decreases. After seasonal adjustment, nine cities saw prices rise, two cities were unchanged, and nine cities experienced negative monthly prices changes.
emphasis added
 Click on graph for larger image.
 The first graph shows the nominal seasonally adjusted Composite 10, Composite 20 and National indices (the Composite 20 was started in January 2000).
The Composite 10 index is off 11.1% from the peak, and down 0.1% in June (SA).
The Composite 20 index is off 9.1% from the peak, and down 0.1% (SA) in June.
The National index is off 2.6% from the peak, and up 0.2% (SA) in June. The National index is up 31.6% from the post-bubble low set in December 2011 (SA).
 The second graph shows the Year over year change in all three indices.
The Composite 10 SA is up 4.3% compared to June 2015.
The Composite 20 SA is up 5.1% year-over-year.
The National index SA is up 5.1% year-over-year.
Note: According to the data, prices increased in 10 of 20 cities month-over-month seasonally adjusted.
I'll have more later.
Tuesday: Case-Shiller House Prices
by Calculated Risk on 8/30/2016 01:00:00 AM
Tuesday:
• At 9:00 AM ET, b>S&P/Case-Shiller House Price Index for June. Although this is the June report, it is really a 3 month average of April, May and June prices. The consensus is for a 5.2% year-over-year increase in the Comp 20 index for June. The Zillow forecast is for the National Index to increase 5.1% year-over-year in June.
From Matthew Graham at Mortgage News Daily: Mortgage Rates Battle Back From Recent Highs
Mortgage Rates were briefly at their highest levels in several weeks on Friday afternoon. This followed comments from the Fed's Jackson Hole symposium. Markets interpreted those comments as the Fed being more likely to hike rates in 2016--possibly even twice! While mortgage rates are based on MBS (mortgage-backed-securities), as opposed to the Fed Funds Rate (the thing the Fed is talking about hiking), if investors think the Fed is more likely to hike, MBS tend to lose some ground.
emphasis added
Monday, August 29, 2016
Lawler: Table of Distressed Sales and All Cash Sales for Selected Cities in July
by Calculated Risk on 8/29/2016 03:11:00 PM
Economist Tom Lawler sent me the table below of short sales, foreclosures and all cash sales for selected cities in July.
On distressed: Total "distressed" share is down year-over-year in all of these markets (except Springfield).
Short sales and foreclosures are down in all of these areas.
The All Cash Share (last two columns) is mostly declining year-over-year. As investors continue to pull back, the share of all cash buyers continues to decline.
| Short Sales Share | Foreclosure Sales Share | Total "Distressed" Share | All Cash Share | |||||
|---|---|---|---|---|---|---|---|---|
| July- 2016 | July- 2015 | July- 2016 | July- 2015 | July- 2016 | July- 2015 | July- 2016 | July- 2015 | |
| Las Vegas | 5.7% | 7.1% | 5.9% | 7.7% | 11.6% | 14.8% | 25.8% | 27.1% |
| Reno** | 3.0% | 3.0% | 1.0% | 2.0% | 4.0% | 5.0% | ||
| Phoenix | 1.6% | 2.8% | 2.2% | 3.4% | 3.8% | 6.3% | 19.7% | 21.9% |
| Sacramento | 2.6% | 4.7% | 2.1% | 4.6% | 4.7% | 9.3% | 14.4% | 18.1% |
| Minneapolis | 1.0% | 2.0% | 3.6% | 5.5% | 4.6% | 7.5% | 11.3% | 11.7% |
| Mid-Atlantic | 2.7% | 3.4% | 7.6% | 9.4% | 10.4% | 12.8% | 15.0% | 15.8% |
| So. California* | 4.9% | 7.1% | 19.6% | 21.6% | ||||
| Bay Area CA* | 3.2% | 4.7% | 18.6% | 20.1% | ||||
| Florida SF | 2.4% | 3.4% | 8.0% | 16.3% | 10.4% | 19.7% | 26.6% | 32.6% |
| Florida C/TH | 1.6% | 2.4% | 7.0% | 15.2% | 8.6% | 17.6% | 53.7% | 59.1% |
| Miami MSA SF | 3.8% | 5.1% | 9.5% | 16.5% | 13.4% | 21.6% | 27.9% | 31.8% |
| Miami MSA C/TH | 1.7% | 3.5% | 9.5% | 18.8% | 11.2% | 22.2% | 56.7% | 61.9% |
| Tampa MSA SF | 2.8% | 3.6% | 8.3% | 16.4% | 11.1% | 20.0% | 25.7% | 33.9% |
| Tampa MSA C/TH | 1.6% | 2.0% | 6.7% | 14.8% | 8.3% | 16.8% | 50.2% | 56.1% |
| Chicago (city) | 10.5% | 13.5% | ||||||
| Northeast Florida | 12.8% | 26.3% | ||||||
| Spokane | 5.7% | 9.1% | ||||||
| Tucson | 21.6% | 23.7% | ||||||
| Orlando | 28.4% | 34.5% | ||||||
| Toledo | 24.3% | 27.0% | ||||||
| S.C. Wisconsin | 14.4% | 15.2% | ||||||
| Knoxville | 20.6% | 21.8% | ||||||
| Peoria | 22.7% | 15.6% | ||||||
| Georgia*** | 18.5% | 20.3% | ||||||
| Omaha | 13.0% | 13.2% | ||||||
| Pensacola | 28.0% | 28.5% | ||||||
| Rhode Island | 7.8% | 8.8% | ||||||
| Richmond VA | 6.0% | 8.4% | 15.9% | 18.1% | ||||
| Memphis | 8.1% | 12.8% | ||||||
| Springfield IL** | 6.3% | 4.7% | ||||||
| *share of existing home sales, based on property records **Single Family Only ***GAMLS | ||||||||
Black Knight: House Price Index up 0.8% in June, Up 5.3% year-over-year
by Calculated Risk on 8/29/2016 12:53:00 PM
Note: I follow several house price indexes (Case-Shiller, CoreLogic, Black Knight, Zillow, FHFA, FNC and more). Note: Black Knight uses the current month closings only (not a three month average like Case-Shiller or a weighted average like CoreLogic), excludes short sales and REOs, and is not seasonally adjusted.
From Black Knight: Black Knight Home Price Index Report: June 2016 Transaction
• U.S. Home Prices Up 0.8 Percent for the Month; Up 5.3 Percent Year-Over-YearThe year-over-year increase in this index has been about the same for the last year.
• At $265K, the U.S. HPI is up 32.6 percent from the market's bottom and is within just 1.1 percent of a new national peak
• Home prices in six of the nation's 20 largest states and 14 of the 40 largest metros hit new peaks in June
Note that house prices are close to the bubble peak in nominal terms, but not adjusted for inflation.
Dallas Fed: Regional Manufacturing Activity Increases in August
by Calculated Risk on 8/29/2016 10:41:00 AM
From the Dallas Fed: Texas Manufacturing Activity Increases
Texas factory activity increased in August, according to business executives responding to the Texas Manufacturing Outlook Survey. The production index, a key measure of state manufacturing conditions, came in at 4.5 after a near-zero reading in July, suggesting output picked up this month.The impact of lower oil prices is still impacting manufacturing.
Other measures of current manufacturing activity also reflected expansion. Demand bounced back, with the new orders index rising from -8.0 to 5.3 in August and the growth rate of orders index pushing up to 2.1, its first positive reading in nearly two years. The capacity utilization index remained only barely positive at 0.9, while the shipments index rose nearly 10 points to 9.9, with nearly a third of manufacturers reporting higher volumes of shipments this month.
Perceptions of broader business conditions remained fairly pessimistic. The general business activity index was negative for a 20th month in a row and moved down from -1.3 to -6.2. The company outlook index was largely unchanged at -2.8.
Labor market measures indicated slight employment declines and shorter workweek length. The employment index came in at -5.0, down from -2.6 last month. ...
emphasis added
This was the last of the regional Fed surveys for August.
Here is a graph comparing the regional Fed surveys and the ISM manufacturing index:
 Click on graph for larger image.
The New York and Philly Fed surveys are averaged together (yellow, through August), and five Fed surveys are averaged (blue, through August) including New York, Philly, Richmond, Dallas and Kansas City. The Institute for Supply Management (ISM) PMI (red) is through July (right axis).
It seems likely the ISM manufacturing index will be lower in August than in July.
Personal Income increased 0.4% in July, Spending increased 0.3%
by Calculated Risk on 8/29/2016 08:41:00 AM
The BEA released the Personal Income and Outlays report for July:
Personal income increased $71.6 billion (0.4 percent) in July according to estimates released today by the Bureau of Economic Analysis ... personal consumption expenditures (PCE) increased $42.0 billion (0.3 percent).The July PCE price index increased 0.8 percent year-over-year and the July PCE price index, excluding food and energy, increased 1.6 percent year-over-year.
...
Real PCE increased 0.3 percent. The PCE price index was unchanged from June. Excluding food and energy, the PCE price index increased 0.1 percent in July.
The following graph shows real Personal Consumption Expenditures (PCE) through July 2016 (2009 dollars). Note that the y-axis doesn't start at zero to better show the change.
 Click on graph for larger image.
The dashed red lines are the quarterly levels for real PCE.
Both the increase in personal income and the increase in PCE was at consensus expectations.
A solid start for Q3.
Sunday, August 28, 2016
Monday: Personal Income and Outlays
by Calculated Risk on 8/28/2016 08:02:00 PM
Weekend:
• Schedule for Week of Aug 28, 2016
Monday:
• At 8:30 AM ET, Personal Income and Outlays for July. The consensus is for a 0.4% increase in personal income, and for a 0.3% increase in personal spending. And for the Core PCE price index to increase 0.1%.
• At 10:30 AM, Dallas Fed Survey of Manufacturing Activity for August.
From CNBC: Pre-Market Data and Bloomberg futures: S&P and DOW futures are mostly unchanged (fair value).
Oil prices were down over the last week with WTI futures at $47.14 per barrel and Brent at $49.46 per barrel. A year ago, WTI was at $45, and Brent was at $48 - so prices are mostly unchanged year-over-year.
Here is a graph from Gasbuddy.com for nationwide gasoline prices. Nationally prices are at $2.21 per gallon (down about $0.30 per gallon from a year ago).
Freddie Mac: Mortgage Serious Delinquency rate unchanged in July
by Calculated Risk on 8/28/2016 10:33:00 AM
Freddie Mac reported that the Single-Family serious delinquency rate was unchanged in July at 1.08%, the same as in June. Freddie's rate is down from 1.48% in July 2015.
This ties the lowest rate since July 2008.
Freddie's serious delinquency rate peaked in February 2010 at 4.20%.
These are mortgage loans that are "three monthly payments or more past due or in foreclosure".
 Click on graph for larger image
Although the rate is generally declining, the "normal" serious delinquency rate is under 1%.
The Freddie Mac serious delinquency rate has fallen 0.40 percentage points over the last year, and at that rate of improvement, the serious delinquency rate will be below 1% in two or three months.
Note: Fannie Mae will report in the next few days.
Saturday, August 27, 2016
Schedule for Week of Aug 28, 2016
by Calculated Risk on 8/27/2016 08:09:00 AM
The key report this week is the August employment report on Friday.
Other key indicators include Personal Income and Outlays for July, the Case-Shiller House Price Index for June, the August ISM manufacturing and non-manufacturing indexes, August auto sales, and the July trade deficit.
8:30 AM: Personal Income and Outlays for July. The consensus is for a 0.4% increase in personal income, and for a 0.3% increase in personal spending. And for the Core PCE price index to increase 0.1%.
10:30 AM ET: Dallas Fed Survey of Manufacturing Activity for August.
 9:00 AM: S&P/Case-Shiller House Price Index for June. Although this is the June report, it is really a 3 month average of April, May and June prices.
This graph shows the nominal seasonally adjusted National Index, Composite 10 and Composite 20 indexes through the May 2016 report (the Composite 20 was started in January 2000).
The consensus is for a 5.2% year-over-year increase in the Comp 20 index for June. The Zillow forecast is for the National Index to increase 5.1% year-over-year in June.
7:00 AM ET: The Mortgage Bankers Association (MBA) will release the results for the mortgage purchase applications index.
8:15 AM: The ADP Employment Report for August. This report is for private payrolls only (no government). The consensus is for 175,000 payroll jobs added in August, down from 179,000 added in July.
9:45 AM: Chicago Purchasing Managers Index for August. The consensus is for a reading of 55.2, down from 55.8 in July.
10:00 AM: Pending Home Sales Index for July. The consensus is for a 0.6% increase in the index.
8:30 AM ET: The initial weekly unemployment claims report will be released. The consensus is for 265 thousand initial claims, up from 261 thousand the previous week.
 10:00 AM: ISM Manufacturing Index for August. The consensus is for the ISM to be at 52.2, down from 52.6 in July.
Here is a long term graph of the ISM manufacturing index.
The ISM manufacturing index indicated expansion at 52.6% in July. The employment index was at 49.4%, and the new orders index was at 56.9%.
10:00 AM: Construction Spending for July. The consensus is for a 0.6% increase in construction spending.
 All day: Light vehicle sales for August. The consensus is for light vehicle sales to decrease to 17.1 million SAAR in August, from 17.8 million in July (Seasonally Adjusted Annual Rate).
This graph shows light vehicle sales since the BEA started keeping data in 1967. The dashed line is the July sales rate.
8:30 AM: Employment Report for August. The consensus is for an increase of 175,000 non-farm payroll jobs added in August, down from the 255,000 non-farm payroll jobs added in July.
The consensus is for the unemployment rate to decrease to 4.8%.
 This graph shows the year-over-year change in total non-farm employment since 1968.
In July, the year-over-year change was 2.45 million jobs.
A key will be the change in wages.
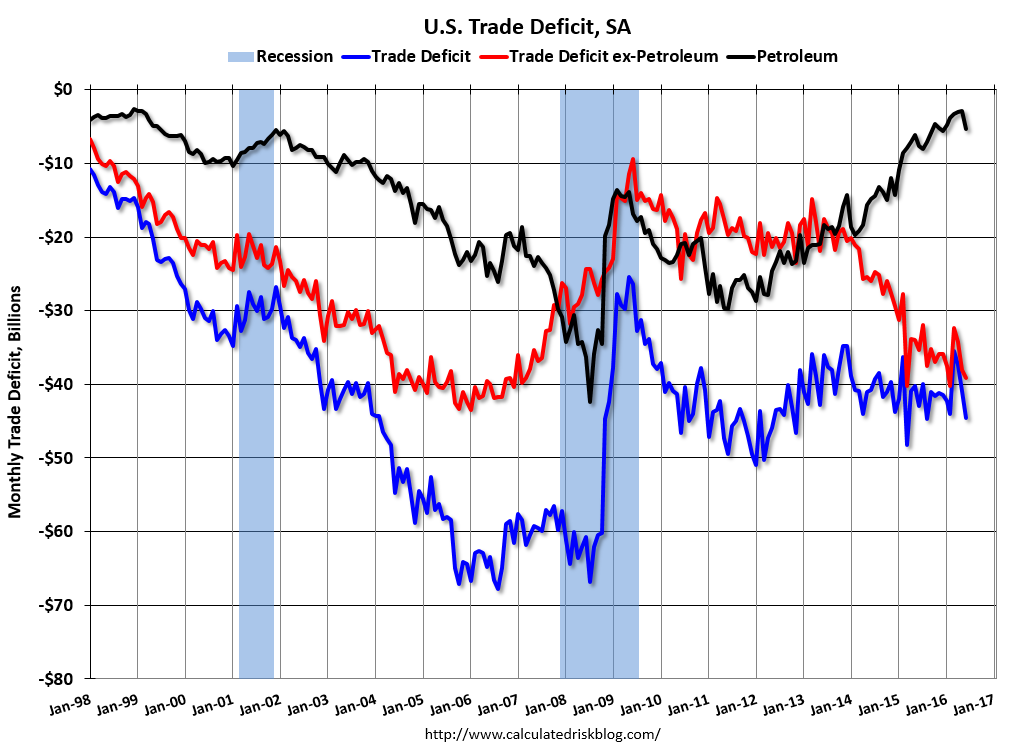 8:30 AM: Trade Balance report for July from the Census Bureau.
 This graph shows the U.S. trade deficit, with and without petroleum, through June. The blue line is the total deficit, and the black line is the petroleum deficit, and the red line is the trade deficit ex-petroleum products.
The consensus is for the U.S. trade deficit to be at $41.3 billion in July from $44.5 billion in June.
10:00 AM: Manufacturers' Shipments, Inventories and Orders (Factory Orders) for July. The consensus is a 2.0% increase in orders.
Friday, August 26, 2016
August 2016: Unofficial Problem Bank list declines to 184 Institutions
by Calculated Risk on 8/26/2016 07:49:00 PM
This is an unofficial list of Problem Banks compiled only from public sources.
Here is the unofficial problem bank list for August 2016.
Changes and comments from surferdude808:
Update on the Unofficial Problem Bank List for August 2016. During the month, the list declined by a net 12 institutions from 196 to 184. The net change of 12 institutions results from 14 removals and two additions. Assets dropped by $2.3 billion to an aggregate $56.5 billion, with $350 million of the decline coming from updated figures for the second quarter. A year ago, the list held 282 institutions with assets of $82.7 billion. This week, we were anticipating for the FDIC to release second quarter industry results and an update on the Official Problem Bank List, but that will have to wait until next month's update.
Actions have been terminated against SpiritBank, Tulsa, OK ($767 million); Tennessee State Bank, Pigeon Forge, TN ($641 million); First American State Bank, Greenwood Village, CO ($279 million); First National Bank, Camdenton, MO ($206 million); Cornerstone Bank, Overland Park, KS ($159 million); Friends Bank, New Smyrna Beach, FL ($104 million Ticker: FRIE); New Jersey Community Bank, Freehold, NJ ($103 million); GSL Savings Bank, Guttenberg, NJ ($91 million); RepublicBankAZ, N.A., Phoenix, AZ ($90 million); and FirstSecure Bank and Trust Co., Palos Hills, IL ($61 million).
Several banks merged to find their way off the problem bank list including Hopkins Federal Savings Bank, Baltimore, MD ($229 million); Harvard Savings Bank, Harvard, IL ($142 million); and The Bank of Oswego, Lake Oswego, OR ($61 million).
In the very hard to believe category, another bank headquartered in Georgia -- The Woodbury Banking Company, Woodbury, GA ($22 million) – found its way off the list through failure. Since the on-set of the Great Recession, 91 institutions headquartered in Georgia have failed. Of the 352 institutions open at year-end 2007 in Georgia, 91 or nearly 26 percent have failed, which is more than four times the national failure rate of 6 percent. It begs the question, how is it possible for there to be any banks left in the state that could fail.
Nationwide, since the on-set of the Great Recession, 533 institutions with assets of nearly $4 trillion have failed or received open-bank assistance. To put this in context, there were 8,544 institutions with assets of $13.1 trillion open in the U.S. at year-end 2007. Thus, 6.2 percent of institutions that held 30.3 percent of assets have failed or received open-bank assistance. In comparison, from 1980 through 1994, a period most consider as the most severe banking crisis since the Great Depression, 9.1% of institutions holding nearly 9.0% of assets failed or received open-bank assistance. So while the failure rate is lower in this episode, the share of assets is significantly greater. In the 1990s, the FDIC produced comprehensive research (“History of the Eighties”) to understand the causes of that crisis and identify ways to limit a future crisis. In response, FDIC Chairman Ricki Helfer spearheaded the formation of a new division to identify emerging systemic risks in the industry. In a 1996 speech, FDIC Chairman Helfer said “Neither we nor the industry we supervise can afford being so wrong again. The speed of technology and the rapid innovations in the marketplace mean that trouble could come quickly and in large numbers. We need to avoid being that wrong again by monitoring trends more broadly and taking specific action on the information we receive.” But somehow the FDIC’s division designed specifically to identify a widespread banking crisis got it way wrong. The lack of a major research effort by the FDIC to understand what went wrong in this current episode should be concerning to all industry observers.


