by Calculated Risk on 7/01/2016 06:09:00 PM
Friday, July 01, 2016
"6-Day Winning Streak Leaves Mortgage Rates Near All-Time Lows"
From Matthew Graham at Mortgage News Daily: 6-Day Winning Streak Leaves Rates Near All-Time Lows
Mortgage rates fell moderately today, adding a 6th day to a winning streak that began with last week's Brexit news and bringing rates right to the brink of all-time lows.... bringing some lenders from 3.625% to 3.375%, which is now the most prevalently-quoted conventional 30yr fixed rate on top tier scenarios.Here is a table from Mortgage News Daily:
Why is 3.375% important? Simply put, the next time rates move a notch lower, they'll be back to official all-time lows. In fact, 3.375% is the lowest rate that markets were able to maintain for more than a day or two back in 2012.
emphasis added
U.S. Light Vehicle Sales decrease to 16.6 million annual rate in June
by Calculated Risk on 7/01/2016 03:00:00 PM
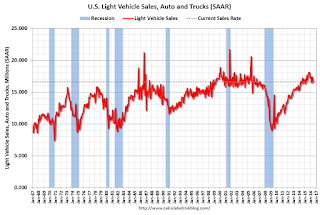
Based on a preliminary estimate from WardsAuto, light vehicle sales were at a 16.62 million SAAR in June.
That is down about 2% from June 2015, and down 4% from the 17.39 million annual sales rate last month.
Click on graph for larger image.
This graph shows the historical light vehicle sales from the BEA (blue) and an estimate for June (red, light vehicle sales of 16.62 million SAAR from WardsAuto).
This was below the consensus forecast of 17.3 million SAAR (seasonally adjusted annual rate).
The second graph shows light vehicle sales since the BEA started keeping data in 1967.

Sales for 2016 - through the first half - are up about 1% from the comparable period last year.
Construction Spending decreased 0.8% in May
by Calculated Risk on 7/01/2016 12:11:00 PM
Earlier today, the Census Bureau reported that overall construction spending decreased 0.8% in May compared to April:
The U.S. Census Bureau of the Department of Commerce announced today that construction spending during May 2016 was estimated at a seasonally adjusted annual rate of $1,143.3 billion, 0.8 percent below the revised April estimate of $1,152.4 billion. The May figure is 2.8 percent above the May 2015 estimate of $1,112.2 billion.Private and public spending decreased in May:
Spending on private construction was at a seasonally adjusted annual rate of $859.3 billion, 0.3 percent below the revised April estimate of $861.9 billion. ...
In May, the estimated seasonally adjusted annual rate of public construction spending was $284.0 billion, 2.3 percent below the revised April estimate of $290.5 billion.
emphasis added
 Click on graph for larger image.
This graph shows private residential and nonresidential construction spending, and public spending, since 1993. Note: nominal dollars, not inflation adjusted.
Private residential spending has been generally increasing, but is 33% below the bubble peak.
Non-residential spending is only 2% below the peak in January 2008 (nominal dollars).
Public construction spending is now 13% below the peak in March 2009.
 The second graph shows the year-over-year change in construction spending.
On a year-over-year basis, private residential construction spending is up 5%. Non-residential spending is up 4% year-over-year. Public spending is down 3% year-over-year.
Looking forward, all categories of construction spending should increase in 2016. Residential spending is still fairly low, non-residential is increasing (except oil and gas), and public spending is also generally increasing after several years of austerity.
This was well below the consensus forecast of a 0.6% increase for May, however construction spending for the previous two years were revised up.
ISM Manufacturing index increased to 53.2 in June
by Calculated Risk on 7/01/2016 10:10:00 AM
The ISM manufacturing index indicated expansion for the fourth consecutive month in June, following five months of contraction. The PMI was at 53.2% in June, up from 51.3% in May. The employment index was at 50.4%, up from 49.2% in May, and the new orders index was at 57.0%, up from 55.7% in May.
From the Institute for Supply Management: June 2016 Manufacturing ISM® Report On Business®
Economic activity in the manufacturing sector expanded in June for the fourth consecutive month, while the overall economy grew for the 85th consecutive month, say the nation's supply executives in the latest Manufacturing ISM®Report On Business®.
The report was issued today by Bradley J. Holcomb, CPSM, CPSD, chair of the Institute for Supply Management® (ISM®) Manufacturing Business Survey Committee. "The June PMI® registered 53.2 percent, an increase of 1.9 percentage points from the May reading of 51.3 percent. The New Orders Index registered 57 percent, an increase of 1.3 percentage points from the May reading of 55.7 percent. The Production Index registered 54.7 percent, 2.1 percentage points higher than the May reading of 52.6 percent. The Employment Index registered 50.4 percent, an increase of 1.2 percentage points from the May reading of 49.2 percent. Inventories of raw materials registered 48.5 percent, an increase of 3.5 percentage points from the May reading of 45 percent. The Prices Index registered 60.5 percent, a decrease of 3 percentage points from the May reading of 63.5 percent, indicating higher raw materials prices for the fourth consecutive month. Manufacturing registered growth in June for the fourth consecutive month, as 12 of our 18 industries reported an increase in new orders in June (down from 14 in May), and 12 of our 18 industries reported an increase in production in June (same as in May)."
emphasis added
 Click on graph for larger image.
Here is a long term graph of the ISM manufacturing index.
This was above expectations of 51.5%, and suggests manufacturing expanded at a faster pace in June than in May.
Thursday, June 30, 2016
Friday: Auto Sales, ISM Mfg, Construction Spending
by Calculated Risk on 6/30/2016 10:12:00 PM
From Paul Krugman: The Macroeconomics of Brexit: Motivated Reasoning?. From the intro:
I believe that Brexit is a tragic development, which will do substantial long-run economic harm. But what we’re hearing overwhelmingly from economists is the claim that it will also have severe short-run adverse impacts. And that claim seems dubious.Friday:
• At 10:00 AM ET, ISM Manufacturing Index for June. The consensus is for the ISM to be at 51.5, up from 51.3 in May. The ISM manufacturing index indicated expansion at 51.3% in May. The employment index was at 49.2%, and the new orders index was at 55.7%.
• Also at 10:00 AM, Construction Spending for May. The consensus is for a 0.6% increase in construction spending.
• All day, Light vehicle sales for June. The consensus is for light vehicle sales to decrease to 17.3 million SAAR in June from 17.4 million in May (Seasonally Adjusted Annual Rate).
Restaurant Performance Index declined in May
by Calculated Risk on 6/30/2016 03:50:00 PM
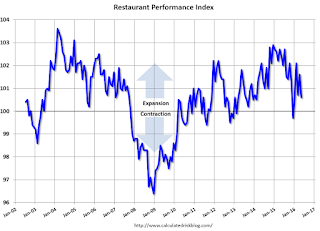
Here is a minor indicator I follow from the National Restaurant Association: RPI drops in May
Due in large part to softer same-store sales and customer traffic results, the National Restaurant Association’s Restaurant Performance Index (RPI) declined in May. The RPI stood at 100.6 in May, down 0.9 percent from a level of 101.6 in April.
"The RPI continued along a choppy trend line in May, with the index bouncing between moderate gains and losses in recent months," said Hudson Riehle, senior vice president of research for the National Restaurant Association.
"Much of the May dip came from declines in the same-store sales and customer traffic indicators, which softened from their stronger April performance. In addition, operators’ expectations for future business conditions are at the lowest level in three and a half years," he said.
emphasis added
 Click on graph for larger image.
The index decreased to 100.6 in May, down from 101.6 in April. (above 100 indicates expansion).
Restaurant spending is discretionary, so even though this is "D-list" data, I like to check it every month.
CoStar: Commercial Real Estate prices increased in May
by Calculated Risk on 6/30/2016 12:21:00 PM
Here is a price index for commercial real estate that I follow.
From CoStar: Composite Price Indices Resume Solid Growth Boosted By Strong Net Absorption
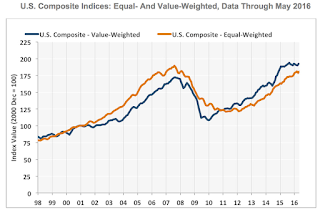
PRICE INDICES RESUMED SOLID GROWTH IN MAY. Both of CCRSI’s two major composite price indices advanced by more than 1% in the month of May 2016, erasing earlier-year declines. After the two major indices backtracked in the first quarter of 2016 amid global economic uncertainty and a seasonal slowdown in investment activity, price growth within the commercial real estate sector during May 2016 returned to the average monthly pace set in the previous several years. The equal-weighted U.S. Composite Index rose 1.1% and the value-weighted U.S. Composite Index advanced 1.2% in May 2016, placing the value-weighted index at its highest level this cycle.
HEALTHY CRE SPACE ABSORPTION CONTRIBUTED TO STRONG PRICE GAINS. Demonstrating the overall demand for CRE space, net absorption across the three major property types—office, retail and industrial—is projected to total 688.5 million square feet for the 12-month period ending in June 2016, a 9.5% increase from the same period ending in June 2015. ...
emphasis added
 Click on graph for larger image.
This graph from CoStar shows the the value-weighted U.S. Composite Index and the equal-weighted U.S. Composite Index indexes.
The value-weighted index increased 1.2% in May and is up 2.2% year-over-year.
The equal-weighted index increased 1.1% in May and is up 6.7% year-over-year.
Note: These are repeat sales indexes - like Case-Shiller for residential - but this is based on far fewer pairs.
Chicago PMI increased in June
by Calculated Risk on 6/30/2016 09:53:00 AM
Chicago PMI: June Chicago Business Barometer Up 7.5 Points to 56.8
The MNI Chicago Business Barometer rose 7.5 points to 56.8 in June from 49.3 in May, the highest since January 2015, led by strong gains in New Orders and Production.This was above the consensus forecast of 50.5.
June’s rebound was just enough to offset the previous two months of weakness, leaving the Barometer broadly unchanged over the quarter at an average of 52.2 in Q2 compared with 52.3 in Q1. New Orders increased sharply on the month to the highest since October 2014 ...
...
Chief Economist of MNI Indicators Philip Uglow said, “June’s sharp increase in the MNI Chicago Business Barometer needs to be viewed in the context of the weakness seen in April and May. Looking at the three-month average provides a better guide this month to the underlying trend in the economy with activity broadly unchanged between Q1 and Q2. Still, on a trend basis activity over the past four months is running above the very low levels seen around the turn of the year.”
emphasis added
Weekly Initial Unemployment Claims increase to 268,000
by Calculated Risk on 6/30/2016 08:34:00 AM
The DOL reported:
In the week ending June 25, the advance figure for seasonally adjusted initial claims was 268,000, an increase of 10,000 from the previous week's revised level. The previous week's level was revised down by 1,000 from 259,000 to 258,000. The 4-week moving average was 266,750, unchanged from the previous week's revised average. The previous week's average was revised down by 250 from 267,000 to 266,750.The previous week was revised down by 1,000.
There were no special factors impacting this week's initial claims. This marks 69 consecutive weeks of initial claims below 300,000, the longest streak since 1973.
The following graph shows the 4-week moving average of weekly claims since 1971.
 Click on graph for larger image.
The dashed line on the graph is the current 4-week average. The four-week average of weekly unemployment claims was unchanged at 266,750.
This was close to the consensus forecast. The low level of claims suggests relatively few layoffs.
Wednesday, June 29, 2016
Zillow Forecast: Expect About the Same Growth in May for the Case-Shiller Indexes
by Calculated Risk on 6/29/2016 04:35:00 PM
The Case-Shiller house price indexes for April were released yesterday. Zillow forecasts Case-Shiller a month early, and I like to check the Zillow forecasts since they have been pretty close.
From Zillow: May Case-Shiller Forecast: April's Modest Monthly Slowdown Should Continue
April Case-Shiller data showed seasonally adjusted monthly home price growth that was slightly weaker than expected, and annual growth at a pace in line with recent months. Looking ahead, Zillow’s May Case-Shiller forecast calls for more of the same, with seasonally adjusted monthly growth in the 10- and 20-city indices falling slightly from April while annual growth stays largely flat.The year-over-year change for the 20-city index will probably be slightly lower in the May report than in the April report. The change for the National index will probably be about the same.
The May Case-Shiller National Index is expected to grow 5 percent year-over-year and 0.1 percent month-to-month, both unchanged from April. We expect the 10-City Index to grow 4.7 percent year-over-year and 0.1 percent from April. The 20-City Index is expected to grow 5.3 percent between May 2015 and May 2016 and 0.1 percent from April.
Zillow’s May Case-Shiller forecast is shown in the table below. These forecasts are based on today’s April Case-Shiller data release and the May 2016 Zillow Home Value Index (ZHVI). The May Case-Shiller Composite Home Price Indices will not be officially released until Tuesday, July 26.


