 RSS Feed
 by Calculated Risk on 3/27/2016 10:22:00 AM
Sunday, March 27, 2016
Hotels: Supply increased faster than Demand in January and February
From HotelNewsNow.com: Freitag’s 5: US RevPAR growth underwhelms in February
1. RevPAR has now grown for 72 monthsAnd weekly data from HotelNewsNow.com: STR: US hotel results for week ending 19 March
Even though the numbers are small, they are positive. We expect them to be so for the next 18 months. Just like last month, RevPAR growth was driven by average daily rate, as occupancies are on a declining trajectory:
This should not come as a surprise because we have been warning about pipeline growth for a while. But it shows that when the weather does not cooperate and the U.S. economy catches a mild cold, there is an immediate impact on occupancies. However, the 61.7% occupancy for February is still the second-highest occupancy ever recorded.
2. Supply growth has outpaced demand growth for two consecutive months
Demand increased only 0.6%. It is worth pointing out that demand is still growing, so while that continues to be true we are breaking demand records every month.
But 0.6% growth sounds pretty flat, and with the increase in supply of 1.6% you get the occupancy decline as described above. As I suggested last month, the supply uptick is a sequential 0.1% (from +1.5% in January), but it is also worth emphasizing that it represents a doubling of the supply percent change from February 2015, which at the time was 0.8% growth.

The U.S. hotel industry reported positive results in the three key performance metrics during the week of 13-19 March 2016, according to data from STR.The following graph shows the seasonal pattern for the hotel occupancy rate using the four week average. The occupancy rate should continue to increase into the Spring, and then increase further during the Summer travel period.
In year-over-year comparisons, the industry’s occupancy increased 1.9% to 70.5%. Average daily rate for the week was up 4.2% to US$127.72. Revenue per available room increased 6.2% to US$90.04.
emphasis added
 The red line is for 2016, dashed orange is 2015, blue is the median, and black is for 2009 - the worst year since the Great Depression for hotels.
2015 was the best year on record for hotels.
So far 2016 is just behind 2015.
Data Source: Smith Travel Research, Courtesy of HotelNewsNow.com
Saturday, March 26, 2016
Schedule for Week of March 27, 2016
by Calculated Risk on 3/26/2016 02:02:00 PM
The key report this week is the March employment report on Friday.
Other key indicators include March vehicle sales, the March ISM manufacturing index, February Personal income and outlays, and the January Case-Shiller house price index.
Fed Chair Janet Yellen speaks on Tuesday on the "Economic Outlook and Monetary Policy".
8:30 AM ET: Personal Income and Outlays for February. The consensus is for a 0.1% increase in personal income, and for a 0.1% increase in personal spending. And for the Core PCE price index to increase 0.2%.
10:00 AM: Pending Home Sales Index for February. The consensus is for a 1.5% increase in the index.
10:30 AM: Dallas Fed Manufacturing Survey for March. This is the last of the regional Fed manufacturing surveys for March.
 9:00 AM: S&P/Case-Shiller House Price Index for January. Although this is the January report, it is really a 3 month average of November, December and January prices.
This graph shows the nominal seasonally adjusted National Index, Composite 10 and Composite 20 indexes through the December 2015 report (the Composite 20 was started in January 2000).
The consensus is for a 5.8% year-over-year increase in the Comp 20 index for January. The Zillow forecast is for the National Index to increase 5.6% year-over-year in January.
12:20 PM: Speech by Fed Chair Janet Yellen, Economic Outlook and Monetary Policy, At the Economic Club of New York Luncheon, New York, New York
7:00 AM ET: The Mortgage Bankers Association (MBA) will release the results for the mortgage purchase applications index.
8:15 AM: The ADP Employment Report for March. This report is for private payrolls only (no government). The consensus is for 203,000 payroll jobs added in March, down from 214,000 in February.
8:30 AM: The initial weekly unemployment claims report will be released. The consensus is for 266 thousand initial claims, up from 265 thousand the previous week.
9:45 AM: Chicago Purchasing Managers Index for March. The consensus is for a reading of 50.3, up from 47.6 in February.
8:30 AM: Employment Report for March. The consensus is for an increase of 210,000 non-farm payroll jobs added in March, down from the 242,000 non-farm payroll jobs added in February.
The consensus is for the unemployment rate to be unchanged at 4.9%.
 This graph shows the year-over-year change in total non-farm employment since 1968.
In February, the year-over-year change was 2.67 million jobs.
A key will be the change in real wages.
 10:00 AM: ISM Manufacturing Index for March. The consensus is for the ISM to be at 50.5, up from 49.5 in February.
Here is a long term graph of the ISM manufacturing index.
The ISM manufacturing index indicated contraction at 49.5% in February. The employment index was at 48.5%, and the new orders index was at 51.5%.
10:00 AM: Construction Spending for February. The consensus is for a 0.2% increase in construction spending.
 All day: Light vehicle sales for March. The consensus is for light vehicle sales to increase to 17.6 million SAAR in March from 17.5 million in February (Seasonally Adjusted Annual Rate).
This graph shows light vehicle sales since the BEA started keeping data in 1967. The dashed line is the February sales rate.
10:00 AM: University of Michigan's Consumer sentiment index (final for March). The consensus is for a reading of 90.9, up from the preliminary reading 91.0.
March 2016: Unofficial Problem Bank list declines to 222 Institutions, Q1 2016 Transition Matrix
by Calculated Risk on 3/26/2016 11:21:00 AM
This is an unofficial list of Problem Banks compiled only from public sources.
Here is the unofficial problem bank list for March 2016.
Changes and comments from surferdude808:
Update on the Unofficial Problem Bank List for March 2016. During the month, the list fell from 228 institutions to 222 after eight removals and two additions. Assets dropped by $1.4 billion to an aggregate $64.6 billion. A year ago, the list held 349 institutions with assets of $106.2 billion.
This month, actions have been terminated against Bank of Washington, Washington, MO ($599 million); Community First Bank, Inc., Walhalla, SC ($355 million); Union National Bank and Trust Company of Elgin, Elgin, IL ($311 million); First State Bank, Mesquite, TX ($172 million Ticker: CFOK); American Bank of Baxter Springs, Baxter Springs, KS ($91 million); Freedom Bank, Columbia Falls, MT ($58 million); and Pacific West Bank, West Linn, OR ($54 million Ticker: PWBO).
North Milwaukee State Bank, Milwaukee, WI ($67 million) exited the list through failure on March 11, 2016. This is first failed bank since October 2, 2015.
The additions this month were both from Kentucky -- Peoples Bank & Trust Company of Hazard, Hazard, KY ($278 million) and Blue Grass Federal Savings and Loan Association, Paris, KY ($38 million). Perhaps in a few months, the list will begin to see new additions from banks operated in local economies where the oil & gas industry is a large driver.

With it being the end of the first quarter, we bring an updated transition matrix to detail how banks are moving off the Unofficial Problem Bank List. Since the Unofficial Problem Bank List was first published on August 7, 2009 with 389 institutions, a total of 1,705 institutions have appeared on a weekly or monthly list at some point. There have been 1,483 institutions that have transitioned through the list. Departure methods include 837 action terminations, 396 failures, 236 mergers, and 14 voluntary liquidations. The first quarter of 2015 started with 250 institutions on the list, so the 28 action terminations during the quarter reduced the list by 11.2 percent. Of the 389 institutions on the first published list, 26 or 6.7 percent still remain more than six years later. The 396 failures represent 23.2 percent of the 1,705 institutions that have made an appearance on the list. This failure rate is well above the 10-12 percent rate frequently cited in media reports on the failure rate of banks on the FDIC's official list.
| Unofficial Problem Bank List | |||
|---|---|---|---|
| Change Summary | |||
| Number of Institutions | Assets ($Thousands) | ||
| Start (8/7/2009) | 389 | 276,313,429 | |
| Subtractions | |||
| Action Terminated | 162 | (61,658,424) | |
| Unassisted Merger | 40 | (10,183,639) | |
| Voluntary Liquidation | 4 | (10,584,114) | |
| Failures | 157 | (184,803,449) | |
| Asset Change | (2,514,219) | ||
| Still on List at 3/31/2016 | 26 | 6,569,584 | |
| Additions after 8/7/2009 | 196 | 58,049,809 | |
| End (3/31//2016) | 222 | 64,619,393 | |
| Intraperiod Deletions1 | |||
| Action Terminated | 675 | 276,185,701 | |
| Unassisted Merger | 196 | 78,425,969 | |
| Voluntary Liquidation | 10 | 2,324,142 | |
| Failures | 239 | 119,641,968 | |
| Total | 1,120 | 476,577,780 | |
| 1Institution not on 8/7/2009 or 3/31/2016 list but appeared on a weekly list. | |||
Friday, March 25, 2016
DOT: Vehicle Miles Driven increased 2.0% year-over-year in January
by Calculated Risk on 3/25/2016 01:32:00 PM
The Department of Transportation (DOT) reported today:
Travel on all roads and streets changed by 2.0% (4.8 billion vehicle miles) for January 2016 as compared with January 2015.The following graph shows the rolling 12 month total vehicle miles driven to remove the seasonal factors.
Travel for the month is estimated to be 240.7 billion vehicle miles.
The seasonally adjusted vehicle miles traveled for January 2016 is 264.3 billion miles, a 2.7% (7.0 billion vehicle miles) increase over January 2015. It also represents a -0.8% change (-2.1 billion vehicle miles) compared with December 2015.
The rolling 12 month total is moving up - mostly due to lower gasoline prices - after moving sideways for several years.
 Click on graph for larger image.
In the early '80s, miles driven (rolling 12 months) stayed below the previous peak for 39 months.
Miles driven (rolling 12) had been below the previous peak for 85 months - an all time record - before reaching a new high for miles driven in January 2015.
The second graph shows the year-over-year change from the same month in the previous year.
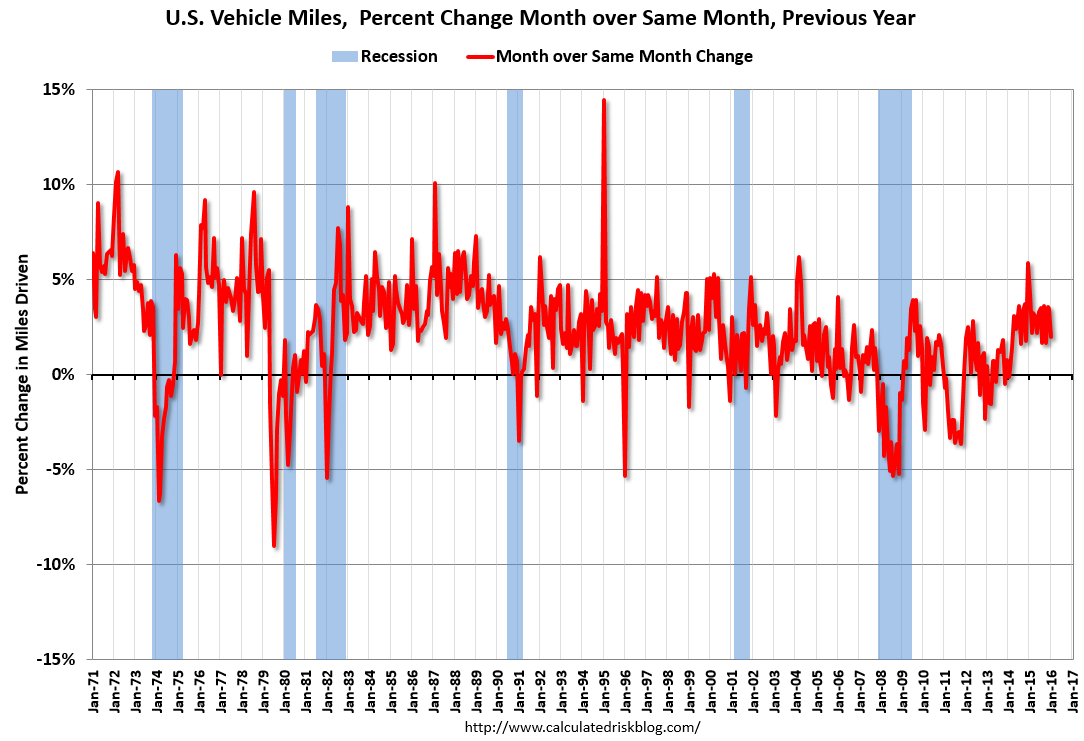 In January 2015, gasoline averaged $2.06 per gallon according to the EIA. That was down from January 2015 when prices averaged $2.21 per gallon.
Gasoline prices aren't the only factor - demographics are also important. However, with lower gasoline prices, miles driven on a rolling 12 month basis, is setting new highs each month.
BLS: Unemployment Rate decreased in 22 States in February
by Calculated Risk on 3/25/2016 10:19:00 AM
From the BLS: Regional and State Employment and Unemployment Summary
Regional and state unemployment rates were little changed in February. Twenty-two states had unemployment rate decreases from January, 8 states had increases, and 20 states and the District of Columbia had no change, the U.S. Bureau of Labor Statistics reported today.
...
New Hampshire and South Dakota had the lowest jobless rates in February, 2.7 percent each, followed by North Dakota, 2.9 percent. Alaska had the highest rate, 6.6 percent, closely followed by Mississippi and West Virginia, 6.5 percent each.
 Click on graph for larger image.
This graph shows the current unemployment rate for each state (red), and the max during the recession (blue). All states are well below the maximum unemployment rate for the recession.
The size of the blue bar indicates the amount of improvement. The yellow squares are the lowest unemployment rate per state since 1976.
The states are ranked by the highest current unemployment rate. Alaska, at 6.6%, had the highest state unemployment rate.
 The second graph shows the number of states (and D.C.) with unemployment rates at or above certain levels since January 2006. At the worst of the employment recession, there were 11 states with an unemployment rate at or above 11% (red).
Currently no state has an unemployment rate at or above 7% (light blue); Only seven states are at or above 6% (dark blue).
Q4 GDP Revised Up to 1.4% Annual Rate
by Calculated Risk on 3/25/2016 08:34:00 AM
From the BEA: Gross Domestic Product: Fourth Quarter 2015 (Third Estimate)
Real gross domestic product -- the value of the goods and services produced by the nation's economy less the value of the goods and services used up in production, adjusted for price changes -- increased at an annual rate of 1.4 percent in the fourth quarter of 2015, according to the "third" estimate released by the Bureau of Economic Analysis. In the third quarter, real GDP increased 2.0 percent.Here is a Comparison of Third and Second Estimates. PCE growth was revised up from 2.0% to 2.4%. Residential investment was revised up from 8.0% to 10.1%. This was above the consensus forecast.
The GDP estimate released today is based on more complete source data than were available for the "second" estimate issued last month. In the second estimate, the increase in real GDP was 1.0 percent. With this third estimate for the fourth quarter, the general picture of economic growth remains largely the same; personal consumption expenditures (PCE) increased more than previously estimated ...
emphasis added
Thursday, March 24, 2016
Goldman: "Inflation Finally Begins to Firm"
by Calculated Risk on 3/24/2016 07:42:00 PM
Friday:
• At 8:30 AM ET, Gross Domestic Product, 4th quarter 2015 (Third estimate). The consensus is that real GDP increased 1.0% annualized in Q4, unrevised from the second estimate.
• At 10:00 AM, Regional and State Employment and Unemployment (Monthly) for February 2016 from BLS.
A few excerpts from a research piece by Goldman Sachs economists David Mericle and Chris Mischaikow: Inflation Finally Begins to Firm
Fed officials have long argued that inflation has been soft primarily due to transitory factors and would eventually rise as these influences faded and the labor market tightened. Over the last half year, inflation has picked up substantially in a manner that closely fits the Fed’s narrative. Yet at the March FOMC meeting, both the Committee’s inflation projections and comments from Chair Yellen suggested a puzzlingly skeptical take on the encouraging recent data.
We see three broad reasons for the skepticism of some FOMC participants. First, some see ... one-off factors that are unlikely to persist. Second, others likely see downside risks from recent declines in inflation expectations. Third, some participants likely expect further drag from past or future dollar appreciation. ...
In our view, the FOMC had it right the first time. We expect disinflationary forces to fade further this year, while inflationary pressures should strengthen as the labor market continues to tighten ... As a result, we expect core PCE inflation to reach 1.8% by 2016Q4, 0.2pp above the FOMC’s projection, and headline PCE inflation to reach 1.5%, 0.3pp above the FOMC’s projection.
... As the year progresses, we expect that the FOMC will gradually revise up its inflation projections and ultimately conclude that an even stronger acceleration to 1.8% merits three hikes this year rather than two.
Vehicle Sales Forecast: Sales to Reach All Time High for the Month of March
by Calculated Risk on 3/24/2016 02:00:00 PM
The automakers will report March vehicle sales on Friday, April 1st.
Note: There were 27 selling days in March, up from 25 in March 2015.
From WardsAuto: Forecast: March Sales Set to Hit Record-High
A WardsAuto forecast calls for U.S. automakers to deliver 1.7 million light vehicles this month, a record high for March and the largest volume for any month since July 2005’s 1,804,240 units.Looks like another strong month for vehicle sales.
The forecasted daily sales rate of 61,727 over 27 days is a best-ever March result. This DSR represents a 0.2% improvement from like-2015 (25 days), while total volume for the month would be 8.2% greater than year-ago. If deliveries meet or exceed WardsAuto’s expectations, March will be the eight consecutive month to outpace prior-year on a DSR basis.
...
The report puts the seasonally adjusted annual rate of sales for the month at 17.3 million units, below the 17.4 million SAAR from the first two months of 2016 combined, but well above the 17.1 million SAAR from same-month year-ago.
emphasis added
Kansas City Fed: Regional Manufacturing Activity "remained negative" in March
by Calculated Risk on 3/24/2016 11:00:00 AM
From the Kansas City Fed: Tenth District Manufacturing Activity Remained Negative
The Federal Reserve Bank of Kansas City released the March Manufacturing Survey today. According to Chad Wilkerson, vice president and economist at the Federal Reserve Bank of Kansas City, the survey revealed that Tenth District manufacturing activity remained negative.The Kansas City region continues to be hit hard by lower oil prices and the stronger dollar.
“Factories reported another decline in activity in March, although the drop was somewhat smaller than in the previous three months” said Wilkerson.
...
Tenth District manufacturing activity remained negative, while producers’ expectations for future activity weakened. Most price indexes edged higher in March, but remained at low levels.
The month-over-month composite index was -6 in March, up from -12 in February and -9 in January ... The new orders, order backlog, and employment indexes improved slightly but remained in negative territory.
emphasis added
Weekly Initial Unemployment Claims increase to 265,000
by Calculated Risk on 3/24/2016 08:38:00 AM
The DOL reported:
Note: This week's release reflects the annual revision to the weekly unemployment claims seasonal adjustment factors. The seasonal adjustment factors used for the UI Weekly Claims data from 2011 forward, along with the resulting seasonally adjusted values for initial claims and continuing claims, have been revised.The previous week was revised down.
In the week ending March 19, the advance figure for seasonally adjusted initial claims was 265,000, an increase of 6,000 from the previous week's revised level. The previous week's level was revised down by 6,000 from 265,000 to 259,000. The 4-week moving average was 259,750, an increase of 250 from the previous week's revised average. The previous week's average was revised down by 8,500 from 268,000 to 259,500.
There were no special factors impacting this week's initial claims. This marks 55 consecutive weeks of initial claims below 300,000, the longest streak since 1973.
Note: The following graph shows the 4-week moving average of weekly claims since 1971.
 Click on graph for larger image.
The dashed line on the graph is the current 4-week average. The four-week average of weekly unemployment claims increased to 259,750.
This was below the consensus forecast of 268,000. The low level of the 4-week average suggests few layoffs.


